Multiclass Brain Tumor Classification using SVM
Akhanda Nand Pathak
Department of Electronics and Communication Engineering Dr. B. R. Ambedkar NIT Jalandhar,
Punjab,India
Ramesh Kumar Sunkaria
Department of Electronics and Communication Engineering
Dr. B. R. Ambedkar NITJalandhar, Punjab,India
ABSTRACT
The aim of this study is to present a Computer aided (CAD) system for assisting radiologists in multiclass classification of brain tumors. The diagnosis method consists of four stages pre-processing of MR images, feature extraction, feature reduction and classification. The features are extracted based on discrete wavelet transformation (DWT) using Haarwavele. In the second stage the features of Magnetic resonance images has been reduced using Principal Component analysis(PCA), without degrading the performance of system much. PCA helps in reducing the execution time for classification. In the last stage classification method, Support Vector Machine (SVM) for multi class data is employed. This work is the modification and extension of the previous studies on the diagnosis of brain diseases,to classify tumors in different classes on the basis of location in different parts of brain.
Key words
Discrete wavelet transform (DWT), Magnetic resonance imaging (MRI), Principal Component Analysis(PCA), Support vector machine (SVM).
1. INTRODUCTION
The incidence of brain tumors is increasing very fast, especially in the older population than compared with Younger population. For example in India, the International Agency for Research on Cancer estimated indirectly that about 635 000 people died from cancer in 2008, representing about 8% of all estimated global cancer deaths and about 6% of all deaths in India [1]. The absolute number of cancer deaths in India is projected to increase because of population growth and increasing life expectancy. Over the last 20 years, the overall incidence of cancer, including brain cancer, has increased by more than10%, as reported in the National Cancer Institute statistics (NCIS).
MRI scans have become very useful for assessing many brain related disorders. MRI regarded as superior tool for brain imaging because it does not use ionizing radiation (X-rays) and MRI provides detailed pictures of brain and nerve tissues in multiple planes without obstruction by overlying bones. The task of analyzing a large amount MRI scans daily demanded by medical centers is tiresome and radiologists should have some automatic tools to support it. Recent research has shown different approaches for classification of MRI data. Two basic approaches to classify MRI data are supervised technique such as artificial neural networks[8] and support vector machine
(SVM) [2][9], and unsupervised classification techniques such as self-organization map (SOM) [2], fuzzy c-means [3] and k nearest neighbor classifier. In this worka contemporary computational intelligence technique has been applied, namely, support vector machines (SVM) as a classifier for multi classes for automated recognition of different types of brain tumors in different parts of brain.
Wavelet transform is an effective tool for feature extraction, because it allows analysis of images at different levels of resolution [5]. This technique needs large storage and is computationally more expensive [4]. Hence there is a requirement of an alternative method for dimension reduction . For reducing the feature vector dimension and increasing the discriminative power, the principal component analysis (PCA) has been used. Principal component analysis is used since it effectively reduces the dimensionality of the data and therefore reduces the computational cost of analyzing new data. To perform the classification of different types of tumors in different parts of brain on the input data, the SVM for multi class has been used.
The contribution of this presented work is the integration of an efficient feature extraction tool and a robust classifier to perform a very robust and accurate automated classification of brain tumors in MRI images in multiclasses. The proposed method for the themulticalass classification of the brain tumors focuses on reducing computation time by selecting minimum features from MRI image without affecting the performance of system and to classify different types of brain tumors in different parts of brain using SVM for multi class data analysis.
The rest of this paper is organized as follows: section 2 proposed method for feature extraction and feature deduction with description of the support vector machine. Section 3 experimentally demonstrates the performance of the proposed methods. Finally, section 4 describes the conclusion of this paper.
2. METHODOLOGY
Finally, the pattern recognition method SVM is used for classification in multiclass. The result indicates fully classification of data. This work is the extension and modification of the method introduced in [3]. But, here the case is different, the database contains different images, a pre-processing step has been introduced and the number of features obtained by PCA for maximum classification rate is less and better classification rate has been achieved.
2.1Wavelet Transform
Wavelets are mathematical functions. It decomposes data into various frequency components and then study each component with a resolution matched to its scale. Wavelets is very powerful mathematical tool for analysis of complex datasets. The Fourier transform provides representation of an image based only on its frequency content [10].Hence this representation is not spatially localized while wavelet functions are localized in space as well as frequency. The Fourier transform decomposes a signal into a spectrum of frequencies where as the wavelet analysis decomposes a signal into a hierarchy of scales ranging from the coarset scale. Hence Wavelet transforms[5] which provide representation of an image at various resolutions is a better tool for feature extraction from images.
Continous wavelet transform is given by:
function wavelet
frequency 1 s
frequency of
measure patameter
scaling is s
time of measure patameter
n translatio is
) 1 ( dt
s t t f s 1 CWT
t * f
2.1.2 Discrete Wavelet Transform:
The Discrete wavelet transforn is an implementation of the continuous wavelet transform using a discrete set of the wavelet scales and translation [2]. For practical computations, the wavelet transform is to be discretized. The scale parameter isdiscretized on alogarithmic grid. The translation parameter (t) is discretized with respect to the scale parameter, i.e. sampling is done on the dyadic (as the base of the logarithm is usually chosen as two) sampling grid. The discretized scale and translation parameters are given by, s =2-m and t = n 2-m ,where m, n ϵ Z , the set of all integers.
Thus, the family of wavelet functions is represented in[2]:
t
2
j
2
jt
k
j
,
k
Z
jk
(2)Forward DWT:
t
jk *
jk
f
t
t
a
(3)Inverse DWT:
t
a
t
f
jkk j
jk
(4)2.1.3 Feature Extraction Using Wavelet
Transform:
The present system uses the discrete wavelet transform (DWT) coefficients as the feature vector. The wavelet is a powerful mathematical tool for feature extraction, and has
been used to extract the wavelet coefficient from MR images. Wavelets are localized basis functions, which are scaled and shifted versions of some fixed mother wavelets. The main advantage of wavelets is that they provide localized frequency information about the function of a signal, which is particularly beneficial for classification [11].
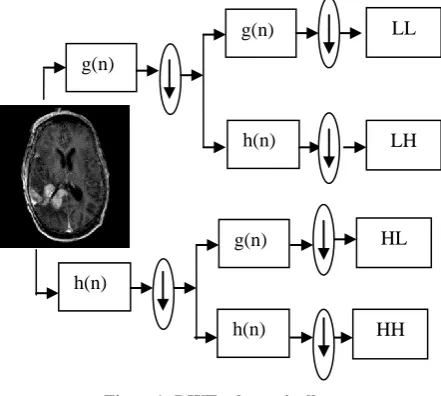
[image:2.595.326.547.154.352.2]Figure1: DWT schematically
Fig. 1 illustrates DWT schematically. The original image is processed along the x and y direction by h(n)and g(n)filters which, is the row representation of the original imag As a result of this transform there are 4 sub-band (LL, LH, HH, HL) images at each scale. Sub-band image LL is used only for DWT calculation at the next scale. To compute the wavelet features in the first stage, the wavelet coefficients are calculated for the LL sub-band using Haar wavelet function[ 12].The Haarwavelet is one of the simplest wavelets. Basically, it is one period of a square wave. Because of its simplicity, it is often the wavelet to be chosen [13].
2.2 Principal Component Analysis:
After taking lower resolution image from wavelet decomposition for feature extraction,feature reduction technique is applied.The principal component analysis and independent component analysis (ICA) are two well-known tools for transforming the existing input features into a new lower-dimension feature space[12]. In PCA, the input feature space is transformed into a lower-dimensional feature space using the largest eigenvectors of the correlation matrix.In the ICA, the original input space is transformed into an independent feature space with a dimension that is independent of the other dimensions. PCA is the most widely used subspace projection technique. These methods provide suboptimal solution with a low computational cost and computational complexity[7].
2.2.1Implementing
PCA
in
image
processing:
Let we hve a database of M images each of size N×N.
Step 1: Image I is converted to a vector Γ of size N2 ×1. g(n)
h(n)
0)
LL g(n)
h(n)
0)
h(n)
0) g(n)
LH
HL
N2×1 Vector
Each image is converted to a vector Γi of size N2×1. Step 2:Compute average face vector Ψ.
M 1 i M 1 (5)Step 3: Subtract the mean Face
i i (6)
Step 4:Compute the covariance Matrix C:
....
N MMatrix
A where ) 7 ( Matrix N N AA M 1 C 2 M 2 1 2 2 T M 1 i T i i
Step 5: Compute the eigen vectors ui of AAT: Matrix AAT is very large not practical Step 5.1: Consider matrix ATA (M×M Matrix) Step 5.2: Compute the eigen vectors vi of A
T A (M×M Matrix) i i i T v Av
A (8)
Relation between
u
iandv
i
9
Av
u
where
u
Cu
Av
CAv
Av
Av
AA
v
Av
A
i i i i i i i i i i i T i i i T
Thus AATand ATA have same eigen values and their eigen vectors are related as
u
i
Av
iNote 1: AAT can have up to N2eigen values and eigen vectors.
Note 2: ATA can have up to M eigen values and eigen vectors.
Note3: M eigen values of ATA (along with their
corresponding eigen vectors) correspond to M largest eigen values of AAT(along with their corresponding eigen vectors).
Step 5.3: Compute best eigen vectors of AAT :
i
i Av
u
Important: Normalize
u
isuch that ui 1Step 5: Keep only seven eigen vectors (corresponding to seven largest eigen values).
A 256×256 image after two level wavelet decomposition produce a 64×64 image of lower resolution having 4096 pixels . After applying PCA we decompose each image along seven different eigen vectors and weights of MRI image along these eigen vectors will be used for classification.
2.3 Support Vector machine
In this work,support vector machine is used as a classifier. In binary classification SVM takes input labeled data from two classes and outputs a model file for classifying new unlabeled/ labeled data into one of two classes. The SVM originated from the idea of the structural risk minimization that was developed by Vapnik. Support vector machines are primarily two class classifiers that have been shown to
be attractive and more systematic to learning linear or non-linear class boundaries. The use of SVM, like any other machine learning technique, involves two basic steps namely training and testing. Training an SVM involves feeding known data to the SVM along with previously known decision values, thus forming a finite training set. It is from the training set that an SVM gets its intelligence to classify unknown data.
The key concept of SVM is the use of hyperplanes to define decision boundaries separating between data points of different classes. SVMs are able to handle simple, linear, classification tasks, as well as more complex, i.e. Nonlinear, classification problems. Both separable and nonseparable problems are handled by SVMs in the linear and nonlinear case. The idea behind SVMs is to map the original data points from the input space to a high-dimensional, or even infinite-dimensional, feature space such that the classification problem becomes simpler in the feature space. The mapping is done by a suitable choice of a kernel function.
Consider a training data set
N 1 i i i,yx with
xiϵRd xi being the input vectors and yiϵ{-1,+1} the class labels. SVMs map the d- dimensional input vector x from the input space to the dh dimensional feature space using a (non) linear function φ(.):Rd
Rdh. The separating hyperplane in the feature space is then defined as
x b 0wT with b ϵ R and w an unknown vector with same dimension as φ(x). A data point x is assigned to the first class if f
x sign
wT
x b
equal to +1 or to the second class if f(x) equals -1[14].In case the data are linearly separable, the separating hyperplane can be defined in many ways. However, SVMs are based on the maximum margin principle, and aim at constructing a hyperplane with maximal distance between the two classes. The SVM classifier starts from the following formulations
x b 1 for y 1 w 1 y for 1 b x w i T i T Equivalent to
w x b
1 i 1,...,Nyi T
(10) The classifier is written as
x sign
w
x b
f T
In Figure 3, SVM classification with a hyper plane that minimizes the separating margin between the two classes are indicated by data points marked by “X” s and “O”s. Support vectors are elements of the training set that lie on the boundary hyper planes of the two classes.
Figure2: Illustration of a separating hyperplane with a maximum margin determined by a linear SVM.
SVM has been used for classification of different kind of tumors in different parts of brain in different classes depending on their location.SVM is implemented in MATLAB .
3. RESULTS AND DISCUSSIONS
In present work a supervised method for the classification of MR imges in multiclass has been applied. As mentioned the method employs four stages: Preprocessing, feature extraction, feature reduction and classification. After the histogram equalization of images the first two level coefficients of decomposition of MR images with Haar are computed to extract the features. Then, the 2nd approximation component and all detailed components are used as the wavelet coefficients. These coefficients are used for feature extraction. A 256×256 image after two level wavelet decomposition produces a 64×64 image of lower resolution having 4096 pixels. The dimension of feature vector is 4096 and Now Principal component analysis is used for reducing the no. of features. After applying the PCA each image is decomposed along seven different eigen vectors. Reduction of feature dimension by PCA leads to increase the accuracy rates of classification. Then classifier based on pattern recognition method (SVM) is used for classification.Data Set Training is given below:
Class 1:
Class 2:
Class 3:
Class 4:
Class 5:
Data Set Testing is given below:
Matrix used to analyze the performance of the proposed model is overall classification Accuracy. The basic data structure used for evaluation is Confusion Matrix. Given a Hyperplane
optimalHyperplane
Maximum margine
Hyperplane
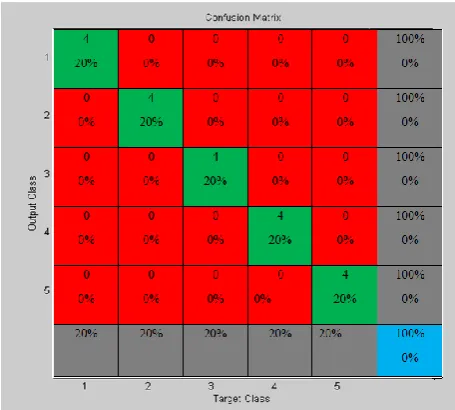
Confusion Matrix shown in Table 1, in context of brain tumor classification system
Table 1: Confusion matrix for PCA-SVM
Above results shows that the proposed system has high classification accuracy for different types of tumors in brain and less computation due to the feature reduction based on the PCA. The Result shows that the individual class accuracy as well as overall accuracy is 100%.
4. CONCLUSIONS
As proposed method provides reliable and fast detection of different types of brain tumors. Therefore it can be used in fully automated systems for tumor detection. The designed system is an efficient system for Detection and Classification of Brain Cancer from a given MRI image of cancer affected patients.
REFERENCES
[1]Cancer mortality in India: a nationally representative survey
[2] S. Chaplot, L.M. Patnaik, N.R. Jagannathan, Classification of magnetic resonance brain images using wavelets as input to support vector machine and neural network, Biomed. Signal Process. Control 1 (2006) 86–92
[3]M. Maitra, A. Chatterjee, Hybrid multiresolutionSlantlet transform and fuzzy c-means clustering approach for normal-pathological brain MR image segregation,
Med. Eng. Phys. (2007),
doi:10.1016/j.medengphy.2007.06.009.
[4] S. Kara, F. Dirgenali, A system to diagnose atherosclerosis via wavelet transforms, principal component analysis and artificial neural networks,Expert Syst. Appl. 32 (2007) 632–640
[5] S.G. Mallat, A theory of multiresolution signal decomposition: the wavelet representation, IEEE Trans. Pattern Anal. Mach. Intell. 11 (7) (1980) 674– 693.
[6] StephaneMallat , Wen Liang Hwang , Singularity detection and processing with wavelets IEEE Trans. Information Theory. Vol.38 No(2) (1992) 621–622. [7]A.K. Jain, Robert P.W. Duin, Jianchang Mao, Statistical pattern recognition: A review, IEEE Trans. Pattern Anal. Mach. Intell., 22 (2000) 4–37.
[8] R.P. Lippmann, An introduction to computing with neural nets, IEEE Acoustics Speech Signal Processing Mag. 4 (2) (1987) 4–22.
[9] V.N. Vapnik, Statistical Learning Theory, Wiley, New York, 1998.
[10] Oppenheim, A. V., Schafer, R. W., Discrete- Time signal Processing, Englewood Cliffs, NJ, Prentice- Hall, 1989.
[11] K. Karibasappa, S. Patnaik, Face recognition by ANN using wavelet transform coefficients, IE (India) J. Computer Eng. 85 (2004) 17–23.
[12] El-Sayed Ahmed El-Dahshan a, Tamer Hosny b, Abdel-Badeeh M. Salem “Hybrid intelligent techniques for MRI brain images classification” Digital Signal Processing 20 (2010) 433–441.
[13] K. Roy, P. Bhattacharya, Optimal features subset selection and classification for Iris recognition, J.
Image Video Process. (2008),
doi:10.1155/2008/743103