http://dx.doi.org/10.29322/IJSRP.9.02.2019.p8649 www.ijsrp.org
Land cover, land use Changes and Agroforestry Practices
at Pawe Resettlement District, Ethiopia.
Mehari Mariye
a, Melesse Maryo
b, Tigabu Dinke
c, Yang Changming
a*, Brhane Weldegebrial
a,
a
College of Environmental Science and Engineering, University of Tongji, Shanghai 200092, China, Email:- [email protected]
b Ethiopian Biodiversity Institute -Ethiopia, Addis Ababa, Email, [email protected]
*a Corresponding Author:Email:[email protected]; Tel +8618917692875 c
University of Mekelle college natural resource- Ethiopia, Addis Ababa
DOI: 10.29322/IJSRP.9.02.2019.p8649 http://dx.doi.org/10.29322/IJSRP.9.02.2019.p8649
Abstract: The causes of land cover /land use (LCLU) change are various, and in Ethiopia resettlement undertakings are increasingly
becoming a reason for ongoing changes in LCLU. This study of LCLU changes and of advances and performance of agroforestry
practices was conducted at Pawe, a resettlement area in northwestern Ethiopia. Investigation of LCLU changes involved a comparison of classified satellite images from 1986 to 2001, coupled with the application of geographic information systems (GIS) and re mote
sensing techniques. Normalized difference vegetation indices (NDVIs) for the two years were also calculated and compared, to
supplement the changes in the natural vegetation cover over the period. In addition, with the help of selected participatory methods,
data for the assessment of agroforestry practices, perceptions of the locals about LCLU change and other socio-economic dimensions of the resettlement district, were collected.
From the 1986 satellite image, four distinct LCLU classes were described: (i) Bare Land, (ii) Grassland, (iii) Bamboo and Thickets,
(iv) Agriculture land/Settlement. The same procedure for the 2001 image resulted in five distinct LCLU classes: (i) Bare Land, (ii) Grassland, (iii) Irrigated land, (iv) Investment Agriculture and (v) Agriculture land/Settlement. Over the 15-year study period, changes
in the bamboo and thickets LCLU class was striking; it was completely changed to other LCLU classes at an annual reduction rate of 3.26%, equivalent to an area reduction of 1224.4 hectares. The calculated NDVIs also revealed the indiscriminate vegetation
clearance following the establishment of the resettlement district. Multiple factors, such as agricultural land expansion, construction wood harvesting, and fuelwood collection were mentioned as causes of the reduction in vegetation cover, and in particular for the
complete de-vegetation of the bamboo and thickets. Home gardening, trees on farmlands (parkland agroforestry), woodlots, live fences, and road side tree plantings were the major agroforestry practices evolved in the resettlement district of Pawe, despite some
setbacks to their development and expansion.
The present study shows the tremendous damage caused to the environment, particularly to the vegetation cover, by unplanned,
large-scale resettlement. Thus, resettlement programme planners need to balance the solving of livelihood crises against the
environmental costs of undertaking such practices, and should consider synergies between conserving resources and averting livelihood crises.
Key words: Agroforestry, GIS, LCLU, Pawe, Remote sensing, Resettlement
1. INTRODUCTION
Human activities and natural ecological processes are responsible for the unabated global land cover /land use (LCLU) changes.
Particularly, human-induced LCLU changes, through such activities as an expansion of agricultural lands into natural ecosystems, are
http://dx.doi.org/10.29322/IJSRP.9.02.2019.p8649 www.ijsrp.org way in which land has been used by humans and their habitat, usually with an accent on the functional role of land for economic
activities whereas land cover is the physical characteristics of the earth’s surface (Rawat and Kumar 2015).
According to (Lambin et al. 2003), land use refers to the purpose for which humans manipulate the land cover whereas land
use change is defined as any physical, biological or chemical change attributable to its management. At present, the Earth’s land
surface degradation through human activities is forcing the planet towards a sixth mass species extinction, and costing more than 10%
of the annual global gross product in loss of biodiversity and ecosystem services (Scholes et al. 2018) . The dynamics of land use
change in Ethiopia over the last four decades showed that agricultural lands augmented largely at the expense of natural vegetation
(Kiros 2008) . Land degradation, common in densely populated highland and mountainous areas of Ethiopia (Aklilu et al. 2007), is
the negative consequence of continued deforestation, overgrazing of agricultural land-use types and biological soil deterioration
(Hurni 1993), which in turn triggered low agricultural productivity and poverty (Pender and gebremedhin 2007).
The increasing dynamics of LULC takes to an different forms of enhanced vulnerability, mainly reduction in vegetation
cover and the exhaustion of biodiversity (Barana et al. 2016), rangeland degradation and poverty (Mohammed et al. 2017) , and
adverse impacts on the livelihood (Gebreslassie 2014).
One of the policy options practiced by Ethiopian governments, previous and current, to tackle the problem of land degradation and
food insecurity, is the resettlement programme, which is considered as one alternative for combatting the chronic and transitory
food-insecurity problems in the country. The resettlement programme in Ethiopia is believed to contribute to increased national food
production and improved food security of households while it also is assumed to help to ease environmental pressures on affected
areas(EPA 1998).
Although resettlement has a long history in Ethiopia, planned (government-sponsored) resettlement was centrally
coordinated and executed during the DERG regime in the late 1970s, and became a major undertaking in the 1980s, following the
disastrous famine that occurred in the decade's middle (Dessalegn 2003a). The term ‘resettlement’ seems to be appropriate in the
Ethiopian context, as it suggest moving people to areas other than their own, people moving to new locations, or both (Dessalegn
2003a) Geographic information systems (GIS) and remote sensing technologies, are among the versatile tools available to enable the
quantification and understanding of spatial and temporal processes that accompany spatial dynamics and changes, and for presenting
the extent and rate of LCLU changes (Brandt et al. 2002; Kutiel et al. 2004). Around the world, resettlement (voluntary or
involuntary) is only a subset of a much broader population movement which emanates from causes such as population pressure,
natural catastrophes (famine and drought), manmade adversities (war, ethnic strife, human rights violations), unemployment,
promotion of regional development, industrialization, urbanization, and various other reasons ((Wolde-Selassie 1998). The term
‘resettlement’ seems to be appropriate in the Ethiopian context, as it suggest relocating people to areas other than their own, people
moving to new locations, or both (Dessalegn, 2003a)
Therefore, the main aim of the study was to investigate and understand LCLU changes and the evolution of agroforestry
practices in the resettlement district of Pawe using of GIS and remote sensing techniques, coupled with PRA tools. The specific
objectives were a) investigate the status of natural vegetation cover change and the rate of change in association with resettlement
programme, through GIS and remote sensing techniques b) To assess the evolution of agroforestry practices in the resettlement
http://dx.doi.org/10.29322/IJSRP.9.02.2019.p8649 www.ijsrp.org
2. MATERIALS AND METHODS
2.1 Description of the study area
Pawe special Woreda is located in the Metekel zone of the Benishangul Gumuz National Regional State, in the lowlands of the
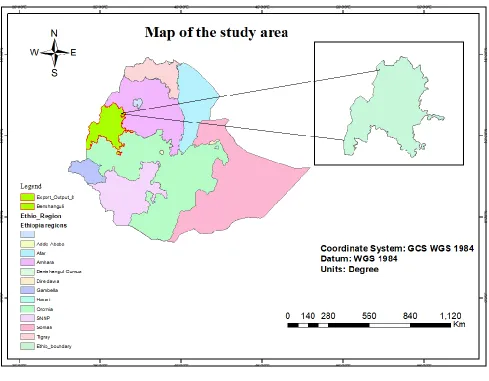
northwestern part of the country, 570 km from Addis Ababa (Fig. 1). The Addis Ababa-Guba all-weather road provides the primary
access to the area. The study area covers about 380 km2 in Pawe especial Woreda, and is geographically located between 11º15′–
[image:3.612.66.555.170.551.2]11º23′ North latitude and 36º15′–36º30′ East longitude.
Figure 3 Location map of the study area
2.2. Topography
The topography of Pawe is not too rugged and is characterized as a slightly undulating from hill-tops towards rivers. The altitude of
the Pawe ranges between 100 and 200 meter above sea level (m a.s. l)
(Dieci and Viezzoli 1992 ), thus belonging to the general classification of lowlands, i.e. land less than 1500 m a.s.l. Most of the
farmlands are relatively gentle and flat, with an average slope of 5% (Wolde-Selassie 1998).
http://dx.doi.org/10.29322/IJSRP.9.02.2019.p8649 www.ijsrp.org Different woodland predominant in the vegetation covers of Benshangule Gumuz region. Broad-leaved deciduous woodlands
predominate at altitudes between 60 and 730 meter above sea level, while Acacia woodland, riparian woodland along the major
rivers, Boswellia woodland and bamboo thickets are also among the major vegetation types of the region (UNDP/ECA 1998).
2.4.Geology and Soils
The geology of the study area consists of Meta conglomerate and quartzite of the Precambrian basement complex (Tefera et.al., 1996,
as cited in Abayneh (2003.) Soils are broadly categorized as vertisols (black clay soils), and account for 40–45% of the area; Nitisols (red or reddish-brown laterite soils) which account for 25–30%; and intermediate soils of a blackish-brown color, which account for 25–30% (Dieci and Viezzoli 1992 ).
2.5. Climate
A study area has a unimodal rainfall pattern, with an extended rainy season, from March to September. However, the peak rainy season is from July to August. According to records from 1987 to 2001, the mean annual rainfall is 1659 mm. The mean annual
maximum temperature is 32 ºC, and monthly values range between 27–37ºC. The mean annual minimum temperature is 16ºC, and
monthly values range between 12 and 9 ºC. The coldest months are December and January whereas March and April are the hottest months (Abayneh 2003.).
2.6. Methods of Data Collection and Analysis
Two types of method were used in this study: satellite-image analyses and PRA, based on a semi-structured questionnaire
and interviews with village elders. To improve the accuracy gaps in information got from remotely-sensed images, local people are
often used as valuable complements (Mulugeta 2004). Besides filling the gap in information, interviews with local people could also
clarify ambiguities in interpreting remotely sensed images; justify the data collected and explain the underlying causes of the
phenomena observed.
Two Landsat Thematic Mapper (TM) images, centered on the resettlement area in the Beles valley, Pawe district and taken
on two different occasions, 1986 (Fig. 2) and 2001 (Fig. 3), were acquired for the analysis of LCLU change following resettlement. In
addition, aerial photographs flown in January 1982, and 1:50,000 topographic maps first edited in 1986, were used as supporting
spatial data for proper analysis of the images. Owing to the large area of the entire Landsat satellite scenes gained for both years, it
was necessary to clip out only the study area of interest, which covered 380 km2, before any analysis was conducted. The images were
processed using ERDAS Imagine 9.2, ENVI 4.7 and ArcGIS 10. 2 software. Image enhancements used on both images were
histogram equalization for stretching, and false color composite for display. Supervised classification, using the maximum likelihood
algorithm, was adopted. Training data for the supervised classification were established from the author’s knowledge of the area, and
with the help of other supporting data sources, such as aerial photographs, topographic maps and interviews with elderly people of the
area. The field survey, conducted in January 2006 at a season n comparable with that when the satellite images were acquired, also
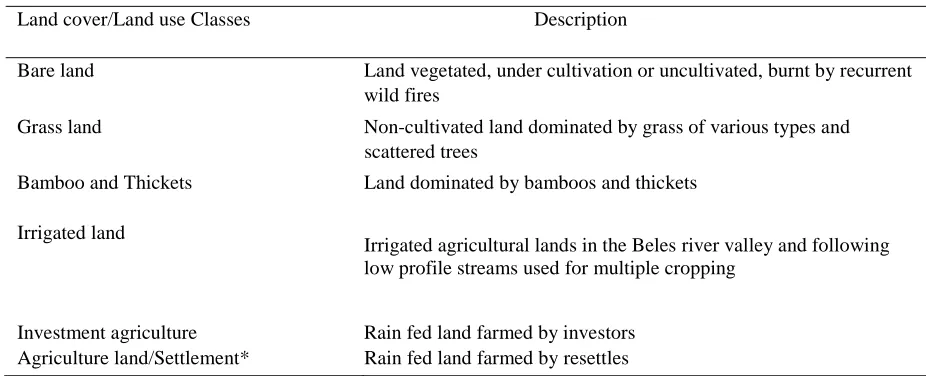
http://dx.doi.org/10.29322/IJSRP.9.02.2019.p8649 www.ijsrp.org Table 1. Land use classes considered in image classification and change detection
Land cover/Land use Classes Description
Bare land Land vegetated, under cultivation or uncultivated, burnt by recurrent
wild fires
Grass land Non-cultivated land dominated by grass of various types and
scattered trees
Bamboo and Thickets Land dominated by bamboos and thickets
Irrigated land
Irrigated agricultural lands in the Beles river valley and following low profile streams used for multiple cropping
Investment agriculture Rain fed land farmed by investors
Agriculture land/Settlement* Rain fed land farmed by resettles
* The class is found to be somewhat complex. The image acquisition season drier and the settlement households, almost all grass
roofed, produced similar spectral signatures, making the two LCLU classes indistinguishable.
2.6.1. Post classification Processing
After the classification process, it was found necessary to apply post-classification procedures to enhance the images, by
applying a smoothing filter. Post-classification filtering was conducted to reduce the noise observed on the classified images. A
majority filter with 3×3 was applied, to produce the final classified image. The classified images of both years were imported into
http://dx.doi.org/10.29322/IJSRP.9.02.2019.p8649 www.ijsrp.org
2.6.2. Detection of Land cover/Land use Change
To quantify change, the classified images were first vectorized and exported into ArcGIS, and saved as shape files. The area
of each LCLU class was computed by means of the automated area-computation function of ArcGIS for the two images. Then, on the
basis of the area computed from both years, the changes in area of each land use were computed as positive and negative, to show the
decline in cover or use, or the increase in cover or use.
2.6.3. Field Verification and Computation of Classification Accuracy
The features determined after a repeated classification process should be checked in the field. Field GPS records were
compared against the spectral classification of the satellite imagery, to determine the overall classification accuracy. A percentage
value is then calculated, based on whether each comparison was right or wrong. Aerial photographs and topographic maps were also
used to aid in testing the accuracy of classification. Field verification of areas found to be unclear during the process of visual and
computer-aided classification of the images, was carried out after their identification in the field, aided by a GPS. The aerial
photographs of the study area and topographic maps were also used to assist in the detection of change and to identify training areas
to be used for further analysis and accuracy assessment.
2.6.4. Data Analysis and Software Used
The data collected through the semi-structured interview with elderly residents were summarized independently to make
comparison possible between categories of re-settlers. The data collected through a household survey, by administering a
semi-structured questionnaire, were crosschecked to correct errors, summarized and coded for analysis. To analyze the coded data from the
semi-structured questionnaire, the Statistical Package for Social Sciences (SPSS) version 11 was used. The open-ended questions in
the semi-structured questionnaire were also summarized.
2.6.5. Socio-economic Survey
A semi-structured questionnaire and interviewing procedure was conducted, to establish the changes brought about by resettlement on
the LCLU of the study area, and the interaction of settlers with the surrounding natural vegetation, and to learn about the evolution of
agroforestry practices. This involved different groups: an interview with elderly people and a survey of individual households. To
conduct the semi-structured interview with elderly residents and to administer the household survey, the resettlement district was
http://dx.doi.org/10.29322/IJSRP.9.02.2019.p8649 www.ijsrp.org This was necessary because observation showed that background (origin) of the re-settlers distinctly influences their way of
managing and using a natural vegetation. In a group interview, elderly people ranging in number from 10 to 12 took part in ea ch
independent semi structured interview; two interviews per stratum, and a total of four group interviews were conducted.
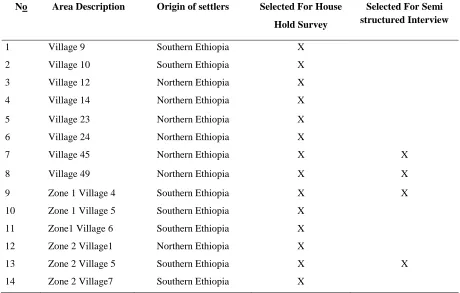
To administer the semi-structured questionnaire survey to individual households, seven villages from each stratum were
randomly selected, and fourteen randomly selected villages (31.1% of the total villages in the district) was considered (Table 2). In
each selected village, eight respondents were randomly selected, which gave a total of 112 households for the entire survey. The
strategy for fixing the sampling framework of the semi-structured questionnaire was to procure a list from the village administration
[image:7.612.76.536.240.533.2]of those (who paid land rent), thereby selecting respondents randomly.
Table 2.Villages selected for administering the semi-structured household survey and interview.
No Area Description Origin of settlers Selected For House
Hold Survey
Selected For Semi structured Interview
1 Village 9 Southern Ethiopia X
2 Village 10 Southern Ethiopia X
3 Village 12 Northern Ethiopia X
4 Village 14 Northern Ethiopia X
5 Village 23 Northern Ethiopia X
6 Village 24 Northern Ethiopia X
7 Village 45 Northern Ethiopia X X
8 Village 49 Northern Ethiopia X X
9 Zone 1 Village 4 Southern Ethiopia X X
10 Zone 1 Village 5 Southern Ethiopia X
11 Zone1 Village 6 Southern Ethiopia X
12 Zone 2 Village1 Northern Ethiopia X
13 Zone 2 Village 5 Southern Ethiopia X X
14 Zone 2 Village7 Southern Ethiopia X
3. RESULT AND DISCUSSION
3.1. Land cover /Land use Status in 1986 and 2001
Image classification for the year 1986 of the 380 km2 (38,000 ha) area yielded four distinct LCLU types, excluding the
unclassified pixels. The LCLU types identified were bare land, Grassland, Bamboo and Thickets, Agriculture land/Settlement (Fig. 4).
The same work for the image of 2001 yielded five distinct LCLU types, excluding the unclassified, namely: Bare land, Grassland,
Irrigated Land, Investment Agriculture and Agriculture land/Settlement (Fig. 5). The areas occupied by each of the LCLU type on the
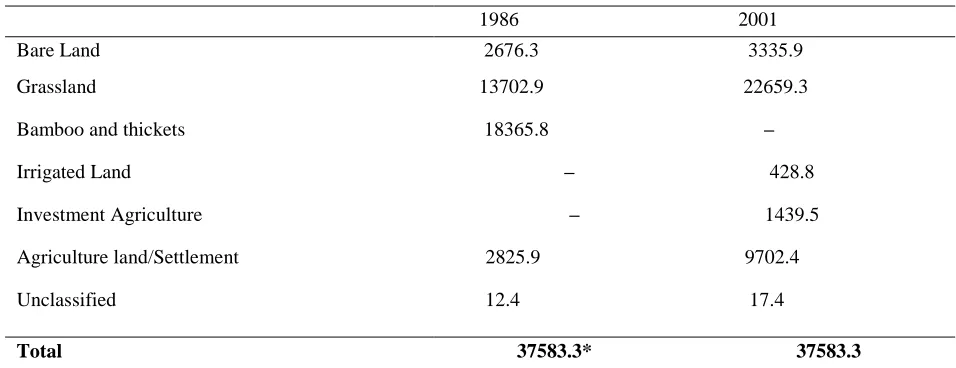
images of both years are summarized in Table 3. On the images from 1986, bamboo and thickets was the dominant LCLU, with 49%
of the land cover, followed by grassland, which represented 36% of the LCLU of the area. Irrigated land and investment agriculture
http://dx.doi.org/10.29322/IJSRP.9.02.2019.p8649 www.ijsrp.org Table 3. Land cover/Land use classes and their respective are covered (ha) for the years 1986 and 2001
1986 2001
Bare Land 2676.3 3335.9
Grassland 13702.9 22659.3
Bamboo and thickets 18365.8 –
Irrigated Land – 428.8
Investment Agriculture – 1439.5
Agriculture land/Settlement 2825.9 9702.4
Unclassified 12.4 17.4
Total 37583.3* 37583.3
* The study area showed a common reduction by 2416.7 ha for both years, which is attributed to conversion from raster to vector form for area calculations.
On the 2001 image, not only had new land uses (irrigated land and mechanized agriculture) been introduced, which were absent in
1986, but also the bamboo and thickets land cover had completely disappeared. Grassland, which represented 60% of the land cover,
dominated in 2001. There was also a large expansion in settlements and small-scale agricultural land, which represented 26% of the
LCLU in 2001, as compared to only 7.5% in 1986.
Figure 4. Land cover/ Land use map of 1986 Figure 5. Land cover/ Land use map of 2001
http://dx.doi.org/10.29322/IJSRP.9.02.2019.p8649 www.ijsrp.org
3.2. Land cover/ Use Change between 1986 and 2001
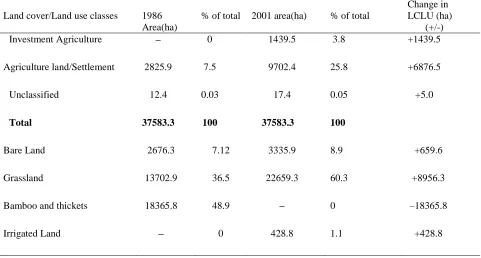
Several trends in LCLU change were evident between the two dates of comparison, 15 years apart (Table 4). Bare land and grassland
increased their cover by 659.6 ha (1.78%) and 8956.3 ha (23.8%), respectively, over the period. The bamboo and thickets cover age of
18,365.8 ha for 1986 had been completely converted to other LCLU types, mainly small-scale Agriculture/settlement, by 2001 (Fig.
5). The agricultural land/settlement class had increased by 6876.5 ha (18.3%) over fifteen years. Other additions of LCLU observed in
[image:9.612.67.548.202.460.2]2001 were irrigated land and investment agriculture, which covered an area of 428.8 and 1439.5 ha, respectively.
Table 4. Summary of land cover/ land use changes between 1986 and 2001 at Pawe resettlement area
The highest reduction in area between 1986 and 2001 was observed for the bamboo and thickets LCLU class, with an annual
rate of reduction of 1224.4 ha (3.26%). A considerable increase in area was observed for the grassland LCLU class, with an annual
increment of 1.59%. The agriculture land/settlement LCLU class also increased annually by 1.22%. Bare land showed an increase of
660 hectares over the 15-year period. The percentage change in the LCLU of the area over the period is shown in Figure 6.
Land cover/Land use classes 1986
Area(ha)
% of total 2001 area(ha) % of total
Change in LCLU (ha) (+/-)
Investment Agriculture – 0 1439.5 3.8 +1439.5
Agriculture land/Settlement 2825.9 7.5 9702.4 25.8 +6876.5
Unclassified 12.4 0.03 17.4 0.05 +5.0
Total 37583.3 100 37583.3 100
Bare Land 2676.3 7.12 3335.9 8.9 +659.6
Grassland 13702.9 36.5 22659.3 60.3 +8956.3
Bamboo and thickets 18365.8 48.9 – 0 –18365.8
http://dx.doi.org/10.29322/IJSRP.9.02.2019.p8649 www.ijsrp.org
Bare la nd
Grass la nd
Bamboo
and thick ets
Irregated la nd
Ivestment ag riculture
Agriculture la nd
Unclassi fied
0
5000
10000
15000
20000
25000
1986
2001
LCL
U C
hange ha/
yr
[image:10.612.114.503.134.489.2]LCLU Classes
Figure 6. Change in Land cover/Land Use over the Period of 15 Year
3.3. Normalized Difference Vegetation Indices (NDVI) For the Years 1986 and 2001
The calculated NDVI for 1986 showed values between –0.5 and 0.6, while the image for 2001 showed values ranging
between –0.7 and 0.4. The maximum NDVI value on the1986 image (Fig. 7) overlapped with the site classified as bamboo and
thickets on the classified image of that year (Fig. 4), which it is logical to expect. However, the same site on the 2001 image showed
the lowest NDVI value (Fig. 8), confirming the conversion of the bamboo and thickets into other LCLU with a lower biomass. The
sums and differences of bands are used in NDVI rather than absolute values, which make NDVI appropriate for use in studies where
comparison for a single area over time is involved. NDVI values for vegetated land are generally greater than 0.1, with values
http://dx.doi.org/10.29322/IJSRP.9.02.2019.p8649 www.ijsrp.org
3.4. Change in Land cover/Land Use and Evolution of Agroforestry Practices as Perceived by the Re-settlers
3.4.1. Livelihood Occupations and Agricultural Land Expansion
Agriculture (both crop production and livestock rearing) is identified as the mainstay of the livelihood of the people in the
survey area. All the respondent households (100%) depend on agriculture, either as a sole occupation or as a major part of their
livelihood occupations. Of the 112 households interviewed, 101 (90.2%) depended on agriculture (mixed crop and animal) as their
sole livelihood occupation, 6 (5.4%) of the households combined agriculture and small-scale trading, and the remaining 5 (4.6%)
depended on combinations of agriculture, trade and other livelihood occupations.
At the beginning of the resettlement, there was no land to farm at the level of the individual household, except 1000 m2 of
land allotted for construction of a house and backyard. Resettles were organized and worked collectively, and their working hours
were strictly controlled; the harvest was allocated as monthly rations to households.
However, after the fall of the DERG in 1991, each household was allotted 0.75 ha of land to farm individually. From the origi nal
landholding of 0.75 ha, 31 of the respondents (27.7%) had increased the area of their farmland by as much as 10 ha, both by clearing
new land from the forest and by renting from others. Agriculture being the major livelihood strategy, crop production specifically
does not pay to the satisfaction of the substantial households. When asked about recent crop production, 46 respondents (41.1%)
reported that the produce from crop-farming no longer sufficed even for household consumption.
Figure 7. NDVI map for 1986 Figure 8. NDVI map for 2001
http://dx.doi.org/10.29322/IJSRP.9.02.2019.p8649 www.ijsrp.org
Off-farm job opportunities, such as daily wages and small-scale trading, were showed to fill gaps in household income and
livelihood shortfalls.
3.5.Perceptions on Natural Vegetation Cover Changes
The majority of the respondents had witnessed considerable changes in the natural vegetation cover of the resettled area of Pawe.
Ninety-eight of the respondents (87.5%) showed that a decrease in the cover had taken, while the rest of the respondents reported
either no change or an increase (Fig. 9).
[image:12.612.158.404.220.383.2]
Figure 9. Natural vegetation cover status as viewed by respondents
However, as regards the specific time at which major changes in the vegetation cover of the area took place, 80 respondents (77.7%)
reported the reduction to have been in the recent past (i.e. ten years back or later), 11 respondents (10.7%) ascribed the reduction to
the institutional vacuum during the fall of the DERG, some 13–14 years ago, while 12 respondents (11.6%) attributed the change to a
combination of factors since the establishment of the resettlement. The multiple factors showed as drivers of vegetation-cover
changes in the area include: expansion of agricultural land, harvesting of construction wood and fuelwood collection. Numerous
respondents, 48 (43%), attributed the causes of the reduction in vegetation cover to the expansion of agricultural land, to
wood-harvesting for construction and fuelwood, while 23 (21%) respondents showed that the expansion of agricultural land alone had
reduced natural vegetation cover.
3.6. Land cover/Land use Change between 1986–2001
The change in LCLU, especially the disappearance of the bamboo and thickets, is a striking phenomenon that took place between
1986 and 2001. The annual reduction of the bamboo and thickets amounted to 3.26% or 1224.4 ha; this interpretation was confirmed
by field observations and further supported by interviews with villagers. The villagers explained the changes by the statement they
travel 2–3 hours one-way, 4–6 hours round trip, to collect bamboos in a few places, often around river banks, or even intrude into
neighboring districts in search of the multi-purpose bamboo.
Indiscriminate clearing of forests during the establishment of emergency settlement areas by bulldozers and other heavy
equipment, and the increased frequency of forest fires following the re-settlers, resulted in a sharp decline of the forest/bamboo and
thicket resources of the area.
As it is
Decreasing Increasing
120
100
80
60
40
20
0
http://dx.doi.org/10.29322/IJSRP.9.02.2019.p8649 www.ijsrp.org Alemneh (1990), also noted the same phenomenon, when he reported that re-settlers, who were overwhelmed by the dense forests
and by the wildlife harbored there, which destroyed their crops, felled trees without giving much thought to the effects. All cultivated
land, land abandoned as fallow, and land under homesteads in the Pawe resettlement district, were also established by clearing the
original vegetation, described as mainly bamboo and thickets. In fact, almost all houses in the district are constructed from, and
maintained with, bamboo. This means that, from the inception of the resettlement district, bamboo and associated woodland species
have been under immense pressure, which has led to their ultimate degradation at such a high rate.
The increase in agricultural and settlement land use, estimated in the present study at 1.2% or 458.4 ha annually, is mainly at
the expense of bamboo and thickets land cover. From the onset of resettlement, land for a homestead of 0.1 ha, allocated to each
resettling family, and was mainly cleared of bamboo and thickets. By the year 1987/88, the Pawe resettlement district was estimated
to have received 82,106 people, or 21,994 households (Ammassari 1995; Dessalegn 2003b. ; Wolde-Selassie 1998) For these first
arrivals alone, the land required for shelter construction plus backyards amounts to 2199.4 ha, at 0.1 ha/household.
Following the fall of the DERG regime, and in consequence of instability during the transitional period, as stated by the
villagers, the expansion of agricultural land through forest clearance has accelerated, causing greater de-vegetation. The introduction
of the Tana-Beles Project in March 1986, alone involved an agricultural area of approximately 20,000 ha, to be farmed by a
mechanized, capital-intensive approach. The project was financed by the Directorate General for Development Co-operation of the
Italian Ministry of Foreign Affairs (Wolde-Selassie 1998). The arrival of re-settlers in a new area, coupled with the introduction of
this huge project, which carried out mechanized tillage, resulted in the complete conversion of the bamboo and thickets LCLU, to
mainly agricultural and settlement LCLU types.
The other notable increase in area coverage is that of grassland LCLU, which increased by 1.59% or 627.7 ha annually. The likely
reasons for this are as follows. The soil of Pawe, covering 40–45% of the area, is described as a vertisol (black clay soil).(Dieci and
Viezzoli 1992 ).
This type of soil is difficult to work, and has a drainage problem, but is well suited for rice production. The Tana-Beles
project, which was equipped with modern machinery, farmed these areas, and after the suspension of the project in 1991, the land
remained untouched. The vertisol, found difficult to farm by animal traction, was abandoned by villagers even after the introduction
of ‘land privatization’ and smallholder agriculture after the fall of the DERG. This land is currently observed to be completely
covered by grass.
It is scarcely possible to find bare land (i.e. land devoid of vegetation) at Pawe. But satellite images of both years (1986 &
2001) showed areas with no vegetation. The bare land has also shown an increase of 659.63 ha over the period of comparison. A
closer look at the classified images shows that all of the Beles river bed is classified as bare land, thereby contributing to the area
coverage in the bare land LULC class.
The present-day Beles valley was, as a whole, inhabited by the Gumuz, who practiced shifting cultivation supported by
gathering and collection of fruits, leaves, bark and roots of edible plants, hunting and fishing as the base of their livelihood (Agneta
and Tommasoli 1992; Wolde-Selassie 1998). The Gumuz practice customary land tenure, and clearing to acquire land for farming is
most often done using fire, which at times burns out of control, causing the destruction of vegetation cover over large areas. Fire is
also used by the Gumuz to chase and hunt wild animals. The resettlers also use fire to clear vegetation in the pursuit of more farmland
http://dx.doi.org/10.29322/IJSRP.9.02.2019.p8649 www.ijsrp.org
According to the present author’s own observations, this kind of wildfire is often observed in the dry season (especially
wildfires noted as fierce between January–March), fitting exactly with the months of satellite-image acquisition. During fieldwork for
this study in January 2006, the present author also observed wildfires of immense size. Thus the wildfires which most often burn out
of control result in bare land, which was captured on both satellite images; this situation lasts only a few months, to be replaced by
vigorously growing grass and vegetation of various kinds.
One goal of the resettlement policy was to use land and water resources were as yet unexploited, thereby providing the
drought-stricken population with new agricultural land, and, promoting income-generating activities (Eshetu and Teshome 1988). The
Beles valley, situated in the basin of the Beles river, a tributary of the Blue Nile, is well suited for small-scale and irrigation
agriculture. The development of the LCLU class over the years, which probably took place because of introducing the Tana-Beles
project, is that of irrigated land, which covers an area of 428.8 ha on the recent image. Investment in agriculture, which covers an area
of 1439.5 ha, and which was established by private investment incentives under the current government’s policy, is the other
recognized LCLU class; the private firm is still functioning to date.
3.7. Land cover/Land use Change and Agroforestry Practices
Various causes are reported as reasons for LCLU change, and specifically, the change in the natural vegetation land cover is mainly
ascribed in the study area—among other reasons—to agricultural land expansion, to the harvesting of construction wood and to the
collection of fuelwood, which are consistently mentioned both in the household survey and by village elders who participated in the
semi-structured interview.
Agroforestry practices make it possible to achieve multiple objectives, social, economic and environmental, by providing the
opportunity to use land by integrating an array of components, such as agricultural crops, trees/shrubs and animals/pasture. It should
be borne in mind that the practices are only one of several approaches to improving land use in a given situation, yet the breadth and
variety of agroforestry systems and practices imply that the undertakings offer at least a partial solution to many problems of rural
land use and production (Rocheleau et al. 1988).Agroforestry practices presented an opportunity for resettles to use family labor and
less initial investment, thereby easing the requirements on a household to become involved in and to benefit from the practices. The
agroforestry practices observed in the study area provided resettles with items for household consumption and extra produce for the
market.
For instance, according to a study made by Capirici and Taurelli (1992), on 250 households of the resettlement at Pawe,
home gardens were reported to contain: cereal crops, root tubers, legumes, vegetables, oilseeds, cash crops such as tobacco and
cotton, fruit trees and herbal plants. Feedstuffs, and the much-needed shade for domestic animals are derived from the agroforestry
practices in the area. Agroforestry practices also provide an improved yield of crops. The improvement of crop yield can also reduce
the pressure on natural vegetation as represented in the form of more land to be farmed.
Agroforestry practices can also serve the purpose of environmental protection. According to Young (1989), environmental
problems that can be mitigated by agroforestry practices include soil erosion, soil fertility decline, loss of forest resources, pasture
degradation and river degradation because of an imbalance in the flow regime and sedimentation. Despite the all-round benefit
derived from the agroforestry practices noted in the study area, their development and expansion are constrained by various factors.
Crop production per unit area is reported by almost all the household survey questioned respondents, and confirmed by interviews
with elderly persons, to be decreasing over time, and it is expected that land under production needs to increase, solely by the clearing
http://dx.doi.org/10.29322/IJSRP.9.02.2019.p8649 www.ijsrp.org
Tree-planting practice in the study district is also noted to be encouraging faced with varied obstacles. The state of livestock
production is not encouraging, and the study district harbors some of the deadliest livestock diseases. The Pawe resettlement area is
one of the large-scale schemes supported strongly by a huge project, the project providing technical and material support required by
re-settlers.
The excessive handouts and subsequent dependency developed in the big Italian project, have resulted in a reduced effort
among resettles to work, and thus to reap the multiple benefits from agroforestry practices. In 1986, a huge project was started in the
area by the Italian government, to provide a physical and social infrastructure. This was capital-intensive and top-down in its
approach. When, in 1991, all foreign projects in the Beles Valley were suspended, they left behind a strong material and psychological
dependency of settlers on external aid and help.
The absence of a gradual and balanced development process has brought about severe problems of adaptation, integration
and effective assimilation into the local ecological conditions, the fluid socio-economic situation and the new cultural reality
(Ammassari 1995; Wolde-Selassie 1998).In conclusion, all the reasons mentioned as causes of the decline in the natural vegetation
cover and its subsequent serious repercussions could have been mitigated by the use of agroforestry practices from the outset of the
resettlement programme, had that programme been properly thought through. This same practice can also be justified on social and
economic terms as discussed above.
4. Conclusions
Human-induced changes in LCLU are very great; one of which is the resettlement of people into new and virgin areas. Resettlement,
and especially large-scale resettlement programme, need to be justified sufficiently, and if possible, should be treated as a last resort,
because of their inherent complexities and the unsatisfactory results so far recorded world-wide.
The results of this study showed that resettlement in Ethiopia, apart from adversely affecting the resettles and host
population, has caused tremendous damage to the environment. Given the circumstances, there is a serious need to look holistically
into the merits and demerits of the resettlement programme in the country, and to adjust the development orientation accordingly. The
study has shown the environmental consequences of resettlement, with especial emphasis on the rate and trend of conversion of
natural vegetation cover to other LCLU types.
The evolution and performance of agroforestry practices, which are considered to improve the household economy and to
ease the pressure on natural vegetation cover, were assessed; they are observed to have been practiced from the start of the relocation
of people to the area. The investigation into LCLU change, as caused by resettlement, has shown that the area has suffered a heavy
loss in natural vegetation cover, and specifically in the category bamboo and thickets. Conversion to agricultural land, harvesting of
construction wood and collection of fuelwood were the most important underlying causes of the loss of natural vegetation cover.
This study has also revealed dissatisfaction on the part of the resettles with current management arrangements, as far as the
natural vegetation cover is concerned. A closer examination of the matter suggests that there are weaknesses in the checks and
balances (institutions) responsible for managing the resources. In addition, continuous institutional support for the promotion of
practices such as agroforestry—by providing the required inputs to ease the pressure on the natural vegetation of the area—was
lacking. Resettlement induces inevitable changes in the environment and on LCLU.
The adverse changes recognized can be ascribed to the failure of the resettlement plan to consider the environmental
http://dx.doi.org/10.29322/IJSRP.9.02.2019.p8649 www.ijsrp.org the natural vegetation. On the part of the agencies responsible for implementing the resettlement programme, there were failures to
recognize the environmental consequences of the undertaking and to adopt appropriate measures. If the existing agroforestry practices
are reinforced, and new practices introduced which fit into the social, economic and ecological settings of the area, they may redeem
the vanishing vegetation cover of the resettlement at Pawe.
In general, any future resettlement programs should pay due attention to the environmental consequences of the undertaking, and
resettlement practitioners should put forward serious measures for dealing with such consequences: Without such measures, further
impoverishment, resulting from damage to the life-support systems, and to the natural vegetation cover in Particular, is inevitable.
Acknowledgments
We extend our gratitude to the local administration and farmers who provided us relevant information on Land cover, land use
Changes and Agroforestry Practices at Pawe Resettlement District. Our acknowledgement will not be complete without mentioning
the comfort and care we received from Pawe agricultural research center and Debub University, Wondo Genet College of Forestry.
We would like to acknowledge Ethiopian Meteorological Services and Mapping Agency for providing rainfall and satellite data,
respectively.
References
Abayneh E (2003.) Soils of Pawe Agricultural Research Center. National Soil Research Center Ethiopian Agricultural Research
Organization Technical paper:23
Agneta F, Tommasoli M (1992) Pre-School Education and Preiests’ Schools in Pawe Resettlement Area. Resettlement and Rural
Development in Ethiopia: Social and Economic Research, Training and Technical Assistance in the Beles Valley,
Aklilu A, Stroosnijder L, Graaff Jd (2007) Long-term dynamics in land resource use and the driving forces in the Beressa watershed,
highlands of Ethiopia Journal of environmental management 83 448–459
Alemneh D (1990) Environment, Famine and Politics in Ethiopia: A View from the Village. Boulder: Lynne Rienner.
Ammassari S (1995) PRA for Self-Reliant Rural Development: The Case of a Resettlement Area in Ethiopia .PLA Notes IIED
London. :62-68
Barana B, Senbetie T, Aklilu B (2016) Land use/Land Cover Dynamics and its Implication on Sustainable Land Management in
Wallecha Watershed, Southern Ethiopia Land use/Land Cover Dynamics and its Implication on Sustain. Global Journal of
Science Frontier Research: H Environment & Earth Science 16:49-63
Brandt JJE, Bunce RGH, Howard DC, Petit S (2002) General Principles of Monitoring Land Cover Change Based on Two Case
Studies in Britain and Denmark Landscape and Urban Planning 62 37-51
Budde ME, Tappan G, Rowland J, Lewis J, Tieszen LL (2004) Assessing Land Cover Performance in Senegal, West Africa Using
1-Km Integrated NDVI and Local Variance Analysis. Journal of Arid Environment 59 481-498.
Capirici M, Taurelli S (1992) Homegardening in the Beles Ressetlement Area, Gojjam Region. In P. Dieci and C. Viezzoli.
Resettlement and Rural Development in Ethiopia: Social and Economic Research, Training and Technical Assistance in the
Beles Valley.
Dessalegn R (2003a) Access to Resources and Livelihood Insecurity. Forum for Social Studies Addis Ababa:26
Dessalegn R (2003b. ) Resettlement in Ethiopia. The Tragedy of Population Relocation In The 1980’s. FSS Discussion Paper Addis
http://dx.doi.org/10.29322/IJSRP.9.02.2019.p8649 www.ijsrp.org Dieci P, Viezzoli C (1992 ) Resettlement and Rural Development in Ethiopia: Social and Economic Research, Training and Technical
Assistance in the Beles Valley.
EPA (1998) National Action Program to Combat Desertification. Addis Ababa:158
Eshetu C, Teshome M (1988) Land Settlement In Ethiopia: A review of Development. In A.S. Oberai (Ed) Land settlement Policies
and population Redistribution in Developing Countries. Achievements Problems and Prospects. Praeger, New York.
Gebreslassie H (2014) Land Use-Land Cover dynamics of Huluka watershed, Central Rift Valley, Ethiopia International Soil and
Water Conservation Research 2:25-33
Hurni (1993) Land degradation, famine, and land resource scenarios in Ethiopia World Soil Erosion and Conservation CambridgeI n:
Pimentel D:27-61
Kiros M (2008) Temporal and Spatial Changes in Land Use Patterns and Biodiversity in Relation to Farm Productivity at Multiple
Scales in Tigray, Ethiopia. PhD Thesis Wageningen University, Wageningen.
Kutiel P, Cohen O, Shoshany M, Shub M (2004) Vegetation Establishment on the Southern Israeli Coastal Sand Dunes between the
Years 1965 and 1999. Landscape and Urban Planning 67 141-156.
Lambin EF, Geist HJ, Lepers E (2003) Dynamics of Land-use and land-cover change in tropical regions Annu Rev Environ Resour
28:205–241
Mohammed M, Habtamu T, Yared M (2017) Lad Use/ Land Cover Change Analysis and Local Community Perception towards Land
Cover Change in the Lowland of Bale Range Lands, SE Ethiopia International Journal of Biodiversity and Conservation
9:363-372.
Mulugeta L (2004) Effects of Land Use Change on Soil Quality, and Native Flora Degradation and Restoration in the High Lands of
Ethiopia. Implications for Food Security. Doctoral Thesis. Swedish University of Agricultural Sciences.
Nagendra H, Munroe DK, Southworth J (2003) From Pattern to Process: Landscape Fragmentation and the Analysis of Land
Use/Land Cover Change Agriculture, Ecosystems and Environment 101:111-115
Pender J, gebremedhin B (2007) Determinants of Agricultural and Land Management Practices and Impacts on Crop Production and
Household Income in the Highlands of Tigray, Ethiopia Journal of African Economics 17:395–450
Rawat JS, Kumar M (2015) Monitoring land use/cover change using remote sensing and GIS techniques: A case study of Hawalbagh
block, district Almora, Uttarakhand,India The Egyptian Journal of Remote Sensing and Space Sciences 18:77–84
Rocheleau D, Weber F, Field-Juma A (1988) Agroforestry in Dry Land Africa. Sciences and Practices of Agroforestry . ICRAF,
Nairobi:310
Scholes R et al. (2018) Summary for Policymakers of the IPBES Assessment Report on Land Degradation and Restoration
IPBES:3-41
UNDP/ECA (1998) Agriculture and Rural Development Integrated Services (WADIS) UNECA. Forestry Program Proposal in the
Benshangule Gumze Regional State. 4
Wolde-Selassie A (1998) The Dynamics of Socio-Economic Differentiation and Livelihood Strategies, The case of relocated peasants
in the Beles Valley, North-Western Ethiopia. Discussion Paper . Institute of Rural Development University of
Gottingen.:139