IJPSR (2012), Vol. 3, Issue 12 (Research Article)
Received on 17 August, 2012; received in revised form 20 November, 2012; accepted 29 November, 2012
ANALYTICAL METHOD DEVELOPMENT OF ESOMEPRAZOLE IN BULK AND SINGLE COMPONENT FORMULATION P.M. Rachmale
Modern College of Pharmacy, Yamunanagar, Nigdi, Pune, Maharashtra, India ABSTRACT
Esomeprazole is a proton pump inhibitor which reduces gastric acid secretion through inhibition of H+/K+-ATPase in gastric parietal cells. By inhibiting the functioning of this enzyme, the drug prevents formation of gastric acid. Esomeprazole is combined with the antibiotics, clarithromycin and amoxicillin (or metronidazole in penicillin-hypersensitive patients) in the 7-14 day eradication triple therapy for Helicobacter pylori. Infection by H. pylori is the causative factor in the majority of peptic and duodenal ulcers. Common side effects of Esomeprazole include headache, diarrhea, nausea, gas, decreased appetite, constipation, dry mouth, and abdominal pain. More severe side effects are severe allergic reactions, chest pain, dark urine, fast heartbeat, fever, paresthesia, persistent sore throat, severe stomach pain, unusual bruising or bleeding, unusual tiredness, and yellowing of the eyes or skin. Proton pump inhibitors may be associated with a greater risk of hip fractures and Clostridium difficile- associated diarrhea. Patients are frequently administered the drugs in intensive care as a protective measure against ulcers, but this use is also associated with a 30% increase in occurrence of pneumonia. It is not official in any of the Pharmacopoeias and only listed in The Merck Index and Martindale, The Complete Drug Reference. There is no official method reported for the estimation of Esomeprazole. Literature survey has indicated that there are no analytical methods for estimation of Esomeprazole single component by UV-Visible Spectrophotometry but there are few methods which are reported like RP-HPLC method, validated Kinetic Spectrophotometric in commercial dosage forms, HPLC-UV method for the determination of Esomeprazole in human urine. Hence, the objective of the work is to develop simple, precise, accurate, sensitive, rapid and economical UV-Visible Spectrophotometric methods and a new simple HPLC method of analysis for the estimation of Esomeprazole in bulk and pharmaceutical formulations.
INTRODUCTION: All atoms and molecules are capable of absorbing energy in accordance with certain restrictions i.e. depending on the structure of the substance, energy may be furnished in the form of electromagnetic radiation. The kind and the amount of the radiation absorbed by a molecule depend on the
The study of these dependencies is called as “absorption spectroscopy”. Quantitative spectroscopic analysis is based on the relationship between the amount of light absorbed and the amount of absorbing substance. The basic UV-Visible spectrophotometer is the absorption of the UV-Visible region, which arise s QUICK RESPONSE CODE
IJPSR:
ICV (2011)- 5.07
Website:
www.ijpsr.com
Keywords:
Esomeprazole, UV Analysis, Method Development of Esomeprazole, Zero Order UV- Analysis, First Order UV-Analysis
Correspondence to Author:
P.M. Rachmale
Modern College of Pharmacy,
Yamunanagar, Nigdi, Pune, Maharashtra, India
the radiant energy of definite and narrow wavelength of monochromatic radiation. Light absorption in the UV- Visible region causes the transition of an electron from a ground state and relaxation of energy takes place very rapidly. The important consequences of rapid relation of the excited states are not appreciably distributed by absorption of light energy from any source. Therefore, the fraction of light absorbed from an incident beam is independent of the intensity of these beams 1.
Advantages of Instrumental Methods: Small amount of sample is needed for analysis, High sensitivity is obtained, Measurements obtained are reliable, The determination is very fast, Complex samples can be handled.
Limitations of Instrumental Methods:Skilled person is required, Cost of equipment is high, Sizable space is required,The sensitivity and accuracy depends on the instruments or wet chemical methods.
Techniques used in Instrumental Methods: There are many techniques available for the analysis of materials; however, they all are based on the materials interaction with energy. This interaction permits the creation of a signal that is subsequently detected and processed for its information content. Chemical instrumentation includes the following principle types 2
:
Spectroscopic techniques: Spectroscopy measures the interaction of the material with electromagnetic radiation. Different types are:
Ultraviolet and visible spectrophotometry,
Fluorescence and phosphorescence spectrophoto-metry,
Atomic spectrometry (emission and absorption),
Infrared spectrophotometry,
Raman spectroscopy,
X-ray spectroscopy,
Nuclear magnetic resonance spectroscopy,
Electron spin resonance spectroscopy .
Literature survey: Reported methods of analysis for Esomeprazole as a single component.
1. Development and statistical validation of spectroscopic method for estimation of Esomeprazole in tablet dosage form using UV visible spectrometer: Esomeprazole has the absorbance maxima at 303nm (Method A), and in the first order derivative spectra, showed zero crossing at 303nm, with a sharp peak at 292nm when n=1 (Method B), Method C applied was Area Under Curve (AUC) for analysis of Esomeprazole in the wavelength range of 294-310nm. Drug followed the Beer’s Lamberts range of 5-40 μg/ml for the Method A, B C. Results of analysis were validated statistically 3.
2. Physicochemical characterization U.V. spectro-photometric method development amd validation studies of Esomeprazole magnesium trihydrate:The method was based on U.V. absrption method. Method
a. Zero order spectrumMethod B) First order spectrumMethod C) AUC 4.
3. Estimation of Esomeprazole and Domperidome by absorption ratio method in pharmaceutical dosage forms: The method involved Q-absorption analysis based on the measurement of absorbance at two wavelengths, i.e λmax of Esomeprazole (303 nm) and Iso-absorptive point of both drugs (290 nm) 5.
4. Development and validation of HPLC method for the determination of Esomeprazole:separation was achieved isocratically on a C18 column
utilizing mobile phase of
acetonitrile/phosphate buffer (60:40, v/v, pH 7) Uvdetection at 205 6.
5. Determination of Esomeprazole and its two metabolite in human, rat and dog plasma by liquid chomatography 7.
Nature of investigation:
Photometric Mode: This is the fixed wavelength measurement mode. This measures the absorbance (ABS) or % transmittance (T %) at a fixed wavelength. Spectrum Mode: This is the mode in which spectral measurement is performed. There are three types of measurement available i.e. ABS (absorbance), T % (% transmittance) and single beam E (energy) 6.
Quantitation Mode: This is the mode in which unknown concentration of samples are measured by plotting a calibration curve of standard solutions. The following 4 methods in quantitation mode are available, which depend on the number of wavelengths used for the measurement:
[image:3.612.28.296.347.428.2]1. One – wavelength method 2. Two–wavelength method 3. Three – wavelength method 4. Derivative quantitation 7
TABLE 1:
Make Shimadzu Corporation Ltd.,
Japan
Model UV 1700
Specification 190 to 1100 nm
Wavelength range Spectral
Bandwidth 2nm
Goals of investigation: Esomeprazole is a proton pump inhibitor which reduces gastric acid secretion through inhibition of H+/K+-ATPase in gastric parietal cells. By inhibiting the functioning of this enzyme, the drug prevents formation of gastric acid. Esomeprazole is combined with the antibioticsclarithromycin and amoxicillin (or metronidazole in penicillin-hyper-sensitive patients) in the 7-14 day eradication triple therapy for Helicobacter pylori. Infection by H. pylori is the causative factor in the majority of peptic and duodenal ulcers.
Common side effects of Esomeprazole include headache, diarrhea, nausea, gas, decreased appetite, constipation, dry mouth, and abdominal pain. More severe side effects are severe allergic reactions, chest pain, dark urine, fast heartbeat, fever, paresthesia, persistent sore throat, severe stomach pain, unusual bruising or bleeding, unusual tiredness, and yellowing of the eyes or skin.
Proton pump inhibitors may be associated with a greater risk of hip fractures and clostridium difficile-associated diarrhea. Patients are frequently administered the drugs in intensive care as a protective measure against ulcers, but this use is also associated with a 30% increase in occurrence of pneumonia. It is not official in any of the Pharmacopoeias and only listed in The Merck Index, and Martindale, The Complete Drug Reference.
There is no official method reported for the estimation of Esomeprazole. Literature survey has indicated that there are no analytical methods for estimation of Esomeprazole single component by UV-Visible Spectrophotometry but there are few methods which are reported like RP-HPLC method, validated Kinetic Spectrophotometric in commercial dosage forms, HPLC-UV method for the determination of Esomeprazole in human urine.Hence the objective of the work is to develop simple, precise, accurate, sensitive, rapid and economical UV-Visible Spectrophotometric methods and a new simple HPLC method of analysis for the estimation of Esomeprazole in bulk and pharmaceutical formulations.
Drug Profile:
TABLE 2 12:
Mol. Formula C17H19N3O3S Mol. Weight 345.417 g/mol
Chemical Name
(S )-5-methoxy-2-[(4-methoxy-3,5-dimethylpyridin-2-yl)methylsulfinyl]-3H -benzoimidazole
Description white to slightly colored crystalline powder
Solubility Very slightly soluble in water
Melting Point 155o C
Category
1. Anti-Ulcer Agents
2. Enzyme Inhibitors
3. Proton-pump Inhibitors
[image:3.612.314.583.420.740.2]MATERIALS AND METHODS:
Plan of work: Selection of single component formulation, Market surveys, Solvent selection, Selection of analytical wavelength, Type of instrument, Preparation of working curve, Sample measurement and calculations, Evaluation of reproducibility and recognitions of variations 13,14.
Method’s:
Zero order spectrum method.
Derivative spectrum method.
Validation of analytical method’s 15: 1. Analytical Procedure 2. Specificity
3. Sensitivity 4. Accuracy 5. Precision 6. Robustness 7. Limit of detection 8. Linearity
9. Stability
10.Limit of quantitation 11.Range
12.Cost of analysis
Year of experimentation: 2012-13.
Site: Modern college of Pharmacy, Nigdi , Pune. RESULTS AND DISCUSSION:
Zero Order Spectrum (Calibration Curve Method): A. Preparations of drug stock solution: Accurately
about 10 mg of ESOMEPRAZOLE was weighed and transferred to 100 ml volumetric flask. To it 40 ml of ethanol was added to dissolve the drug completely with vigorous shaking then the volume was made up with distilled water up to the mark to give the drug stock solution of concentration 100 µ/ml.
B. Preparation of Standard Drug Dilutions: From the stock solution of ESOMEPRAZOLE appropriate volumes were pipetted out and transferred to 10 ml volumetric flasks. The volume was made up to
the mark with glass distilled water to give the samples of desired concentrations.
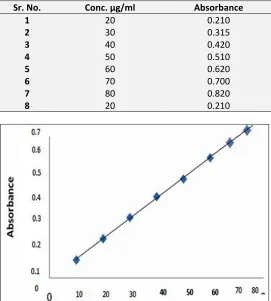
[image:4.612.314.587.196.394.2]Selection of analytical wavelengths: The standard solutions were then scanned in the spectrum mode of the instrument from 400 nm to 200 nm against glass distilled water as blank. The zero order derivative spectrum obtained with wavelength difference (n=0) showed a sharp peak was obtained at 301 nm as shown in figure 1.
[image:4.612.314.585.419.720.2]FIG. 1: ZERO ORDER SPECTRUM
TABLE 2: STANDARD CALIBRATION TABLE FOR ESOMEPRAZOLE
Sr. No. Conc. µg/ml Absorbance
1 20 0.210
2 30 0.315
3 40 0.420
4 50 0.510
5 60 0.620
6 70 0.700
7 80 0.820
8 20 0.210
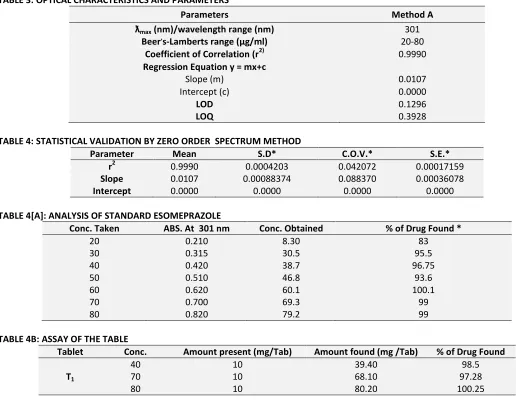
TABLE 3: OPTICAL CHARACTERISTICS AND PARAMETERS
Parameters Method A
ƛmax (nm)/wavelength range (nm) 301
Beer,s-Lamberts range (µg/ml) 20-80
Coefficient of Correlation (r2) 0.9990
Regression Equation y = mx+c
Slope (m) 0.0107
Intercept (c) 0.0000
LOD 0.1296
[image:5.612.29.545.61.464.2]LOQ 0.3928
TABLE 4: STATISTICAL VALIDATION BY ZERO ORDER SPECTRUM METHOD
Parameter Mean S.D* C.O.V.* S.E.*
r2 0.9990 0.0004203 0.042072 0.00017159
Slope 0.0107 0.00088374 0.088370 0.00036078
Intercept 0.0000 0.0000 0.0000 0.0000
TABLE 4[A]: ANALYSIS OF STANDARD ESOMEPRAZOLE
Conc. Taken ABS. At 301 nm Conc. Obtained % of Drug Found *
20 0.210 8.30 83
30 0.315 30.5 95.5
40 0.420 38.7 96.75
50 0.510 46.8 93.6
60 0.620 60.1 100.1
70 0.700 69.3 99
80 0.820 79.2 99
TABLE 4B: ASSAY OF THE TABLE
Tablet Conc. Amount present (mg/Tab) Amount found (mg /Tab) % of Drug Found
T1
40 10 39.40 98.5
70 10 68.10 97.28
80 10 80.20 100.25
The results of the analysis of tablet formulations by Zero order spectrum method are given below in Table 5.
TABLE 5[A]: ANALYSIS OF TABLET FORMULATION
Tablet sample Amount present (mg/tab) Amount Found (mg/tab) % of Label Claim
T1
40 39.45 98.57
40 40.01 100.25
40 38.98 97.45
40 39.10 97.75
40 40.10 100.25
40 39.00 97.5
TABLE 5[B]:STATISTICAL EVALUTION BY ZERO ORDER SPECTRUM METHOD
Tablet sample % Mean S.D C.O.V S.E
T1 98.60 1.110 1.125 0.453
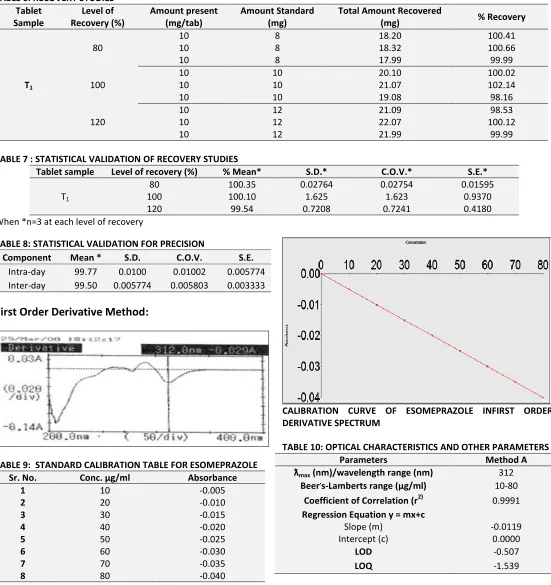
TABLE 6: RECOVERY STUDIES Tablet
Sample
Level of Recovery (%)
Amount present (mg/tab)
Amount Standard (mg)
Total Amount Recovered
(mg) % Recovery
T1
80
10 8 18.20 100.41
10 8 18.32 100.66
10 8 17.99 99.99
100
10 10 20.10 100.02
10 10 21.07 102.14
10 10 19.08 98.16
120
10 12 21.09 98.53
10 12 22.07 100.12
10 12 21.99 99.99
TABLE 7 : STATISTICAL VALIDATIONOF RECOVERY STUDIES
Tablet sample Level of recovery (%) % Mean* S.D.* C.O.V.* S.E.*
T1
80 100.35 0.02764 0.02754 0.01595
100 100.10 1.625 1.623 0.9370
120 99.54 0.7208 0.7241 0.4180
When *n=3 at each level of recovery TABLE 8: STATISTICAL VALIDATION FOR PRECISION
Component Mean * S.D. C.O.V. S.E.
Intra-day 99.77 0.0100 0.01002 0.005774
Inter-day 99.50 0.005774 0.005803 0.003333
First Order Derivative Method:
TABLE 9: STANDARD CALIBRATION TABLE FOR ESOMEPRAZOLE
Sr. No. Conc. µg/ml Absorbance
1 10 -0.005
2 20 -0.010
3 30 -0.015
4 40 -0.020
5 50 -0.025
6 60 -0.030
7 70 -0.035
8 80 -0.040
CALIBRATION CURVE OF ESOMEPRAZOLE INFIRST ORDER DERIVATIVE SPECTRUM
TABLE 10: OPTICAL CHARACTERISTICS AND OTHER PARAMETERS
Parameters Method A
ƛmax (nm)/wavelength range (nm) 312 Beer,s-Lamberts range (µg/ml) 10-80
Coefficient of Correlation (r2) 0.9991
Regression Equation y = mx+c
Slope (m) -0.0119
Intercept (c) 0.0000
LOD -0.507
[image:6.612.88.492.657.709.2]LOQ -1.539
TABLE 11: STATISTICAL VALIDATION BY ZERO ORDER SPECTRUM METHOD
Parameter Mean S.D* C.O.V.* S.E.*
r2 0.9991 0.0018316 0.0018330 0.0007477
Slope -0.0119 0.002328 0.2326 0.0009504
Intercept 0.000 0.0000 0.0000 0.0000
TABLE 12: ASSAY OF THE TABLE
Tablet Conc. Amount present (mg/Tab) Amount found (mg /Tab) % of Drug Found
T1
40 10 40.12 100.3
70 10 69.89 99.84
80 10 80.40 100.5
TABLE 13 : ANALYSIS OF STANDARD ESOMEPRAZOLE
Conc. Taken ABS. at 312 nm Conc. Obtained % of Drug Found *
10 -0.005 9.76 97.6
20 -0.010 19.20 96
30 -0.015 28.90 96.6
40 -0.020 39.78 99.45
50 -0.025 49.45 98.5
60 -0.030 59.90 99.83
70 -0.035 68.20 97.42
80 -0.040 79.10 100.12
*Average of six readings
TABLE 14: ANALYSIS OF TABLET FORMULATIONS
Tablet sample Amount Present (mg/tab) Amount Found (mg/tab) % of Label Claim
T1
10 9.12 97.8
10 9.80 99.5
10 8.99 97.47
10 10.02 100.05
10 10.07 100.17
10 9.99 99.97
T1 : is the brands of tablet formulations.
TABLE 15: STATISTICAL EVALUATION BY FIRST ORDER DERIVATIVE SPECTRUM METHOD
Table Sample % Mean* S.D.* C.O.V.* S.E.*
T1 98.16 0.9622 0.9704 0.3928
*Average of six readings
TABLE 16:RECOVERY STUDIES Tablet
Sample
Level of Recovery (%)
Amount present (mg/tab)
Amount Standard (mg)
Total Amount Recovered
(mg) % Recovery
T1
80
10 8 18.08 100.44
10 8 17.99 99.94
10 8 18.02 100.11
100
10 10 20.10 100.5
10 10 20.03 100.15
01 10 19.99 99.95
120
10 12 22.04 100.18
10 12 21.86 99.36
10 12 21.96 99.81
TABLE 17: STATISTICAL VALIDATIONOF RECOVERY STUDIES
Table Sample Level of Recovery (%) % Mean* S.D.* C.O.V.* S.E.*
T1
80 100.16 0.2076 0.2072 0.1198
100 100.02 0.2273 0.2268 0.1312
120 99.78 0.3353 0.3360 0.1935
When *n=3 at each level of recovery
TABLE 17A: STATISTICAL VALIDATION DATA FOR ESOMEPRAZOLE
Method % Mean * S.D. C.O.V. S.E.
Method A 98.7 1.110 98.6 98.7
Method B 99.16 0.9622 99.98 99.16
TABLE 18: STATISTICAL VALIDATION FOR PRECISION
Component Mean * S.D. C.O.V. S.E.
Intra-day 99.55 0.007528 0.007562 0.003073
TABLE 19: OPTICAL CALIBRATION CURVE OF ESOMEPRAZOLE
Parameters Method A Method B
max (nm)/wavelength range (nm) 301 312
Beer’s – Lambert’s range (µg/ml) 20-80 10-80
Coefficient of correlation (r2 ) 0.9990 0.9996
Regression equation : Y = mx + c
Slope (m) 0.1296 -0.00198
Intercept (c) 0.0000 0.0000
LOD 0 .0107 -0.507
LOQ 0.1226 -1.539
CONCLUSION: It is not official in any of the Pharmacopoeias and only listed in The Merck Index, and Martindale, The Complete Drug Reference. There is no official method reported for the estimation of Esomeprazole. Literature survey has indicated that there are no analytical methods for estimation of Esomeprazole single component by UV-Visible Spectrophotometry but there are few methods which are reported like RP-HPLC method, validated Kinetic Spectrophotometric in commercial dosage forms, HPLC-UV method for the determination of Esomeprazole in human urine.
Hence, the objective of the work is to develop simple, precise, accurate, sensitive, rapid and economical UV-Visible Spectrophotometric methods and a new simple HPLC method of analysis for the estimation of Esomeprazole in bulk and pharmaceutical formulations. The methods were based on the development of calibration curve for the standard drug and the analysis of the formulation aws done using the calibration curve in the quantitation mode of the Spectro-photometer (Method A). The standard drug solution were scanned in the spectrum mode and the first order derivative spectra with (n=1) processed showed zero crossing at the absorbance maxima of the normal
spectra, the derivative dA/dƛ is plotted against the concentration of the standard solution (Method B).
REFERENCES:
1. Christian G. D., In: Analytical Chemistry 6th Edn, Wiley international, 2004, 60 .
2. Robert E., Notari, In; Biopharmaceutical and Chemical Pharmacokinetics, 4th Edn, A Textbook for Pharmacy Students and Pharmaceutical Chemists, 1987, 2.
3. Watson G. D., Pharmaceutical Analysis, Elsevier Churchill Livingstone, 2nd Edn, A Textbook of Pharmacy, Student and Pharmaceutical Chemistry 2005, 5.
4. Mendham J., Denny R. C. and Thomas ML, In; Vogel's Text Book of Quantitative Analysis, 6th Edn, Pearson Education Limited, 2004, 1-10, 268.
5. Skoog D. A., Holler F.J. and Nieman T. A., In: Principle of Instrumental Analysis, 3rd Edn., Saunders College Publications, London, 1985, 1.
6. Davidson A G., In: Practical Pharmaceutical Chemistry, 4th Edn, Vol. 2, CBS Publishers and Distributors, New Delhi, 1997, 275.
7. Connors K. A., In: A Textbook of Pharmaceutical Analysis, 3rd Edn, Wiley Interscience Publications, 1999, pg 408. 8. Kalsi P. S., In: Spectroscopy of organic compound, 5th Edn.,
New age International Publisher's, New Delhi, 7.
9. Sharma Y. R., In: Introduction of Organic Spectroscopy, 4th Edn, CBS Publishers and Distributors, New Delhi, 1991, 22.
10. Swarbric J. and Boylan J. C, In: Encyclopedia of Pharmaceutical Technology, Vol. 15, Marcel Dekker Inc., New York, 1997, 297.
11. Beckett A. H., and Stenlake J. B., In: Practical Pharmaceutical Chemistry, 4th Edn, Part 2, CBS Publishers and Distributors, 2002, 290.
12. Kasture A. V., Mahadik K. R.; Wadodkar S. G., and More H. N., In: Pharmaceutical Analysis, Vol.11, Nirali Prakashan, 48-57, 156
13. Schirmer R. E., In: Modern Methods of Pharmaceutical Analysis, 2nd Edn. Vol.1, CRC Press, 1991, pg 31
14. ICH, Q2A, Text on Validation of Analytical Procedures, International Conference on Harmonization, Geneva, October 1994, 1.
15. ICH, Q2B, Validation of Analytical Procedures: Methodology, International conference on ha Harmonization, Geneva, November, 1996, 1.
How to cite this article: