ISSN: 1992-8645 www.jatit.org E-ISSN: 1817-3195
461
PERFORMANCE AND RELIABILITY FOR IRIS
RECOGNITION BASED ON CORRECT SEGMENTATION
1KHIDER NASSIF JASSIM, 2ASAMA KUDER NSEAF
1
Faculty of Management and Economics Department of Statistics University of Wasit Al-Kut, Iraq
2
Institute of Visual Informatics (IVI), Universiti Kebangsaan Malaysia, Malaysia
E-mail: [email protected]
,
2ABSTRACT
The recognition of Iris is regarded as the most dependable and accurate system of biometric identification so far. This system captures an individual's eye image in which the iris in the image is used for further normalization as well as segmentation to extract its feature. The iris recognition systems performance relies heavily on the segmentation process. In fact, segmentation process is employed for localizing the accurate iris region in a certain portion of an eye and this must be correctly and accurately carried out to take out the eyelashes, reflection, eyelids and pupil noises found in the region of iris. In this study, Enhance Hough Transform (EHT) approach in the segmentation process will be used. The enhancement locates the pupil region of eye image by using threshold and Circle Hough Transform (CHT). Hence, the pupil parameter will capture the region of iris from the image of eye and then apply Hough Transform for locating outer boundary in less space search. This approach is found more effective in emphasizing the accuracy of iris segmentation. The segmented iris region is normalized so as to reduce the dimensional inconsistencies among the regions of iris through adopting the Model of Daugman’s Rubber Sheet. The iris features were, then, encoded through convolving the normalized region of the iris with 1D Log-Gabor filters and phase quantizing the output so as to create a bit-wise biometric template. The distance of Hamming was selected as corresponding metric which provided the measure of a number of bits which did not match up among the iris templates. This proposed method is tested with the eye images obtained from MMU V1 iris database.
The performance of such a proposed method showed that the accuracy of the iris recognition increased.
Keywords: Iris Biometrics, Iris Recognition, Enhance Iris Segmentation, Hough Transform, Geodesic
Active Contour, MMU Iris Database
1. INTRODUCTION
In computer vision, human authentication or identification has been always an appealing goal. Such systems of authentication which are based on the human features like voice, iris and face are called biometric systems. These systems could be either behavioral or physiological on the basis of the used features. Human voices and signatures are categorized as behavioral whereas iris, figure print and face traits are classified as physiological. The intra-personal variation degree in a physical feature is relatively smaller than a behavioral feature. For instance, a signature is affected by both controllable actions as well as less psychological factors and the pattern of speech is affected by current emotional condition while fingerprint template is independent. However, all physiology-based biometrics do not
provide satisfactory rates of recognition (false rejection rates and/or false acceptance respectively referred to as FRR and FAR).
ISSN: 1992-8645 www.jatit.org E-ISSN: 1817-3195
462 subject to harmful impact of aging, the iris small-scale radial characteristics stay fixed and stable for almost one year during life. Moreover, the recognition of iris has benefits such as computation high speed due to sample size, accuracy and simplicity in comparison to other biometric traits [21]. The recognition of iris depends on the unique human iris patterns in identifying and verifying an individual.
The system design of the iris recognition is a combination and application work of many different technologies such as patter recognition, computer vision, optical and statistical analysis, which allows to realize a real time highly accurate system of human identification based on iris pattern extraction, analysis and matching from a digital image of a human eye [9].
The systems of iris recognition are classified into four blocks: these are iris normalization, iris segmentation, feature matching and extraction. The segmentation of iris split up the region of iris from the whole captured image of eye. Iris normalization overhauled the segmented iris region dimensions to help provide accurate comparison. The characteristic extraction draws out the biometric templates from normalized image, matching template with reference templates.
The iris system performance heavily relies on the iris segmentation precision. The current methods presume that pupil is constantly central to an iris. As such, both iris and pupil have a central point in common. Such inaccurate results lead to incorrect iris region segmentation. The lower and upper parts of the outer iris boundary are broadly thwarted by eyelashes as well as eyelids and this presents some headaches during segmentation process. Such eyelashes and eyelids behave as noise which must be eliminated so as to get ideal segmentation results. In order to sort out these problems, this paper presented two proposed segmentation algorithms separately. Firstly, it proposed enhance Hough transform based accurate pupil and iris regions segmentation. Secondly, it proposed Geodesic Active Contour (GAC) algorithm to make a comparison between them.
This study answer the fowling questions; how can iris recognition identifying and verifying an individual unique human iris patterns. And, how can isolate iris region from the whole captured image of eye. The rest of the current paper is organized as the following: section 2 highlights the related works. Dataset is described in section 3. Section 4 proposed the iris segmentation. Sections
5, 6, and 6 discuss normalization, encoding techniques, and matching techniques respectively. Section 8 provides the experimental results, analysis and discussion, and a comparison between the suggested method and some other implemented methods in the literature. The last section provides the conclusion of the study.
2. RELATED WORKS
The use of iris pattern (color) was initially proposed by The French ophthalmologist Alphonse Bertillon as a basis for personal identification [2]. In 1981, Flom and San Francisco ophthalmologist Aran Safir thoroughly read different scientific reports describing the iris great variation and proposed the use of the iris as a basis for a biometric.
In 1987, they collaborated with the computer scientist John Daugman of Cambridge University in England, whose promising study results related to designing software for iris identification were published in1992. Subsequently, similar works have been carried out among which the systems of W.Boles [3], R.Wildes [26], and R.Sanchez- Reillo [19] which are different in terms of pattern matching algorithms as well as the representation of iris feature (iris signature). The solution of R.Wildes consists of (i) iris localization Hough transform (ii) modified normalized link for corresponding process and (iii) Laplacian pyramid (multi-scale decomposition) to constitute different spatial features of the iris of human. The prototype of W.Boles works in building (j) a gray level profiles dimensional representation of the iris followed by getting the wavelet transform zero-crossings of the resulting representation, and (jj) original functions of dissimilarity which assist in selecting relevant information for effective matching computation. The systems of J.Daugman and R.Sanchez-Reillo are implemented to exploit (l) integro-differential operators to detect the inner and outer boundaries of iris, (ll) Gabor filters which extract unique binary vectors forming iris code TM, and (lll) a statistical matcher (logical exclusive OR operator) which basically analyzes the average Hamming distance between two codes (bit to bit test agreement).
ISSN: 1992-8645 www.jatit.org E-ISSN: 1817-3195
463 The mathematical algorithms of Daugman have been, indeed, making contribution to commercial solution which is patented by IriScan Inc.
Masek et.al. [13] used an edge detection method which is relatively distinct from Canny operator and implemented a circular Hough transform to extract the iris boundary.
Kulkarni et.al. [10] developed a system which can take the eye image, detect the iris and extract it. The extracted iris binary image is, then, produced so as to constitute an equivalent barcode.
Desoky et.al. [6] proposed an algorithm for the iris recognition in which a group of the given eye's iris images are fused to create a final template utilizing the most consistent data of the feature. Wight matrix of feature consistency is determined based on the noise level provided in the considered images.
A. Kumar et al. [11] proposed a system for ‘open-source’ iris recognition so as to verify both the performance of human iris as a biometric and also its uniqueness.
G. Sharma, et.al. [23] adopted a fusion mechanism which employs both a Circular Hough Transform and a Canny Edge Detection scheme to detect the boundaries of the iris in the eye’s digital image.
C.M.Patil et. al. [17] claimed that Iris recognition is considered as one of the most reliable biometric technologies. The iris recognition system performance could be ruined by poor quality images leading to failure of enrolling (FTE) rates and high false rejection rates (FRR).
Mohammad-Ramli et.al. [14] proposed distinct and automatic identification of an individual on the basis of the unique features as well as characteristics demonstrated by individuals. The work of authors investigates the developed automatic recognition of the iris for personal identification so as to verify both the performance of human iris as a biometric and its uniqueness on the basis of Hu invariant moment.
Ritter et.al. [18] provided results for an active contour which finds the border of pupil-iris in the eye slit lamp images. Preprocessing involves the production of a variance image from the original image and subsequently locating the annulus, of a certain size, that has the lowest mean variance.
Many other algorithms were applied for iris localization as in [12, 15, and 16]. The work aims at
correctly locating the pupil boundary from the iris image. In other words, it finds the position of radius and centre of the pupil and then segmented the outer of iris using two algorithms separately; Hough Transform and Geodesic Active Contour (GAC) algorithm.
3. DATA
The researcher opted to work with the iris database of Multimedia University (MMU), providing a total of 450 images, 2 irises per subject and 5 images per iris. All images were produced by using the LG Iris Access 2200 at a range of 7-25 centimeters. The researcher has selected this specific dataset over the others published online due to the following reasons:
A. It is free.
B. Because of some privacy issues, most iris datasets need lengthy processes of registration, administrative contacts and official paperwork. Nevertheless, the researcher found it easy to acquire this particular dataset within a few days.
C. Most datasets provide 3 or less images per iris. This specific dataset produces 5 images per iris, providing some functional ease for our machine learning algorithms.
The major defect encountered during the use of such dataset was the low solution across all images of iris. Algorithms of post iris localization used in the dataset of MMU return iris radii of almost about 30 pixels, whereas state-of-the-art tool permits the collection of pixel radii from 80 up to 130+ pixels. This inevitably affected the results which are obtained from the particular methods of feature extraction adopted in this research.
4. PROPOSED IRIS SEGMENTATION
The two Methods, namely, Enhance Hough Transform Algorithm and Geodesic Active Contours Algorithm were both implemented during this stage. This was in a bid for making a comparison between them.
4.1 Segmentation Using Enhance Hough
Transform
ISSN: 1992-8645 www.jatit.org E-ISSN: 1817-3195
[image:4.612.313.524.122.269.2]464 Firstly, binaries Eye image using threshold equal 50. Then, Circle Hough Transform is applied to estimate center and radius of pupil and then from pupil parameters with experiment analysis will capture Iris region from Eye image to reduce the search space of Hough Transform for detecting outer iris. The manual setting of the range of radius values was set for pupil (15– 50) while for iris (55- 100). Figure 1 below illustrates the proposed iris segmentation using Enhance Hough Transform (EHT).
Figure 1: Enhance Hough Transform (EHT) for the segmentation of iris, (a) original image, (b) threshold image, (c) pupil segment, (d) iris capture, and (e) iris
segment.
4.2 Localization Using Geodesic Active
Contours Algorithm
It is seen from figure 1(b) that binaries Eye image still have nose like eyelash, eyebrows, shadow or specular reflection on the pupil pose severe problems.
To solve this problem, the researcher used Circle Hough Transform to detect center and radius of pupil after that drawing the pupil, flowed this binaries image which gives clear pupil region without noise as shown in figure 2(d) which is to serve as input for improve outer boundary that will apply the Geodesic Active Contours (GAC) approach which was developed by [22].
Its development relies on the link between the geodesics computation (minimal length curves) and active contours. This strategy aimed at developing a curve which should be arbitrarily initialized within the iris under the effect of the geometric features describing the boundary of iris. The GACs approach is a combination of the classical “snakes” energy minimization approach as well as the geometric active contours according to the
evolution of the curve. Figure 2 (f) below will show the iris segmentation of enhance GAC.
[image:4.612.91.302.233.373.2]
Figure 2: Geodesic Active Contours (GAC) for the segmentation of iris, (a) original image, (b) threshold image, (c) pupil segment, (d) pupil region without noise,
iris free, and (f) iris segment.
5. NORMALIZATION
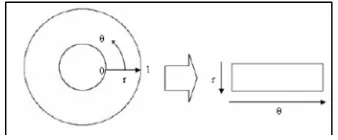
The region of segmented iris must be normalized so as to root out the dimensional inconsistencies among iris regions. This will be obtained through implementing a version of rubber sheet model of Daugman [5]. Figure 3 below demonstrates the Rubber Sheet Model of Daugman used for Iris Normalization.
Figure 3: Daugman’s Rubber Sheet Model [5].
6. FEATURES EXTRACTION AND ENCODING
Feature encoding was carried out through convolving the normalized pattern of iris with 1D Log-Gaber wavelet D. Field [7].2D normalized patterns are divided into a lot of 1D signals. Each row matches a circular ring on the region of iris.
The angular direction is considered rather than the radial one, which matches the normalized pattern columns. The features are taken in codes of 0 and 1.
7. CLASSIFICATION AND MATCHING
[image:4.612.334.503.443.513.2]ISSN: 1992-8645 www.jatit.org E-ISSN: 1817-3195
465 matching algorithm is the Hamming distance which was initially developed by Daugman [5]. Such algorithm, the Hamming distance, is described by this equation:
, ∑ ⊗ (1)
Where L refers to the vector length and and are the -th component of the template and sample vector, respectively, which are XORed in the equation. If the distance achieved is below the level of predefined threshold, the investigated sample is regarded as related to the user whose template is being investigated. The threshold level selection often relies on the final application.
8. RESULT AND DISCUSES
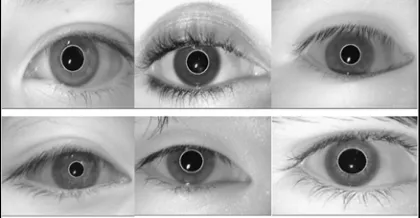
[image:5.612.91.301.378.487.2]The proposed method demonstrated its ability to easily detect the iris inner boundary. It shows 100% success of the detection of pupil for MMU v1 Iris databases. Figure 4 demonstrates the obtained results of the method for detecting pupil.
Figure 4: pupil detection for MMU v1 database.
The initial test was performed to guarantee the proposed systems uniqueness. It was found by measuring the number of degree of freedom symbolized by the templates. Degree of Freedom, widely symbolized as DOF, depicts the iris patterns complexity. It could be computed by approximating the set of the distance values of inter-class Hamming as a binomial distribution. DOF could be described as:
(2)
Where p refers to the mean and σ is the distribution standard deviation.
The Iris Recognition System essential motive is to obtain a clear distinction between Intra-class and Inter-class Hamming Distance Distribution.
However,
there is some sort of overlapbetween intra-class and inter-class distribution which lead to false rejection and false acceptance rates. The false rejection rate (FRR), also called Type I error, provides the probability measures of an enrolled individual which is not recognized by the system.
The false acceptance rate (FAR), called Type II error, provides the probability measures of an individual mistakenly recognized as another individual. The false rejection and false acceptance rates could be calculated depending on the amount of overlap between the intra-class and inter-class distributions. The rate of false acceptance is described by the normalized area between 0 and the point of separation, κ, in the inter-class distribution , given by:
!""# # $
%
!""# # &
%
(3)
The rate of false rejection is viewed as the normalized area existing between the 1 in the intra-class distribution '(), and the point of separation,
κ, given by
*+,-# # &
$
*+,-# # &
%
(4)
It is clear that the rates of false rejection as well as the false acceptance are all affected by the point of separation. Therefore, the rates of false acceptance and false rejection must be considered while selecting the point of separation. Equal Error Rate (EER) is, thus, counted from the curve of ROC. The EER is the point on the curve of ROC where the FAR is equal to the FRR.
Below in the appendix, we can see in Tables (1-4) the Standard deviation and mean of inter-class Hamming distance (HD) distributions for both algorithms, Enhance Hough Transform (EHT) and Geodesic Active Contour (GAC) which are examined through virus temples resolution.
ISSN: 1992-8645 www.jatit.org E-ISSN: 1817-3195
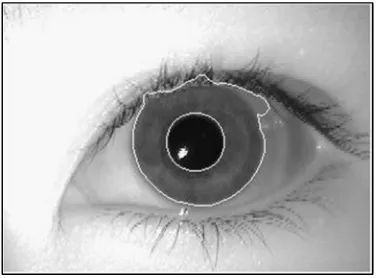
[image:6.612.100.289.168.311.2]466 The result obtained by our implementation of Hough Transform (masek, 2003) method before Enhance with accuracy is 93.82% recognition rate while the result received by Enhance Hough Transform (EHT) with accuracy is 100% recognition rate. As indicated in the picture below.
Figure 5: Image getting on the grounds by Enhance Hough Transform (EHT)
[image:6.612.322.515.256.342.2]The result received by Geodesic Active Contour (GAC) with accuracy 96.67% recognition rate. As indicated in the picture below.
Figure 6: Image getting on the grounds by Geodesic Active Contour
Figure 7 in the appendix shows the comparison between Geodesic Active Contour (GAC) and Enhance Hough Transform (EHT) for different input iris images and the corresponding Predict Hamming distance, in which the input of iris images has been predicted with minimum value of Hamming distance is a better predict from them have higher value of Hamming distance. We can see in Figure 7 that the Enhance Hough Transform almost has Hamming distance values less than Geodesic Active Contour that led to Interpretation
of the result accuracy of Enhance Hough Transform was higher than Geodesic Active Contour.
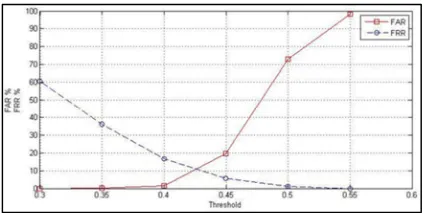
Tables 7 and 8 demonstrate False Rejection Rate (FRR) and False Acceptance Rates (FAR) for the values of distinct threshold. The calculation for Enhance Hough Transform (EHT) is made using Template of 64 x 160 parameters values and template 64 x 120 parameters values for Geodesic Active Contour (GAC).
Table.7: False accept and false reject rates for Enhance Hough Transform (EHT) with distinct points of
separation adopting the optimum parameters.
Threshold FAR% FRR%
0.3 0 63.8888
0.35 0 34.1667
0.40 0.11236 11.9444
0.45 9.16355 3.88889
0.50 71.6105 0.27778
[image:6.612.323.516.393.481.2]0.55 99.4663 0
Table.8: Rates of False acceptance and false rejection for Geodesic Active Contour (GAC) with the distinct points
of separation adopting the optimum parameters
Threshold FAR% FRR%
0.3 0 60.5556
0.35 0.03121 36.1111
0.40 1.44195 16.6667
0.45 19.6785 5.83333
0.50 72.8402 1.11111
0.55 98.1273 0
The optimum threshold HD could be determined from the Tables 7 and 8 for both Enhance Hough Transform (EHT) and Geodesic Active Contour (GAC) respectively. Moreover, based on the variations of FRR and FAR for both algorithms, it is observed that substantial maximum of FAR and minimum of FRR come around threshold of about 0.45 for Enhancing Hough Transform (EHT).
Similarly, for Geodesic Active Contour (GAC), the optimum threshold comes around 0.45 approximately again. In the verification procedure, Equal Error Rate (EER) was computed from the point on the curve of FAR which is found to be equivalent to the FRR.
[image:6.612.101.290.405.544.2]ISSN: 1992-8645 www.jatit.org E-ISSN: 1817-3195
467 Geodesic Active contour has higher Equal Error Rate (EER) which is approximately 11%.
[image:7.612.90.302.198.304.2]Therefore, based on the tests conducted above, it can be observed that we are getting the best recognition for Enhance Hough Transform (EHT) at separation point 0.45 and we are getting the best recognition for Geodesic Active Contour (GAC) at separation point 0.45.
Figure 8: Rates of False acceptance and false rejection for Enhancing Hough Transform (EHT) with the distinct
points of separation.
Figure 9: Rates of False acceptance and false rejection forGeodesic Active Contour (GAC) with distinct points
of separation.
The Hamming Distance (HD) values of predicting input images for both algorithms, Enhance Hough Transform (EHT) and Geodesic Active contour (GAC) are served as input for T-test function where predicting the Hamming Distance (HD) values for Geodesic Active contour (GAC) represent as Variable 1 for T-test function and for Enhance Hough Transform (EHT) represent as Variable 2 for T-test function.
The T-test is needed to determine if two sets of data (Variable 1 and Variable 2) are significantly different from each other as shown in Table 9 below. The Mean of Variable 2 is less than the Mean of Variable 1 which means that it is alternative Hypothesized and the (p) probability of observing is less than a test statistic (t Stat) which
[image:7.612.90.302.357.464.2]means that the two variables have significant difference at (p) value less than 0.01.
Table.9 T-test for Geodesic Active contour (GAC) and Enhance Hough Transform (EHT)
T-test Function Variable 1 Variable 2
Mean 0.30246023 0.28300879
Variance 0.003277385 0.002596473
Observations 90 90
Pearson Correlation
0.730849555
Hypothesized Mean Difference
0
Df 89
t Stat 4.59911729
P(T<=t) one-tail 6.98765E-06 t Critical one-tail 1.662155326 P(T<=t) two-tail 1.39753E-05 t Critical two-tail 1.9869787
9. CONCLUSION
This study has proposed a system of iris recognition in which segmentation was carried out utilizing the algorithm of Enhance Hough Transform (EHT). The comparison was conducted in the stage of Segmentation according to accuracy and the rate of higher efficiency. Such a comparison was conducted to assess the influence of different segmentation methods on the recognition process overall performance. Accurately detecting the iris texture outer and inner boundaries is of vital importance for all systems of iris recognition.
An algorithm of automatic segmentation algorithm was proposed to localize the pupil by using threshold and Circle Hough Transform (CHT). Then, the iris image is captured from Eye image to make the search Hough Transform for iris region in smaller space area more accurate and faster to estimate the region of iris from the image of eye and separate eyelid, eyelash and reflection areas. Threshold was also utilized to isolate eyelashes and reflections.
Then, by using the algorithm of Daugman, the segmented iris region was normalized to eliminate dimensional inconsistencies between iris regions.
ISSN: 1992-8645 www.jatit.org E-ISSN: 1817-3195
468 At the end, the iris features were encoded by convolving the normalized region of iris with 1D Log-Gabor filters and phase quantizing the output so as to create a bit-wise biometric template.
The Hamming distance was selected as a matching metric which provided a measure for the number of bits in which the two templates are mismatched. The statistical independent failure between two templates would lead to a match. In other words, the two templates were considered to be created from the same iris and the Hamming distance created was lower than a Hamming distance set.
In conclusion, Limitations of this work is deal with fixed eye image and the study was limited to some certain aspects and several useful aspects have been suggested to be carried out in future research in this area.
REFRENCES
[1] Y. Belganoui, J. Guézel, and T. Mahé, "La biométrie, sésame absolu…", Industries et Techniques, France, vol., no. 817, 2000.
[2] A. Bertillon, "La couleur de l'iris", vol., no., 1886.
[3] W. W. Boles, "A security system based on human iris identification using wavelet transform", Engineering Applications of Artificial Intelligence, vol. 11, no. 1, 1998, pp. 77-85. [4] J. Daugman, "High confidence personal
identification by rapid video analysis of iris texture", Security Technology, 1992. Crime Countermeasures, Proceedings. Institute of Electrical and Electronics Engineers 1992 International Carnahan Conference on, 1992, pp. 50-60.
[5] J. G. Daugman, "High confidence visual recognition of persons by a test of statistical independence", IEEE transactions on pattern analysis and machine intelligence, vol. 15, no. 11, 1993, pp. 1148-1161.
[6] A. I. Desoky, H. A. Ali, and N. B. Abdel-Hamid, "Enhancing iris recognition system performance using templates fusion", Ain Shams Engineering Journal, vol. 3, no. 2, 2012, pp. 133-140.
[7] D. J. Field, "Relations between the statistics of natural images and the response properties of cortical cells", JOSA A, vol. 4, no. 12, 1987, pp. 2379-2394.
[8] M. Gifford, D. McCartney, and C. Seal, "Networked biometrics systems—requirements based on iris recognition", BT technology journal, vol. 17, no. 2, 1999, pp. 163-169.
[9] T. Johar, P. Kaushik, and A. P. Student, "Performance Evaluation of Iris Recognition System on CASIA and UBIRIS Databases", International Journal of Engineering Science, vol. 3666, no., 2016.
[10] S. B. Kulkarni, R. S. Hegadi, and U. P. Kulkarni, "A novel approach for iris encryption", technology, vol. 3, no., 2012, p. 7.
[11] A. kumar Dewangan, and M. A. Siddhiqui, "Human Identification and Verification Using Iris Recognition by Calculating Hamming Distance", International Journal of Soft Computing and Engineering(IJSCE), vol. 2, no. 2, 2012.
[12] N. K. Mahadeo, and N. Bhattacharjee, "An efficient and accurate iris segmentation technique", Digital Image Computing: Techniques and Applications, 2009. DICTA'09., 2009, pp. 347-352.
[13] L. Masek, and P. Kovesi, "Matlab source code for a biometric identification system based on iris patterns", The School of Computer Science and Software Engineering, The University of Western Australia, vol. 2, no. 4, 2003.
[14] N. A. Mohamad-Ramli, M. S. Kamarudin, A. Joret et al., "Iris Recognition for Personal Identification", The International Conference on Electrical Engineering (ICEE), 2008.
[15] A. K. Nsaef, A. Jaafar, and K. N. Jassim, "Enhancement segmentation technique for iris recognition system based on Daugman's Integro-differential operator", Instrumentation & Measurement, Sensor Network and Automation (IMSNA), 2012 International Symposium on, 2012, pp. 71-75.
[16] A. Onsy, and S. Maha, "A New Algorithm for Locating the Boundaries of the Human Iris", 1st IEEE International Symposium on Signal Processing and Information Technology December, 2001, pp. 28-30.
[17] C. M. Patil, "An Efficient Iris Recognition System to Enhance Security Environment for Personal Identification", vol., no.
[18] N. Ritter, R. Owens, J. Cooper et al., "Location of the pupil-iris border in slit-lamp images of the cornea", Image Analysis and Processing, 1999. Proceedings. International Conference on, 1999, pp. 740-745.
[19] R. Sánchez Reíllo, C. Sánchez Ávila, and M. Pereda, "Minimal template size for iris-recognition", vol., no., 1999.
ISSN: 1992-8645 www.jatit.org E-ISSN: 1817-3195
469 [21] S. Sanderson, and J. Erbetta, "Authentication
for secure environments based on iris scanning technology", Visual Biometrics (Ref. No. 2000/018), IEE Colloquium on, 2000, pp. 8/1-8/7. [22] S. Shah, and A. Ross, "Iris segmentation
using geodesic active contours", IEEE Transactions on Information Forensics and Security, vol. 4, no. 4, 2009, pp. 824-836.
[23] G. Sharma, R. Sharma, and P. Nigam, "Recognition of Human Iris Patterns for Biometric Identification", VSRD International Journal of Electrical, Electronics & Communication & Engineering, vol. 2, no. 6, 2012.
[24] C.-l. Tisse, L. Martin, L. Torres et al., "Person identification technique using human iris recognition", Proc. Vision Interface, 2002, pp. 294-299.
[25] R. P. Wildes, "Iris recognition: an emerging biometric technology", Proceedings of the IEEE, vol. 85, no. 9, 1997, pp. 1348-1363.
ISSN: 1992-8645 www.jatit.org E-ISSN: 1817-3195
470
Figure.7 Compression Hamming Distance Between Geodesic Active Contour (GAC) And Enhance Hough Transform (EHT)
Table.1 Mean Of The Inter-Class Hamming Distance (HD) Distribution For Virus Temples Dimensions Of Enhance Hough Transform (EHT) Algorithm.
Template 40 80 120 160 200 240 280 320 512
4 0.4128069 0.4554176 0.4744339 0.4807411 0.48398 0.4856734 0.487084 0.4880775 0.4908968
8 0.4158911 0.4565855 0.4764445 0.483326 0.4867229 0.4887101 0.489963 0.4909323 0.4936326
12 0.4170751 0.4579895 0.4772416 0.4845445 0.4880249 0.4897845 0.4909876 0.4919442 0.4944816
16 0.4178695 0.4582073 0.4776097 0.4847818 0.4882707 0.4901822 0.4913933 0.492356 0.494959
20 0.4181028 0.4582023 0.4778114 0.4848175 0.4882588 0.4902163 0.4915299 0.4924735 0.4951115
24 0.4180889 0.458117 0.4777843 0.4848366 0.4884579 0.4903359 0.4916836 0.4926392 0.4951786
28 0.4184057 0.4581116 0.4777275 0.4849683 0.4884933 0.490381 0.4916831 0.4926735 0.4952641
32 0.4183885 0.4581657 0.4777832 0.4849412 0.4884822 0.4904074 0.4917177 0.4926849 0.4952734
64 0.4178983 0.4580143 0.4776254 0.4848984 0.4884973 0.4904345 0.4917594 0.4927048 0.4953004
Table.2 Standard Deviation Of The Distribution Of Inter-Class Hamming Distance (HD) For Virus Temples Dimensions Of Enhance Hough Transform (EHT) Algorithm.
Template 40 80 120 160 200 240 280 320 512
4 0.0960017 0.0576695 0.0450875 0.0382505 0.0341377 0.0314694 0.029489 0.0277825 0.0233223
8 0.0859068 0.0497382 0.0375617 0.0305288 0.0263378 0.0237156 0.0220107 0.0206434 0.0169512
12 0.0834506 0.047539 0.0353555 0.0281495 0.0238323 0.0212788 0.0194153 0.0179613 0.0142629
16 0.0819662 0.0462883 0.0344286 0.0271719 0.0230019 0.020278 0.0184137 0.0169444 0.0132205
20 0.0813367 0.046126 0.0340106 0.0268617 0.022612 0.0198579 0.0179354 0.016434 0.0126886
24 0.0811449 0.0458844 0.0338782 0.0265917 0.0222747 0.0196563 0.0177272 0.0161978 0.0124419
28 0.0807498 0.0456144 0.0336982 0.0264416 0.022143 0.0195292 0.017621 0.0160895 0.0122888
32 0.0803634 0.0454988 0.0336166 0.0263546 0.0220951 0.0194228 0.0175283 0.0160262 0.0122102
ISSN: 1992-8645 www.jatit.org E-ISSN: 1817-3195
471
Table.3 Mean Of The Inter-Class Hamming Distance (HD) Distribution For Virus Temples Dimensions Of Geodesic Active Contour (GAC) Algorithm.
Template 40 80 120 160 200 240 280 320 512
4 0.4383742 0.4607714 0.4756571 0.4818299 0.4848205 0.4868127 0.4882012 0.4892962 0.492153
8 0.4405994 0.4630886 0.4779375 0.4844341 0.4876599 0.4894203 0.4905619 0.4915004 0.4939125
12 0.4398623 0.4631457 0.4783832 0.4850864 0.4882271 0.4899947 0.4912524 0.4920456 0.4944118
16 0.4397728 0.4397728 0.4787075 0.4851776 0.4882562 0.4900556 0.4912938 0.4921059 0.494506
20 0.4397675 0.4635619 0.478699 0.4851294 0.4882364 0.4899974 0.4912442 0.4921176 0.4944604
24 0.4400306 0.463647 0.4787878 0.4852939 0.4883491 0.4900957 0.4913215 0.4921815 0.4945813
28 0.4398761 0.4637845 0.4789503 0.485385 0.4884845 0.4902405 0.4914546 0.49232 0.4947112
32 0.4398213 0.4638622 0.4789034 0.4854452 0.4885486 0.4903 0.4915498 0.4924052 0.4947565
64 0.4398238 0.4638485 0.4789507 0.4854677 0.4885578 0.4903191 0.4915466 0.4923914 0.4947407
Table.4 Standard Deviation Of The Distribution Of The Inter-Class Hamming Distance (HD) For Virus Temples Dimensions Of Geodesic Active Contour (GAC) Algorithm.
Table.5 Degree Of Freedom Hamming Distance (HD) Distribution For Virus Temples Dimensions Of Enhance Hough Transform (EHT) Algorithm
Template 40 80 120 160 200 240 280 320 512
4 26 75 123 171 214 252 287 324 459
8 33 100 177 268 360 444 516 586 870
12 35 110 200 315 440 552 663 775 1229
16 36 116 210 338 472 608 737 871 1430
20 37 117 216 346 489 634 777 925 1553
24 37 118 217 353 504 647 795 953 1615
28 37 119 220 357 510 655 805 966 1655
32 38 120 221 360 512 662 813 973 1677
64 38 122 224 365 521 676 834 1001 1726
Table.6 Degree Of Freedom Hamming Distance (HD) Distribution For Virus Temples Dimensions Of Geodesic Active Contour (GAC) Algorithm
Template 40 80 120 160 200 240 280 320 512
4 34 84 139 198 256 307 354 398 557
8 41 107 187 278 374 472 560 638 967
12 42 111 199 302 413 530 639 733 1174
16 42 42 203 309 427 549 662 769 1250
20 42 113 205 312 430 555 671 783 1285
24 42 113 204 314 432 559 678 788 1301
28 42 113 206 314 435 563 682 793 1315
32 42 114 206 316 438 565 685 798 1323
64 43 114 208 319 442 570 693 806 1341
Template 40 80 120 160 200 240 280 320 512
4 0.085536 0.0542423 0.0424162 0.0354668 0.0312068 0.0285385 0.0265589 0.0250458 0.021174
8 0.0778993 0.0483002 0.0365561 0.0299606 0.0258437 0.0230055 0.0211257 0.0197848 0.0160789
12 0.0768517 0.0473484 0.0354299 0.0287445 0.0245965 0.0217049 0.0197835 0.0184603 0.0145919
16 0.0765867 0.0765867 0.0350601 0.0284184 0.0241994 0.0213302 0.019435 0.0180263 0.014139
20 0.0765781 0.0469994 0.0349169 0.0282903 0.0241107 0.0212186 0.0193022 0.0178671 0.0139462
24 0.0764693 0.0468907 0.0349343 0.0282196 0.0240364 0.0211527 0.0191953 0.017811 0.0138634
28 0.0763388 0.0468367 0.0348163 0.0281885 0.0239598 0.0210655 0.0191498 0.017753 0.0137866
32 0.0763122 0.0468089 0.0347656 0.02811 0.0238962 0.0210344 0.0191003 0.0176995 0.013746