3281
PROGRESSIVE LOAD EQUILIBRATING USING
HYBRIDIZED FA-CO IN DATA STREAM CLASSIFICATION
1
S. RAJESH KUMAR, DR. S. MURUGAPPAN2 1
Ph.D Research Scholar, Department of Computer Science, Bharathiar University , Coimbatore, Tamil Nadu, India
2
Associate Professor & Head, School of Computer Sciences, Tamil Nadu Open University, Chennai, Tamil Nadu, India
Email id: [email protected], [email protected]
ABSTRACT
Load Equilibration is the central attribute in the data stream classification. A huge amount of data is generated from the streams of data in real time applications such as set of transaction process, Intrusion Detection System and so on. A plethora of load equilibration techniques are available but not precised for global optima solutions. The paper re-searched on equilibrating the loads among the nodes. We proposed “Hybridized FA-CO” algorithm that highlights the features of best prediction of nodes for equilibrating the loads. The operators of a firefly are merged with phenomenon of ant system to heighten the generation of global optima solutions. The resources are assigned properly to its corresponding nodes. In data stream, the data is continuous. In data mining networks, the mining of nodes is of great importance. The paper deals with the prediction of nodes to keep up the loads. The continuous attributes like foretell value, foretell time and Rate of mining are used to keep up the loads. Rate of mining is the mining of nodes with least carrying loads. The experimentations are conducted on data mining networks and the performance validation is done. The result proves that the hybridized approach works efficiently for equilibrating the loads.
Keywords:Load Equilibration, Firefly Operators, Ant system, Rate of mining, Foretell Value and Foretell time.
1. INTRODUCTION
An information stream is a subsequent of unbounded, ongoing information things with a high information rate that can just read once by an application. Envision a satellite-mounted remote sensor that is continually producing information. The information are monstrous (e.g., terabytes in volume), transiently requested, rapid transformation and possibly endless [1]. These attributes cause issues related to the data stream field. Information Stream mining alludes to informational structure extraction as models and examples from continuous information streams. Deterministic algorithms are best suitable for the local search. Finding optimized solutions through swarm systems falls under the category of stochastic optimization into two groups heuristic and meta-heuristic. Heuristic means to detect the optimized solutions using trial and error scheme. The heuristic optimization scheme yields the solution but not optimized solution. When compared to the heuristic search, the metaheuristic works in randomization and local search.
Several swarm intelligence techniques were available which yields to provide optimized solutions for load equilibrating system. The purpose of load equilibrating is to lessen the load difference exists among the nodes. Load equilibrating also belongs to the problem of NP-Complete which use single processor to solve the issue; henceforth the advent of heuristics is difficult in real-time applications. Randomness is defined as the quality of exploring best search space solution in a sloppy manner. Several swarm intelligence techniques like Artificial Bee Colony (ABC), Cat Swarm Optimization (CSO), and Particle Swarm Optimization (PSO) etc [2]. In spite of all above mentioned techniques Firefly algorithm (FA) and Ant Colony Optimization (ACO) works efficiently in generating the optimized solutions in randomized manner.
3282 of Data Stream classification. We introduced “Hybridized Firefly- Ant Colony Optimization” algorithm which solves the issue of load imbalance among the data processors.
The paper is structured as follows: Section I depicts the advent of Swarm Intelligence and Load equilibrating in Data Stream classification, Section II depicts the various researchers researches on load equilibrating using swarm intelligence, Section III proposes a novel algorithm to solve the issue of progressive load balancing, Section IV justifies the proposed algorithm using various performance criteria and concluded in Section V. 2. LITERATURE SURVEY
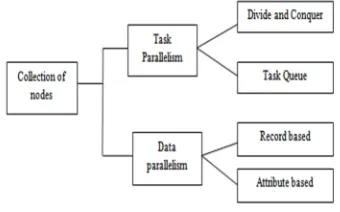
[image:2.612.102.272.590.696.2]Load Equilibrating is the central issue in the data stream classification. In data mining networks, the extraction of knowledge from trained nodes is used for suspecting the nodes with over load and under load processes. Load Equilibrating is divided into three categories namely Static load equilibrating, dynamic load equilibrating and Hybrid load equilibrating. Static load equilibrating is used for processing the known information. Each problem is subdivided into several tasks and each task is allocated to the processor before its execution. Dynamic Load equilibrating executed in distribution of loads without any information known prior. The study on dynamic load equilibrating is enhanced with loads of tasks such as sharing of resources, scheduling of resources, and migration of tasks etc using Multiple Instruction Multiple Data (MIMD) processors. In order to cope up with efficiency, the load imbalance should detect earlier than any misuse occurs. In parallel data mining process, the node information is extracted and mined together to predict the flow of upcoming nodes. The generalized parallel data mining is architectured as:
Figure. 1 Workflow of Parallel Data mining process
The techniques available in data mining process were listed as:
2.1 Decision Trees
3283
Table 1. Comparison of Decision Tree algorithm.
Algorith ms
Pruning Methodolo gy
Informati on metric
ID3
Pre-pruning using a single pass algorith m
Top-down decision tree constructio n
Entropy info-gain
CART Post pruning based on cost complexi ty measure
Constructs binary decision tree
Gini diversity index
C4.5
Pre-pruning using a single pass algorith m
Top-down decision tree constructio n
Entropy info-gain
SPRINT Post-pruning based on MDL principle
Decision tree constructio n in a breadth first manner
Gini index
2.2 Genetic Algorithms
A genetic algorithm belongs to the class of evolutionary process. It is widely used for optimization process. The genetic operators are combination, mutation and selection are used as the design and hunting parameters. Randomness is the main parameter used in the evolutionary process. The initial population is generated that depicted the optimized solutions using the produced chromosomes. Every new solution is validated by their mechanics of natural selection and mutation process. The types of algorithms were: Genetic Algorithms (GA), Genetic Programming (GP), Evolution Strategies (ES) and Evolutionary Programming (EP). The main difference is the way of encoding process. GA uses the chromosomes which encoded as Zeros and Ones to generate good solutions. The best populations are selected from the precised fitness solutions.
In clustering process, the genetic algorithm is used for the analysis of potential feasibility of genetic operators [10]. A hybrid genetic algorithm is developed by [11], to create optimal solution for given portioned data. The hybridized GA incurs a lot of time and cost complexity. This is solved by Genetic K-means algorithm. The crossover search operator replaced with K-mean operator. Then the distance-based mutation is proposed to cluster the loads of nodes in equilibrated state [12]. Another method Fast Genetic K-means Algorithm (FGKA) is introduced to produce optimal solutions that converges local and global optimal solutions. It executed faster than the GKA. Incremental Genetic K-means Algorithm (IGKA) is used for generating a least mutation probability. The concept of IKGA is to define an objective value within a cluster. The mean of cluster is incremented in case of small mutation value [13].
3284 2.3 Nearest Neighborhood Method
Nearest Neighborhood method is the method used in a dataset, contain the classes similar to the cluster center and its neighbor. K is an anonymity that includes the neighbors closest to the subsets. In nearest neighbor algorithm, each task is allocated to its specified processor. The task is scheduled based on k-nearest neighbor algorithms. The closest value is predicted for upcoming task scheduling system. The nodes in the network are aggregated and collected the details of the nodes. By these collected information, the immediate neighbors are known with prior information that which nodes should processed in future events. Each system with proper load is maintained. The nearest neighbor method is categorized into two methods namely, diffusion method and dimension exchange method. In diffusion method, the aid of load equilibrating operations is used for differentiating the high or low loaded processors. In dimension exchange, a new index is created for every load in a processor.
The well-known two fundamental communication models are all-port and one-port models. The port model communicates with its processors through all nodes and its neighbors in the network whereas the one-port model utilizes nodes with the closest neighbor at a time. In an asynchronous way of load equilibrating system, processors perform load equilibrating operations discretely taking into account their own neighborhood workload appropriations and summon the load approaches. Since load equilibrating estimations can be dealt with as orthogonal to their summon policies, they consider the load adjusting operations of processors in one time step in order to disengage their consequences for the framework. They concentrated on the static load adjusting in which the estimation in a processor is suspended while the processor is performing load equilibrating operations [20].
Another approach is metric-space query processing in distributed manner. The query processing is handled using four approaches. Each data is processed with unique local indexing in equal distribution on P processors. In first step, the query is processed over all the processors and extracts top k results. In second step, the processors are individually visited to check down whether any alter the best top k queries is available that lessened the resultant
queries. In third step, sends the queries to f < P processors and decides the best results among the f · k results gathered from those processors. At that point, the other P − f processors are reached to figure out if they can create better results than the current global top-k ones for the queries. The fourth technique performs cycles by asking from every processor top k/P results in every cycle. As database items are disseminated aimlessly, there is a high likelihood that the global top-k results will be resolved in couple of cycles. The work in [21] was reached out in [22] that enhanced the indexing structure in clustering. From various studies, it is concluded that global indexing performed better than local indexing. The global indexing lessened the number of aggregate processor per queries. Global indexing alludes to a solitary list that is developed by considering the entire arrangement of database items and the records are distributed equally. The major drawback in global indexing is the improper balance of the load among the processors.
The work in [23] proposes unraveling imbalance of global indexing with disconnected from the index onto processors. The algorithmic complexity is discovered as O (n2). In [23], an online query scheduling is found. The task in [24] proposed “Scheduling the least processor nodes” using global indexing. Load equilibrating among different improvements for multidimensional indexing in shared (P2P) frameworks have been thoroughly audited in [25]. As to parity, P2P frameworks, there are methodologies based on information replication [26], namespace equilibrating [27], virtual servers [28], migration of nodes [29], different hash capacities [30], path replication [31], lookup parity [32] and reliable hashing based systems like in [33]. The other works in P2P metric spaces has been introduced in [34], [35], [36], [37]. Additionally in [38] there is work that considers moving information around processors to adjust workload. Then again, there are metric space calculations created for shared memory frameworks [39] and GPU frameworks [40].
3. PROPOSED HYBRID FA_ACO
3.1 Motivation
3285 benefits out high resource utilization and better response time. When any labeled data hits the processors, the loads among the nodes are established and organized. If the nodes are labeled and organized in the data mining networks, the challenge exists in which nodes should be processed in future to eliminate the states of loads such as over-load, under-load and equilibrate. The research on heuristic based techniques is still unclear and very few literatures related to the topic, undefined solutions on generating the effective and valid data stream mining results and lack of versatility and attribute heterogeneity. This fabulous challenge motivates us to delve into the study on load equilibration in data stream classification.
3.2 PROPOSED HYBRID FA-CO
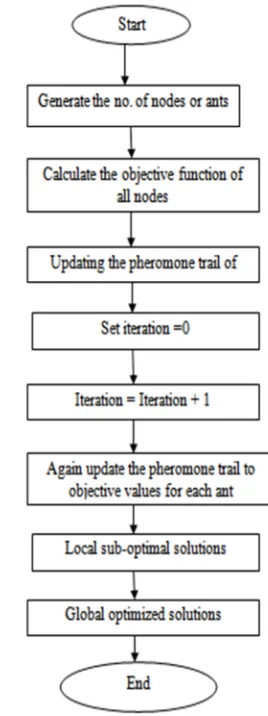
[image:5.612.354.488.107.465.2]Hybrid algorithm is nominated to figure out the tractable optimization problem by incorporating the Firefly algorithm and Ant Colony Optimization. The evolutionary process of Ant Colony Algorithm accommodates the firefly operations to heighten the movement of ants towards an optimal solution state. The algorithm converges to generate optimal final solution, by accumulating the most effective sub-solutions. The aim of streaming of dynamic nodes in the cluster form is to lessen the higher execution time. In parallel processing, forecasting the execution time and its “Rate of Mining” is quite intriguing complex task. For every node in the data mining networks, the ‘Rate of Mining’ pertains to the size of streams computed in a unit of time. The general architecture of Ant Colony Optimization (ACO) is presented as:
Figure 2. General Architecture
Hybrid FA-CO
Consider a data stream D of continuous data nodes {di…..di+1} with n- dimensional feature vector. Here, di is the first node in the stream and di+1 is the present data node that is newly arrived. The proposed steps are as follows:
i) Generate the number of nodes or population N.
3286
Positivity: The distance between two data points is a nonnegative real number. Let X be the set of data points which contains a stream of data as its subsets a and b. The distance from a point to itself is zero. In formal, it is signified as:
( , )
0
d a b
≥
andd a a
( , )
=
0
(3.1)Differentiation: The distance between two different points should be strictly positive. In formal, it is signified as:
( , b)
0
d a
= ⇒
a
=
b
(3.2)Equilibrium: When the distance from point a to point b or vice versa is found as similar, then it is signified as:
( a , b )
d ( b , a )
d
=
(3.3)Let a and b be the two ants. The distance between two ants is given as ai and bj.
2 ,n ,n 1
(
)
i j
d
a b n i j
r
a
b
=
=
∑
−
(3.4)
Where d is the number of population, ai, n is the nth component of plane coordinate ai.
iii) Updating the pheromone trail of ants Based on the output of the distance operator, the pheromone updation is done. The presumed firefly conditions are:
a) All nodes will be attracted by other nodes regardless of their decisional parameters. b) The communication between nodes is limited to hundred meters. Attractiveness is proportional to their brightness. The decisional parameters (attraction attributes) of a node is directly proportional to their system utilization.
c) The amount of flashing pattern decreases when the distance increases. Equilibrating Index (EI) is the prime factor that cramp upon the load
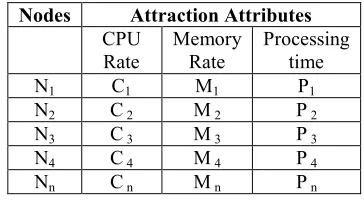
[image:6.612.331.513.228.330.2]equilibrating process. Before entering into the EI calculation, let us discuss about the decisional parameters for the initial nodes (or) population. In accord to Firefly algorithm, there should an attraction between the nodes. The similarities contained by node to the incoming request will a cause for attraction between nodes. The attributes listed as follows:
Table 2: List Of Nodes And Its Attraction Attributes
Nodes Attraction Attributes CPU
Rate
Memory Rate
Processing time
N1 C1 M1 P1
N2 C 2 M 2 P 2
N3 C 3 M 3 P 3
N4 C 4 M 4 P 4
Nn C n M n P n
Attraction attributes is estimated for the initial nodes as:
0
i
i i
p
c m
β =
+
(3.5)
Where
β
0 is the initial estimation of the nodes;pi is the processing time of ith component of a node; Ci is the CPU rate of ith component of a node and mi is the memory rate of i
th
component of a node. The attraction based pheromone updation is given as:
0 1
( )
dn rmBI
β
β
e
−γ=
=
∑
∀
all nodes n (3.6)3287
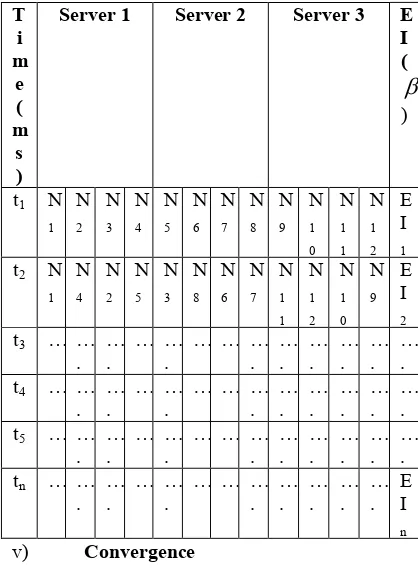
Table 3: List of updated Equilibrating Index (EI)
The updated equilibrating index is presented in the Table 2. The updated equilibrating index is calculated in such a way that the nodes with the highest equilibrating index will be listed at the top of the list. The next step is the mining of least load carrying nodes to generate the local optimized sub-effective solutions.
iv) Mining of nodes with least loads
The computation of mining the nodes with least loads is achieved using “Rate of mining” operator of the firefly algorithm. The node with least load value attracts towards another node with least load value as per the definitions of firefly algorithm. At first, forecasting the values of next processes among the computing nodes. Second is to forecast and update the computing nodes which are called as “Rate of Mining”.
Table 4: Parameters Definition
Tsize - Size of the task.
Init_foretell_val (i, j, Tk) – Forecasted time of task processing j at node i in the time k.
NextForetell_val (i, j, Tk+1) - Successor forecasted value of task processing j at node i in the time k +1.
Actual_ time (i, j, Tk) - Actual observed time at node i in the time k.
The processing value of the next node is computed as per the formula:
NextForetell_val (i, j, Tk+1) =
[Tsize * Init_foretell_val (i, j, Tk)] / Tot.no.of processing nodes with least loads (3.7) The forecasted time of the next processing of node is computed as:
NextForetell_time (i, j, Tk+1) = NextForetell_val (i, j, Tk+1) / Actual_ time (i, j, Tk) (3.8)
Rate of mining is computed as:
[image:7.612.318.527.327.611.2][NextForetell_val (i, j, Tk+1) / NextForetell_time (i, j, Tk+1)] *100 % (3.9)
Table 5: List of mining the nodes with least loads
v) Convergence
The rule of convergence is the n>>m which signifies n is the number of nodes and m is the value of local optimal of an optimization problem. Here, the location of n nodes is scattered uniformly and as the iteration of the algorithm increases, the subset solutions from the local optima is converged. By comparing the best solutions among all these optima, the global optima are achieved.
Serv er ID Tsi ze NextForetel l_val (i, j, Tk+1)
NextForetell _time (i, j, Tk+1)
Rate of Mini ng ( %)
S1 T1 NV1 NT1 RM
% S2 … .. …… ……. ….. S3 … .. …… ……. ….. Sn … .. …… ……. ….. T i m e ( m s )
Server 1 Server 2 Server 3 E I (
β
)
t1 N 1 N 2 N 3 N 4 N 5 N 6 N 7 N 8 N 9 N 1 0 N 1 1 N 1 2 E I 1 t2 N
1 N 4 N 2 N 5 N 3 N 8 N 6 N 7 N 1 1 N 1 2 N 1 0 N 9 E I 2 t3 … …
. … . … … . … … … . … . … . … . … . … . t4 … …
. … . … … . … … … . … . … . … . … . … . t5 … …
. … . … … . … … … . … . … . … . … . … . tn … …
3288
Figure 3. Proposed Workflow of hybrid FA-ACO
Table 5: List of mining the nodes with least loads
No.of nodes Loads of users
% RAM free
% CPU free
Processing time (milliseconds ms)
Location-oriented Server Distribution
Node 1 40 20 30 1 Server 1
Node 2 40 10 30 1 Server 1
Node 3 40 20 30 1 Server 1
Node 4 40 50 30 1 Server 1
Node 5 40 10 30 1 Server 2
Node 6 40 20 30 1 Server 2
Node 7 40 40 30 1 Server 2
Node 8 40 30 30 1 Server 2
Node 9 40 10 30 1 Server 3
Node 10 40 30 30 1 Server 3
Node 11 40 20 30 1 Server 3
[image:8.612.86.537.439.677.2]3289
4. EXPERIMENTAL RESULTS AND
ANALYSIS
The proposed load equilibrating algorithm is developed based on Ant Colony Optimization and Firefly algorithm in optimizing the load to process the requests in Data mining networks. The target of the proposed approach is to produce the globalized optimal load balance over data mining networks in the progressive data environment. In order to evaluate the proposed technique, experiments were conducted using Java applications with 12 Nodes (Firefly) and 3 Servers (Ants) running on core i5 processor, 4GB RAM and 500 HDD.
4.1 Validation Measures
The prime validation measures used in the proposed load equilibrating scheme over data mining networks is the time taken for running an efficient load queue. The attractive decisional parameters considered were CPU rate, Memory utilized rate, Processing time, Size of task, Forecasted value, Forecasted time and Rate of Mining. The time is estimated on the adaptive requirement of time taken by the system for an effective load equilibrating process. The nodes (Firefly) are adaptive i.e if the environment set up alters, the nodes (firefly) will search for a better solution. In data mining networks, the mining of knowledge between nodes is of great
importance.
4.2 Performance Validation
Below mentioned tables and figures illustrates how well we extracts the knowledge from simulated data mining networks.
Table 6. Assumption Table for load statistics on Nodes
Figure 4. Interpretation chart for load statistics on Nodes
[image:9.612.344.504.361.711.2]Table. 6 & Figure 3 depict the Assumption table and its Interpretation chart for load statistics on Nodes.
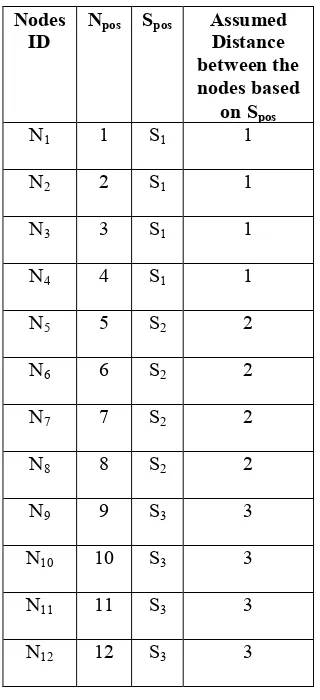
Table 7. Estimating the objective function using Distance operator
Nodes ID
Npos Spos Assumed
Distance between the nodes based
on Spos
N1 1 S1 1
N2 2 S1 1
N3 3 S1 1
N4 4 S1 1
N5 5 S2 2
N6 6 S2 2
N7 7 S2 2
N8 8 S2 2
N9 9 S3 3
N10 10 S3 3
N11 11 S3 3
N12 12 S3 3
0 20 40 60 80
N1 N4
N7 N10
% CPU free
3290 Table 7 depicts the estimation of Distance value for the assumed 3 servers and 12 nodes. Before estimating the distance value, it is worth important that how many possible interactions among the nodes and its servers take place should studied. While putting the combination statistics among the nodes and its servers, there is a chance of 220 ways of interaction between the nodes and its servers. The one possible order is:
S1= {1,2,3,4 } ; S2= {9,5,7,12}; S3= { 6,8,10,11}.
For S1, the combination of the nodes are (1,2) (1,3) (1,4) (2,3) (2,4) (3,4). Then the distance value is computed as:
1
2
(1 2 3 1 2 1) 10
S
r = + + + + + =
From this, it is predicted that the distance between the nodes are placed 10m. Similarly, the other Server 2 and 3 is computed.
Table 8. Estimating the Equilibrating Index (EI) (Organized set of nodes)
Nod es
Rate of Memo
ry (mi)
Rat e of CP
U (ci)
Processi ng time (pi) (ms)
0
β
EI (β
)N1 20 30 1 0.02
0
0.00 73
N2 10 30 1 0.02
5
0.00 92
N3 5 30 1 0.02
8
0.01 03
N4 50 30 1 0.01
2
0.00 44
N9 15 30 1 0.02
2
0.00 80
N5 25 30 1 0.01
8
0.00 66
N7 45 30 1 0.01
3
0.00 47
N12 40 30 1 0.01
4
0.00 51
N6 55 30 1 0.01
1
0.00 40
N8 65 30 1 0.01
05 0.00
38
N10 60 30 1 0.01
1
0.00 40
N11 70 30 1 0.01 0.00
0 36
3291
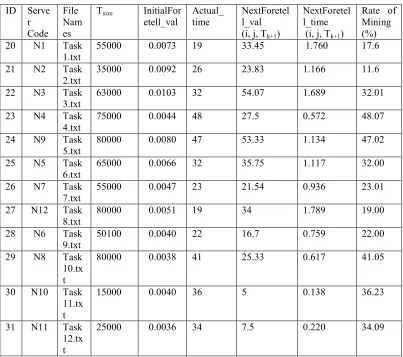
Table 9. Mining of nodes
ID Serve r Code
File Nam es
Tsize InitialFor etell_val
Actual_ time
NextForetel l_val (i, j, Tk+1)
NextForetel l_time (i, j, Tk+1)
Rate of Mining (%)
20 N1 Task
1.txt
55000 0.0073 19 33.45 1.760 17.6
21 N2 Task
2.txt
35000 0.0092 26 23.83 1.166 11.6
22 N3 Task
3.txt
63000 0.0103 32 54.07 1.689 32.01
23 N4 Task
4.txt
75000 0.0044 48 27.5 0.572 48.07
24 N9 Task
5.txt
80000 0.0080 47 53.33 1.134 47.02
25 N5 Task
6.txt
65000 0.0066 32 35.75 1.117 32.00
26 N7 Task
7.txt
55000 0.0047 23 21.54 0.936 23.01
27 N12 Task 8.txt
80000 0.0051 19 34 1.789 19.00
28 N6 Task
9.txt
50100 0.0040 22 16.7 0.759 22.00
29 N8 Task
10.tx t
80000 0.0038 41 25.33 0.617 41.05
30 N10 Task 11.tx t
15000 0.0040 36 5 0.138 36.23
31 N11 Task 12.tx t
25000 0.0036 34 7.5 0.220 34.09
Motivated from the firefly theory, the least distinct firefly exhibits similar characteristics. From the Table 9, the metric NextForetell_val (i, j, Tk+1) and NextForetell_time (i, j, Tk+1) will predict the value and time for node to occur in next level. The metric “Rate of Mining” outputs Nodes 3 & 5 contain same value and the Nodes 8, 10 & 11 that depicts nodes are equilibrated. The nodes 1, 2, 6 & 7 are underload. The nodes 4 & 9 are overload. Thus, the nodes with load imbalance are successfully solved in predictive approach.
5.
CONCLUSION
In this study, we proposed “hybridized FA-CO” algorithm that suggests predicting the nodes for equilibrating the loads. Load imbalance is the centre issue in the data stream classification. The hybridized approach investigates with a simulated data mining
3292 it can also be re-searched with combination of other swarm intelligence techniques.
REFERENCES:
[1] M. Sukanya, S. Biruntha, Dr. S. Karthik and T.Kalaikumaran “Data mining: Performance Improvement in Education Sector using Classification and Clustering Algorithm”, International conference on computing and
control engineering (ICCCE 2012) 12 & 13
April, 2012.
[2] L. Breiman, J.H. Freidman, R. A. Olshen and C.J Stone, “Classification and Regression trees, Wadsworth, Belmont, CA, 1984. [3] S.Anupama Kumar and Dr. Vijayalakshmi
M.N. “Efficiency of decision trees in predicting student’s academic performance”, D.C. Wyld, et al. (Eds): CCSEA 2011, CS & IT 02, pp. 335-343, 2011.
[4] J.R. QUINLAN, Induction of Decision Trees, 1986, Machine Learning 1:81-106
[5] Tarun Verma, Sweety raj, Mohammad Asif khan, Palak modi (2012) “Literacy Rate Analysis”, International journal of science
& engineering research, 3 (7), ISSN
2229-5518.
[6] Anju Rathee, “Survey on decision tree classification algorithms for the evaluation of the student performance”, International
Journal on Communication Technologies, 4
(2), 2013.
[7] Devi Prasad bhukya and S. Ramachandram, “Decision tree induction- An Approach for data
classification using AVL –Tree”, International journal of computer and
electrical engineering, 2(4), 2012.
[8] John C. Shafer, Rakesh Agrawal, and Manish Mehta. SPRINT: A scalable parallel classifier for data mining, Research report,
IBM Almaden Research Center, San Jose,
California, 1996.
[9] Sunita B aher, Mr. LOBO L.M.R.J, “Data mining in educational system using weka tool”, International conference on emerging technology trends (ICETT), 2011.
[10] Krovi, R, “Genetic algorithms for clustering: a preliminary investigation”, System Sciences, Proceedings of the
Twenty- Fifth Hawaii International
Conference, pp. 540-544, 1992.
[11] K. Krishna and M. N. Murty, ”Genetic K-Means Algorithm”, IEEE Transaction On Systems, Man, And Cybernetics—Part B:
CYBERNETICS, 29 (3), June 1999.
[13] U. Maulik, S. Bandyopadhyay,” Genetic algorithm-based clustering technique”,
Pattern Recognition, 33 (1), 2000.
[14] Hall, L.O., Ozyurt I. B., and Bezdek, J.C, ”Clustering with a genetically optimized approach”. IEEE Transaction on
Evolutionary Computation, 1999
[15] Davis, D. L. and Bouldin, D. W., “A Cluster Separation Measure,” IEEE Transaction
Pattern Analysis and Machine Intelligence,
1(1), pp. 224-227,1979.
[16] Bezdek, J. C., “Some New Indexes of Cluster Validity,” IEEE Transactions Systems, Man, and Cybernetics - Part B, 2013
[17] Bandyopadhyay, S. and Maulik, U., “Genetic Clustering for Automatic Evolution of Clusters and Application to
Image Classification”,
PatternRecognition,35(11), 2002.
[18] Li Jie, G. Xinbo, “A GA-Based Clustering Algorithm for Large Data Sets With Mixed Numeric and Categorical Values”, IEEE, Proceedings of the Fifth International Conference on Computational Intelligence and Multimedia Applications (ICCIMA’03), 2003
[19] Y. Liu, Kefe and X. Liz,” A Hybrid Genetic Based Clustering Algorithm”, Proceedings of the Third International Conference on
Machine Leaming and Cybernetics,
Shanghai, 2004.
[20] B. Ghosh and S. Muthukrishnan. Dynamic load balancing in distributed networks by random matching’s. In Proceedings of 6th ACM Symposium on Parallel Algorithms
and Architectures, 1994.
[21] Papadopoulos, A., Manolopoulos, Y.: Distributed processing of similarity queries.
Distributed and Parallel Databases, 9(1),
2001.
[22] Gil-Costa, V., Marin, M., Reyes, N.: Parallel query processing on distributed clustering indexes”, Journal of Discrete
Algorithms, 7(1), 2009.
[23] Marin, M., Ferrarotti, F., Gil-Costa, V.: Distributing a metric- space search index onto processors. In: ICPP. pp. 13–16, 2010. [24] Moffat, A., Webber, W., Zobel, J., “Load
balancing for term- distributed parallel retrieval. In: SIGIR. pp. 348–355 (2006). [25] Zhang C., Xiao W., Tang D., Tang J.:
3293 [26] Pitoura T., Ntarmos N., Trianta llou P.:
Replication, Load Balancing and Efficient Range Query Processing in DHTs. In: EDBT pp. 131–148 (2006).
[27] Naor M., Wieder U.: Novel architectures for p2p applications: the continuous-discrete approach. In: SPAA pp. 50–59, 2003. [28] Zhu Y., Hu Y.: Efficient, proximity-aware
load balancing for DHT-based p2p systems. IEEE Trans. Parallel Distrib. Syst., 16 pp. 349–361, 2005.
[29] Giakkoupis G., Hadzilacos V.: A scheme for load balancing in heterogeneous distributed hash tables. In: PODC, pp 302– 311, 2005.
[30] Bauer D., Hurley P., Waldvogel M.: Replica placement and location using distributed hash tables. In: LCN, pp. 315–324, 2007. [31] Bianchi S., Serbu S., Felber P., Kropf P.:
Adaptive load balancing for DHT lookups.
In ICCCN, pp. 411–418, 2006.
[32] Chen Z., Huang G., Xu J., Yang Y. Adaptive load balancing for lookups in heterogeneous DHT. In: EUC, pp. 513–518, 2008.
[33] Raiciu, C., Huici, F., Rosenblum, D.S., Handley, M.: ROAR, “Increasing the flexibility and performance of distributed search”, In: SIGCOMM, 2009.
[34] Marin, M., Gil-Costa, V., Hern´andez, C.: “Dynamic p2p indexing and search based on compact clustering”, In: SISAP. pp. 124– 131, 2009.
[35] Novak, D., Batko, M., Zezula, P., “Metric index: An efficient and scalable solution for precise and approximate similarity search”, IEEE transaction on information systems, 36(4), 2011.
[36] Doulkeridis, C., Vlachou, A., Kotidis, Y., Vazirgiannis, M., “Peer-to-peer similarity search in metric spaces”,. In: VLDB, 2007. [37] Yuan, Y., Wang, G., Sun, Y, “Efficient
peer-to-peer similarity query processing for high-dimensional data”, In: Asia-Pacific
Web Conference, 2010.
[38] Catalyurek, U.V., Boman, E.G., Devine, K.D., Bozda˘g, D., Heaphy, R.T., Riesen, L.A.: “A repartitioning hypergraph model for dynamic load balancing”, Journal of
Parallel Distributing computing, 2009.
[39] Gil-Costa, V., Barrientos, R., Marin, M., Bonacic, C., ”Scheduling metric-space queries processing on multi-core processors”, In: PDP, 2010.
[40] Barrientos, R.J., G´omez, J.I., Tenllado, C., Prieto-Mat´ıas, M., Mar´ın, M. “k-NN query processing in metric spaces using GPUs”,