0095-1137/07/$08.00
⫹
0
doi:10.1128/JCM.02107-06
Copyright © 2007, American Society for Microbiology. All Rights Reserved.
Assessment of Use of Microsatellite Polymorphism Analysis for
Improving Spatial Distribution Tracking of
Echinococcus multilocularis
䌤
J. Knapp,
1,2* J. M. Bart,
2M. L. Glowatzki,
3A. Ito,
4S. Gerard,
2S. Maillard,
2R. Piarroux,
2and B. Gottstein
1Institute of Parasitology, Vetsuisse Faculty, University of Bern, Bern, Switzerland
1; Parasitology Department, SERF Team
(Equipe Sante´ Environnement Rural Franche-Comte´), Faculty of Medicine, University of Franche-Comte´, Besanc¸on,
France
2; Department of Clinical Research, Vetsuisse Faculty, University of Bern, Bern, Switzerland
3; and
Department of Parasitology, Asahikawa Medical College, Asahikawa, Hokkaido, Japan
4Received 13 October 2006/Returned for modification 1 January 2007/Accepted 6 July 2007
Alveolar echinococcosis (AE)—caused by the cestode
Echinococcus multilocularis
—is a severe zoonotic
dis-ease found in temperate and arctic regions of the northern hemisphere. Even though the transmission patterns
observed in different geographical areas are heterogeneous, the nuclear and mitochondrial targets usually used
for the genotyping of
E. multilocularis
have shown only a marked genetic homogeneity in this species. We used
microsatellite sequences, because of their high typing resolution, to explore the genetic diversity of
E.
mul-tilocularis
. Four microsatellite targets (EmsJ, EmsK, and EmsB, which were designed in our laboratory, and
NAK1, selected from the literature) were tested on a panel of 76
E. multilocularis
samples (larval and adult
stages) obtained from Alaska, Canada, Europe, and Asia. Genetic diversity for each target was assessed by size
polymorphism analysis. With the EmsJ and EmsK targets, two alleles were found for each locus, yielding two
and three genotypes, respectively, discriminating European isolates from the other groups. With NAK1, five
alleles were found, yielding seven genotypes, including those specific to Tibetan and Alaskan isolates. The
EmsB target, a tandem repeated multilocus microsatellite, found 17 alleles showing a complex pattern.
Hierarchical clustering analyses were performed with the EmsB findings, and 29 genotypes were identified. Due
to its higher genetic polymorphism, EmsB exhibited a higher discriminatory power than the other targets. The
complex EmsB pattern was able to discriminate isolates on a regional and sectoral level, while avoiding
overdistinction. EmsB will be used to assess the putative emergence of
E. multilocularis
in Europe.
Echinococcus multilocularis
is the causative agent of alveolar
echinococcosis (AE), a parasitic infection of humans that can
be lethal if not appropriately treated. In nature this zoonosis
involves different mammalian hosts: carnivores (in Europe
mainly foxes [
Vulpes vulpes
], dogs [
Canis lupus familiaris
], and
raccoon dogs [
Nyctereutes procyonoides
]) act as definitive hosts
(32), and a wide spectrum of rodents are intermediate hosts
(34). Humans who are accidentally infected serve as
interme-diate hosts and may develop AE after a long incubation period
(8, 33). Nonhuman primates, such as zoo gorillas (
Gorilla
spp.)
or macaque monkeys (
Macaca
spp.) can also serve as aberrant
intermediate hosts (7, 13, 25). The geographical distribution of
the parasite includes large parts of the northern hemisphere:
China, Central Asia (12), Hokkaido in Japan (20), Central and
Eastern Europe (21, 23, 26, 34), and some parts of North
America (14, 27). The extent of both infection and spatial
distribution depends on different factors, for example, (i) the
probability of a parasite-host encounter (encounter iris),
de-pending on the density of susceptible rodents and carnivores
and the human activities and behavior, and (ii) the balance
between the immune evasion capacity of the parasite and the
host immune response (compatibility iris) (11). This
interac-tion implies a host-parasite arms race that may depend not
only on the genetic polymorphism of the host (11, 15, 16)
among other components but also on the genetic
polymor-phism of the parasite. For
E. multilocularis
, few genetic
differ-ences among isolates have been observed with classical nuclear
and mitochondrial targets (18).
E. multilocularis
has shown a
variability of at least 10 times less than that of
Echinococcus
granulosus
, the causative agent of cystic hydatidosis (5, 6, 18).
The use of more sensitive tools such as
microsatellites—frag-ments of nuclear DNA composed of 1 to 6 bp tandemly
re-peated—might provide more information about parasite DNA
polymorphism; they are already used for genotyping and
spa-tial distribution studies for other species of parasites, such as
Leishmania infantum
(10). They could help to better identify
the spatial-temporal characteristics of the
E. multilocularis
transmission pattern (3). Analyses performed on the spacers of
the U1snRNA gene have shown three distinct genetic profiles
for European, North American, and Japanese isolates, but no
variability between individual samples of the respective foci
has been found (9). A Japanese team documented differences
in an adult worm panel collected from Hokkaido Island, but no
relationship between this sample panel and geographical
po-sition was demonstrated (22). These two publications
high-lighted the importance of microsatellite analyses in the
explo-ration of the genetic diversity of
E. multilocularis
. Recently, our
collaborative laboratory investigation identified 17
microsatel-* Corresponding author. Mailing address: Parasitology Department,
SERF Team, Faculty of Medicine, University of Franche-Comte
´, 19
rue Ambroise Pare
´, 25000 Besanc¸on, France. Phone: 00 33 3 63 08 22
36. Fax: 00 33 3 63 08 22 32. E-mail: [email protected].
䌤
Published ahead of print on 18 July 2007.
2943
on May 16, 2020 by guest
http://jcm.asm.org/
lite targets (4). EmsB, a tandem repeated multilocus
microsat-ellite, was identified and characterized. This microsatellite not
only clearly demonstrated a high discriminatory power by
iden-tifying samples from different geographical origins (Alaska and
Europe) but it also found several similar clusters within the
European collection of isolates (4).
In the present investigation, in which the genetic
polymor-phism of
E. multilocularis
isolates from Europe, Alaska, China,
and Japan was studied, we compared the relevance of four
different microsatellite targets. Three of them were taken from
a previous work by Bart et al., published in 2006 (4), and a
microsatellite sequence published by Nakao et al. in 2003 was
used as an independent marker (22).
MATERIALS AND METHODS
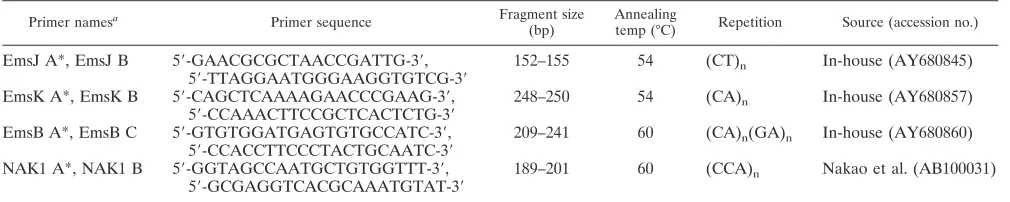
Selection of microsatellite targets.We selected our microsatellite targets from a series of 17 microsatellites published by Bart et al. in 2006 (4). In that study, by using amplification and fragment size analyses, microsatellites were isolated from
E. granulosusin order to select markers which would show variations betweenE. granulosusandE. multilocularis. TwoE. granulosusstrains were initially tested: an Algerian sheep (strain G1) and a Mauritanian camel (strain G6) isolate; the
E. multilocularisSwiss isolate CH5-h (shown in Table 2 of the present study) was also included. Seven microsatellites were subsequently selected and tested on 10
E. multilocularis isolates: CH1-h, CH5-h, 32A-h, 33F-h, 36CH-h, 39CH-h, 40CH-h, 41CH-h, SL1-h, and CND-r (included in Table 2 of the present study). For our study, we selected the three most polymorphic targets: EmsJ (GenBank accession no. GbR AY680845), EmsK (GbR AY680857), and EmsB (GbR AY680860). We also selected an additional independent target, NAK1, from a work published by Nakao et al. (target originally named EMms1; GbR AB100031) (22). For each of the four defined genomic regions, specific primers were designed with Primer3 software (http://frodo.wi.mit.edu/cgi-bin/primer3 /primer3_www.cgi). The respective characteristics are summarized in Table 1.
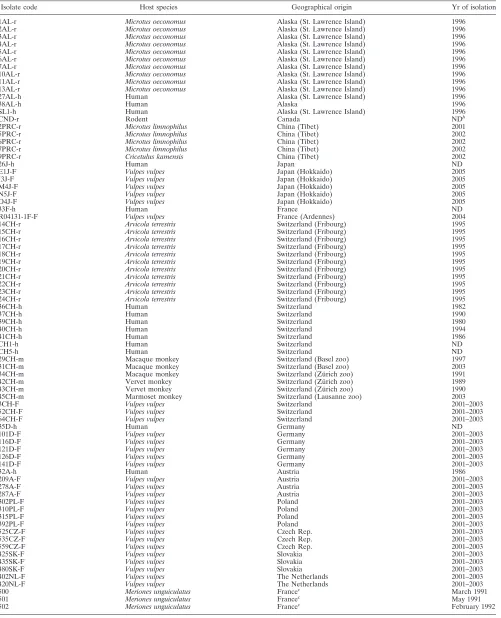
E. multilocularisisolates.The panel of 76E. multilocularisisolates was com-posed of purified single adult-stage worms obtained from definitive hosts and hepatic metacestode tissue material, which was obtained from intermediate hosts. The adult worms (29 isolates) were taken after necropsies of red foxes; their geographic origins are specified in Table 2. In the metacestode collection (47 isolates), 14 samples were from Alaska and Canada, including 10 specimens
obtained in 1995 fromMicrotus oeconomusoriginating from a field (of about
100 m by 100 m) just outside of Savoonga, Saint Lawrence Island, Alaska. These particular samples were collected within a period of 3 days. Twenty-four samples
were from Switzerland, among them 11 specimens obtained fromArvicola
ter-restris, all caught in a field (of about 500 m by 500 m) in the Canton of Fribourg over a 1-month period in 1994. Five metacestode tissue samples were isolated fromMicrotus limnophilusandCricetulus kamensis, caught in an area of 50 km2
in the vicinity of Tuan-Jie, a city located on the eastern Tibetan plateau (Shiqu County in Western Sichuan, China). Sampling was carried out in July 2001 for sample 2PRC-r and in July 2002 for the other Chinese samples. Fourteen sam-ples were obtained from human AE patients residing in Japan, Alaska, Austria, Switzerland, France, and Germany. Six parasitic lesions were collected from monkeys in Swiss zoos, probably occurring after the animals were fed contami-nated grass, mowed close to the zoo.
DNA extraction, PCR, and size polymorphism analysis.Total genomic DNA was isolated and purified from approximately 50 mg of each of the 47 parasite metacestode tissue samples and from the 29 single adult-stage worm samples, using a DNA Easy tissue kit (QIAGEN, Switzerland). The procedure was carried out according to the manufacturer’s protocol. Purified DNA was eluted with 200
l of elution buffer (provided by the manufacturer) for metacestode samples and
50l for adult worms, in order to obtain optimal DNA concentrations. The DNA
concentrations were checked with a spectrophotometer apparatus (BioPhotom-eter; Eppendorf AG, Hamburg, Germany). The DNA samples were then stored
at⫺20°C until use for PCR. Reproducibility of results was checked by
perform-ing PCR and fragment analysis in two different laboratories: one in Bern (Swit-zerland) and the other one in Besanc¸on (France). Amplification by PCR was
performed in a 30-l reaction mixture containing 50 to 100 ng of DNA, 200M
of each deoxynucleoside triphosphate (GeneAmp dNTPs; Applied Biosystems,
Foster City, CA), 0.4M of fluorescent forward primer, 5⬘-labeled specific
fluorescence dye, 0.7M of classical reverse primers, and 0.5 U of AmpliTaq
DNA polymerase enzyme associated with GeneAmp 1⫻PCR buffer (10 mM
Tris-HCl, pH 8.3, 50 mM KCl, 1.5 mM MgCl2, and 0.001% gelatin) (Applied
Biosystems, Foster City, CA) in Bern and 0.5 U of REDTaq DNA polymerase
enzyme associated with 1⫻REDTaq PCR buffer (10 mM Tris-HCl, pH 8.3, 50
mM KCl, 1.1 mM MgCl2, and 0.01% gelatin) (Sigma-Aldrich, Saint Louis, MO)
for the method carried out in Besanc¸on. The PCR amplification was achieved in a Biometra T3 thermocycler (Whatman Biometra, Goettingen, Germany), under the following conditions: 30 cycles with denaturation at 94°C for 30 s, annealing at 54°C (EmsJ 1/2 and EmsK 1/2) or 60°C (EmsB 1/2 and NAK1 A/B) for 30 s, and extension at 72°C for 30 s to 1 min. PCR products were studied in fragment analysis, to assess the polymorphism of size using automatic sequencers. A comparison was made between the two different systems used, in order to evaluate and demonstrate the independent repeatability of the analyses: an ABI Prism 3100 automatic sequencer (Applied Biosystems, Foster City, CA) was used in Bern, and a Beckman CEQ 8000 (Beckman Coulter, Fullerton, CA) was used in Besanc¸on. Fluorescence signals generated by marked primers were read by colorimetric analysis. Correspondences were established to assess the sizes of the amplified fragments, by using Genotyper 3.7 software for the ABI apparatus and Genetic Analysis System 8.0.52 software for the Beckman apparatus. To establish this comparison, the Pearson correlation coefficient was calculated for each sample between data sets obtained on the two systems. Stability of EmsB profiles was checked by repeated testing (five times) of sample 302 PL-F, selected
randomly from theE. multilocularispanel.
Genotype determination and statistical analysis.Alleles from single-locus microsatellite targets (EmsJ, EmsK, and NAK1) were plotted using the results of fragment analyses and specified for homozygote or heterozygote genotypes. To assess the genetic diversity provided by EmsB, the presence and the height of each peak, basically corresponding to alleles, were recorded. Peaks below 10% of the highest peak per run were classified as artifacts and removed from the analysis. The height of each defined peak reflected the number of copies of the microsatellite present in the parasite DNA (4). Because the intensity of signals is dependent on the DNA concentration used for the PCR, normalization for an EmsB profile was achieved by dividing each peak by the sum of all the peaks for a given profile. This method of calculation is an improvement over the method used by Bart et al., which divided each peak by the highest peak of a given profile (4).
[image:2.585.42.547.81.182.2]Clusters for the EmsB target were identified by hierarchical clustering analysis, using the Euclidean distance and the unweighted-pair group method using av-erage linkages. The stability of clusters was tested by a multiscale bootstrap
TABLE 1. Primer sequences and characteristics of microsatellite loci in
E. multilocularis
Primer namesa Primer sequence Fragment size
(bp)
Annealing
temp (°C) Repetition Source (accession no.)
EmsJ A*, EmsJ B
5
⬘
-GAACGCGCTAACCGATTG-3
⬘
,
5
⬘
-TTAGGAATGGGAAGGTGTCG-3
⬘
152–155
54
(CT)
nIn-house (AY680845)
EmsK A*, EmsK B
5
⬘
-CAGCTCAAAAGAACCCGAAG-3
⬘
,
5
⬘
-CCAAACTTCCGCTCACTCTG-3
⬘
248–250
54
(CA)
nIn-house (AY680857)
EmsB A*, EmsB C
5
⬘
-GTGTGGATGAGTGTGCCATC-3
⬘
,
5
⬘
-CCACCTTCCCTACTGCAATC-3
⬘
209–241
60
(CA)
n(GA)
nIn-house (AY680860)
NAK1 A*, NAK1 B
5
⬘
-GGTAGCCAATGCTGTGGTTT-3
⬘
,
5
⬘
-GCGAGGTCACGCAAATGTAT-3
⬘
189–201
60
(CCA)
nNakao et al. (AB100031)
a*, primer labeled. Primers NAK1 A* and NAK1 B were designed from the sequence EMms1 (AB100031) available in GenBank before the paper by Nakao et al.
(4) was published.
2944
KNAPP ET AL.
J. C
LIN. M
ICROBIOL.
on May 16, 2020 by guest
http://jcm.asm.org/
Isolate code Host species Geographical origin Yr of isolation
1AL-r Microtus oeconomus Alaska (St. Lawrence Island) 1996
2AL-r Microtus oeconomus Alaska (St. Lawrence Island) 1996
3AL-r Microtus oeconomus Alaska (St. Lawrence Island) 1996
4AL-r Microtus oeconomus Alaska (St. Lawrence Island) 1996
5AL-r Microtus oeconomus Alaska (St. Lawrence Island) 1996
6AL-r Microtus oeconomus Alaska (St. Lawrence Island) 1996
7AL-r Microtus oeconomus Alaska (St. Lawrence Island) 1996
10AL-r Microtus oeconomus Alaska (St. Lawrence Island) 1996
11AL-r Microtus oeconomus Alaska (St. Lawrence Island) 1996
13AL-r Microtus oeconomus Alaska (St. Lawrence Island) 1996
27AL-h Human Alaska (St. Lawrence Island) 1996
38AL-h Human Alaska 1996
SL1-h Human Alaska (St. Lawrence Island) 1996
CND-r Rodent Canada NDb
2PRC-r Microtus limnophilus China (Tibet) 2001
5PRC-r Microtus limnophilus China (Tibet) 2002
6PRC-r Microtus limnophilus China (Tibet) 2002
7PRC-r Microtus limnophilus China (Tibet) 2002
9PRC-r Cricetulus kamensis China (Tibet) 2002
26J-h Human Japan ND
E1J-F Vulpes vulpes Japan (Hokkaido) 2005
I3J-F Vulpes vulpes Japan (Hokkaido) 2005
M4J-F Vulpes vulpes Japan (Hokkaido) 2005
N5J-F Vulpes vulpes Japan (Hokkaido) 2005
O4J-F Vulpes vulpes Japan (Hokkaido) 2005
33F-h Human France ND
R04131-1F-F Vulpes vulpes France (Ardennes) 2004
14CH-r Arvicola terrestris Switzerland (Fribourg) 1995
15CH-r Arvicola terrestris Switzerland (Fribourg) 1995
16CH-r Arvicola terrestris Switzerland (Fribourg) 1995
17CH-r Arvicola terrestris Switzerland (Fribourg) 1995
18CH-r Arvicola terrestris Switzerland (Fribourg) 1995
19CH-r Arvicola terrestris Switzerland (Fribourg) 1995
20CH-r Arvicola terrestris Switzerland (Fribourg) 1995
21CH-r Arvicola terrestris Switzerland (Fribourg) 1995
22CH-r Arvicola terrestris Switzerland (Fribourg) 1995
23CH-r Arvicola terrestris Switzerland (Fribourg) 1995
24CH-r Arvicola terrestris Switzerland (Fribourg) 1995
36CH-h Human Switzerland 1982
37CH-h Human Switzerland 1990
39CH-h Human Switzerland 1980
40CH-h Human Switzerland 1994
41CH-h Human Switzerland 1986
CH1-h Human Switzerland ND
CH5-h Human Switzerland ND
29CH-m Macaque monkey Switzerland (Basel zoo) 1997
31CH-m Macaque monkey Switzerland (Basel zoo) 2003
34CH-m Macaque monkey Switzerland (Zu¨rich zoo) 1991
42CH-m Vervet monkey Switzerland (Zu¨rich zoo) 1989
43CH-m Vervet monkey Switzerland (Zu¨rich zoo) 1990
45CH-m Marmoset monkey Switzerland (Lausanne zoo) 2003
3CH-F Vulpes vulpes Switzerland 2001–2003
52CH-F Vulpes vulpes Switzerland 2001–2003
64CH-F Vulpes vulpes Switzerland 2001–2003
35D-h Human Germany ND
101D-F Vulpes vulpes Germany 2001–2003
116D-F Vulpes vulpes Germany 2001–2003
121D-F Vulpes vulpes Germany 2001–2003
126D-F Vulpes vulpes Germany 2001–2003
141D-F Vulpes vulpes Germany 2001–2003
32A-h Human Austria 1986
209A-F Vulpes vulpes Austria 2001–2003
278A-F Vulpes vulpes Austria 2001–2003
287A-F Vulpes vulpes Austria 2001–2003
302PL-F Vulpes vulpes Poland 2001–2003
310PL-F Vulpes vulpes Poland 2001–2003
315PL-F Vulpes vulpes Poland 2001–2003
392PL-F Vulpes vulpes Poland 2001–2003
525CZ-F Vulpes vulpes Czech Rep. 2001–2003
535CZ-F Vulpes vulpes Czech Rep. 2001–2003
559CZ-F Vulpes vulpes Czech Rep. 2001–2003
425SK-F Vulpes vulpes Slovakia 2001–2003
435SK-F Vulpes vulpes Slovakia 2001–2003
480SK-F Vulpes vulpes Slovakia 2001–2003
402NL-F Vulpes vulpes The Netherlands 2001–2003
420NL-F Vulpes vulpes The Netherlands 2001–2003
500 Meriones unguiculatus Francec
March 1991
501 Meriones unguiculatus Francec May 1991
502 Meriones unguiculatus Francec February 1992
a
Isolate code abbreviations: code number, geographical origin of sample, and animal host (lowercase letter for intermediate hosts关r, rodent; h, human; and m,
monkey兴and capital letter for definitive hosts关F, fox兴). The sample collection contained 13 isolates from Alaska, 1 from Canada, 5 from China, 6 from Japan, 2 from
France, 27 from Switzerland, 6 from Germany, 4 from Austria, 4 from Poland, 3 from the Czech Republic, 3 from Slovakia, and 2 from The Netherlands.
b
ND, not documented.
c
Isolate maintained in vivo in laboratory by several passages inMeriones unguiculatus.
2945
on May 16, 2020 by guest
http://jcm.asm.org/
[image:3.585.45.546.63.681.2]resampling (B⫽1,000), resulting in approximately unbiasedPvalues (28, 29). Dendrograms based on hierarchical clustering were constructed by using pvclust
(31), available under the R Project (24).E. granulosusisolates were included in
the analysis as outgroup controls (sample 539, a G1 Algerian sheep isolate, and sample 116, a G6 Mauritanian camel isolate [1, 2]). In previous experiments (4), we determined reproducibility and repeatability of EmsB microsatellite analyses
by testing one isolate, which had been maintained in vivo inMeriones
unguicu-latusby serial passages at several-month intervals (samples 500, 501, and 502,
detailed in Table 2). Thus, these three samples showed similar EmsB profiles. These results were then used to calculate a genetic threshold, which enabled us to identify the isolate clusters.
The discriminatory power of each of the four microsatellites was assessed using Simpson’s index (30), improved by Hunter and Gaston (19), and is de-scribed by the following equation:
D ⫽1⫺n共n1⫺1兲
冘
j⫽1s
nj共nj⫺1兲
wherenis the total number of isolates of the sample panel,sis the total number
of groups described, andnjis the number of isolates belonging to thejth type.
This index is based on the probability that two unrelated strain samples from a given panel will be placed in different typing groups. A genetic tool has a high discriminating power when the observed value exhibits an index close to 1.
Nucleotide sequence accession numbers.Nucleotide sequence data reported in this paper are available in the GenBank database under the accession numbers AY680845, AY680857, AY680860, and AB100031.
RESULTS
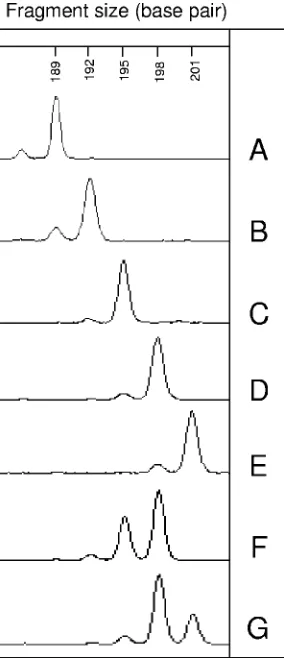
[image:4.585.72.254.66.290.2]EmsJ, EmsK, and NAK1 polymorphism.
Both EmsJ and
EmsK loci exhibited two alleles: 152 and 155 bp and 248 and
250 bp, respectively. These loci, forming three genotypes (A, B,
and C) are presented in Fig. 1. Amplification for the EmsJ
target was feasible for the entire sample panel (Table 3). For
EmsK, one isolate yielded no amplification, even though
dif-ferent
Taq
polymerases and different running conditions were
used (data not shown). The target pair EmsJ and EmsK split
the panel into two clusters. The whole European panel presented
homozygote genotypes at 152 bp for EmsJ and 248 bp for EmsK
(Fig. 1A). The Asian, Alaskan, and Canadian isolates were
char-acterized by heterozygote genotypes at 152 and 155 bp for EmsJ
and a homozygote genotype at 248 bp for EmsK (Fig. 1B). Only
one Alaskan sample (collected in the field close to Savoonga)
differed for EmsK, with an allele at 250 bp (Fig. 1C). The rate of
FIG. 1. Electrophoregrams of EmsJ (152 and 155 bp) and EmsK
(248 and 250 bp) loci, performed with the automatic sequencer ABI
Prism 3100 (Applied Biosystems, Foster City, CA). A, European
notype; B, Asian, Alaskan, and Canadian genotypes; C, Alaskan
ge-notype (found for only one rodent).
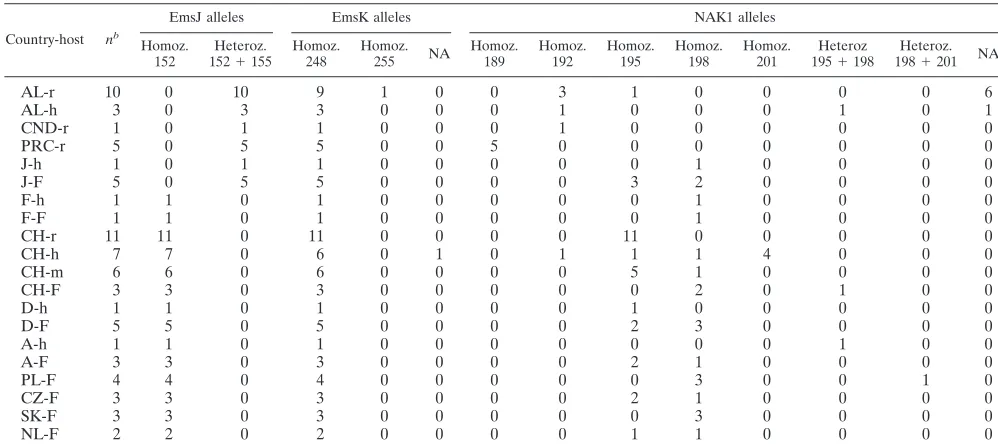
TABLE 3. Results of fragment amplification for EmsJ, EmsK, and NAK1
aCountry-host nb
EmsJ alleles EmsK alleles NAK1 alleles
Homoz. 152
Heteroz.
152⫹155
Homoz. 248
Homoz.
255 NA
Homoz. 189
Homoz. 192
Homoz. 195
Homoz. 198
Homoz. 201
Heteroz
195⫹198
Heteroz.
198⫹201 NA
AL-r
10
0
10
9
1
0
0
3
1
0
0
0
0
6
AL-h
3
0
3
3
0
0
0
1
0
0
0
1
0
1
CND-r
1
0
1
1
0
0
0
1
0
0
0
0
0
0
PRC-r
5
0
5
5
0
0
5
0
0
0
0
0
0
0
J-h
1
0
1
1
0
0
0
0
0
1
0
0
0
0
J-F
5
0
5
5
0
0
0
0
3
2
0
0
0
0
F-h
1
1
0
1
0
0
0
0
0
1
0
0
0
0
F-F
1
1
0
1
0
0
0
0
0
1
0
0
0
0
CH-r
11
11
0
11
0
0
0
0
11
0
0
0
0
0
CH-h
7
7
0
6
0
1
0
1
1
1
4
0
0
0
CH-m
6
6
0
6
0
0
0
0
5
1
0
0
0
0
CH-F
3
3
0
3
0
0
0
0
0
2
0
1
0
0
D-h
1
1
0
1
0
0
0
0
1
0
0
0
0
0
D-F
5
5
0
5
0
0
0
0
2
3
0
0
0
0
A-h
1
1
0
1
0
0
0
0
0
0
0
1
0
0
A-F
3
3
0
3
0
0
0
0
2
1
0
0
0
0
PL-F
4
4
0
4
0
0
0
0
0
3
0
0
1
0
CZ-F
3
3
0
3
0
0
0
0
2
1
0
0
0
0
SK-F
3
3
0
3
0
0
0
0
0
3
0
0
0
0
NL-F
2
2
0
2
0
0
0
0
1
1
0
0
0
0
aGeographical origins of samples: AL, Alaska; CND, Canada; PRC, China; J, Japan; F, France; CH, Switzerland; D, Germany; A, Austria; PL, Poland; CZ, Czech
Republic; SK, Slovakia; NL, The Netherlands. Animal hosts: r, rodent; h, human; m, monkey; F, fox). Homoz., homozygous; Heteroz., heterozygous; NA, no amplification achieved.
bn, number ofE. multilocularisisolates tested.
2946
KNAPP ET AL.
J. C
LIN. M
ICROBIOL.
on May 16, 2020 by guest
http://jcm.asm.org/
[image:4.585.41.540.466.690.2]heterozygosity observed was 33.3% for EmsJ and 0% for EmsK.
The index of discrimination (
D
) was 0.37 for EmsJ with two
groups and 0.03 for EmsK with two groups.
Amplification of the NAK1 target was basically in agreement
with previously published data (22). However, a slight size
difference of 30 bp was due to the use of primers NAK1 A and
NAK1 B (Table 1), which were designed from the sequence
available in GenBank (GbR AB100031) before the paper by
Nakao et al. was published (22). In addition, two new alleles
were found with these primers. Overall, this target presented a
total of five alleles, with five homozygote and two heterozygote
genotypes (Fig. 2 and Table 3). Some of the Alaskan isolates
could not be amplified, despite the use of different sets of
primers and different conditions as described above. The
in-vestigation of metacestodes from the Chinese rodents yielded
one specific allele at 189 bp. An allele at 192 bp was found
predominantly in Alaskan and Canadian samples. Among the
European and Japanese samples, the 195- and 198-bp alleles
were predominant. The 201-bp allele was present only among
Swiss isolates. The rate of heterozygosity was 5.88%. The index
of discrimination was 0.73 for NAK1, with seven different
groups.
Reproducibility of results was demonstrated by performing
the experiments independently at the two research laboratories
mentioned above.
EmsB polymorphism.
EmsB amplification was successful for
the entire sample collection. The EmsB investigations resulted
in a complex profile pattern, yielding 17 different alleles (209
bp to 241 bp) as described by Bart et al. in 2006 (4). The
Pearson correlation coefficient was determined for each
sam-ple between data sets obtained on the Beckman CEQ 8000 and
on the ABI Prism 3100. It ranged between 0.92 and 0.99 (
P
⬍
0.001). Furthermore, patterns found with the Beckman CEQ
8000 were in agreement with those found with the ABI Prism
3100 as shown in the Fig. 3.
Repeatability was assessed by performing PCR and
frag-ment analyses of the Polish fox sample 302 PL-F five times with
both systems. After normalization of the profiles, standard
deviation (
) of the genetic distance between each repetition
was 3.1
⫻
10
⫺3with the ABI system versus 6.3
⫻
10
⫺3with the
Beckman system. The main EmsB profiles are shown in Fig. 4a.
ABI data were used to construct a dendrogram (Fig. 4b).
Robustness of nodes was tested by multiscale bootstrap
resa-mpling (
B
⫽
1,000), given an approximately unbiased
P
value.
The outgroup controls, composed of two
E. granulosus
sam-ples, were distinguished from the other groups by a maximum
genetic distance of 0.5.
A genotypic threshold, based on the results given by the
cultivated isolates, was created to define the total number of
genotypes. This threshold was calculated according to the
fol-lowing formula:
x
⫹
3
(where
x
represents the average of the
genetic distance found between the three samples and
rep-resents the standard deviation). The calculated average was
0.0266, and standard deviation was 0.0177. The calculated
ge-netic distance value was 0.08. With this method of
classifica-tion, the index of discrimination was 0.94 for this target, with
29 different groups.
The
E. multilocularis
panel was divided into three distinct
clusters. The Alaskan block was composed of isolates obtained
from rodents all caught in the same field and from two Alaskan
patients (profile A in Fig. 4). This cluster was genetically
dis-tinguished from the other isolates by a value of 0.48. The
Asia-Canada-Alaska group (profiles B and C) was clearly
dis-tinguishable from the European cluster by a value of 0.32. In
Fig. 4, five main European EmsB profiles (D, E, F, G, and H)
are shown. Their variations were due to the heights, the
num-bers, and the sizes of the peaks. For a given profile, variations
were caused only by the heights of the peaks. We were able to
differentiate several genotypes using our fixed genetic
thresh-old. Thus, 23 genotypes were identified out of the 51 European
samples. For example, the cluster formed by profile D was split
into four closed genotypes. Profile E was characteristic for the
parasites collected from rodents caught in the Fribourg field.
Profile F was found among
E. multilocularis
collected from
Swiss foxes, humans, and monkeys.
DISCUSSION
Previous studies (4, 9, 22) have tackled
E. multilocularis
genetic variability by using microsatellite DNA targets.
Micro-FIG. 2. Electrophoregrams of the NAK1 (192 to 201 bp) locus,
performed with the automatic sequencer ABI Prism 3100 (Applied
Biosystems, Foster City, CA). Genotypes A to G are shown, and a
representative sample of each genotype is indicated in parentheses: A,
Chinese samples (2PRC-r); B, Alaskan, Canadian, and Swiss samples
(2AL-r); C, Alaskan, Japanese, Swiss, German, Austrian, Czech, and
Dutch samples (14CH-r); D, Japanese and European samples
(116D-F); E, Swiss samples (CH5-h); F, Alaskan, Swiss, and Austrian samples
(32A-h); and G, one Polish sample (392PL-F).
on May 16, 2020 by guest
http://jcm.asm.org/
[image:5.585.92.234.69.398.2]satellite sequences, due to their high power of discrimination,
seemed to be a suitable tool to search for genetic differences
not only between geographically distinct endemic areas but
also within the areas themselves (4, 22). In the present study,
we assessed and compared the discriminatory powers of
dif-ferent microsatellite targets by investigating a large panel of
E.
multilocularis
isolates originating from different endemic foci,
such as Saint Lawrence Island (Alaska), Central Europe, the
Tibetan Plateau, and Japan. The single-locus microsatellites
EmsJ and EmsK provided data about the parasites’ genetic
diversity that was relevant for discriminating samples over a
large geographical range. The European cluster could thus be
distinguished from the Alaskan, Canadian, and Asian cluster
by two distinctly different genotypes. This combination enabled
us to determine the global origins of the samples. Nevertheless,
these two microsatellites exhibited a weak discriminatory
power on a small scale, and we were unable to compare our
results with the heterozygosity previously described by Nakao
et al. (22).
With regard to NAK1, its higher level of discriminatory
power enabled us to determine genetic polymorphism between
the Tibetan, Alaskan, and European-Japanese clusters. On the
other hand, a strong similarity was depicted for samples
col-lected from the same field in Switzerland, indicating a possible
common origin of contamination by
E. multilocularis
in that
area, as there was also a spatial and temporal homogeneity
with regard to the sampling procedure. The same phenomenon
was observed for some Alaskan rodents, caught under similar
geographically restricted conditions. While these findings were
demonstrated with EmsB, they could not be confirmed with
the NAK1 target, because these samples did not provide
spe-cific amplification products. The lack of amplification has not
been clarified, despite the redesign of several primer sets. No
reliable geographical or genetic structures were observed
among the other European samples with the NAK1 target.
More isolates have to be investigated to document the
poly-morphism level of this target in different areas. The fairly high
rate of polymorphism of NAK1 may be linked to the mutation
rate which occurs faster in the NAK1 region than in those of
the other two single-locus microsatellites. The heterozygosity
found by NAK1 in the present study was qualitatively in
agree-ment with results previously published by Haag et al. and
Nakao et al. (17, 22). However, the relatively low rate of
heterozygosity confirmed that cross-fertilization occurs in the
tapeworm, but to a much lesser extent than self-fertilization
(17).
[image:6.585.100.487.69.325.2]The EmsB target, referred to as a “tandem repeated
mul-tilocus microsatellite,” had a higher discriminatory power than
the conventionally used single-locus microsatellites. Indeed,
with the 17 alleles described, EmsB enabled us to discriminate
single isolates from the same geographic origin, even at the
“field” level. The extremely high discriminatory power of this
target did not prejudice our study, as only a small genetic
distance between samples from the same geographical origin
was found, i.e., in the field in Alaska and in the one in
Swit-zerland. When comparing single-locus microsatellites and
EmsB results, the hypothesis of a “clonal” contamination of
rodents living in the same field by, for example, one or several
foxes that were infected by the same parasite isolate is
consid-erably strengthened. In addition, an identical profile was found
for different Swiss hosts, as shown in Fig. 4. This result
illus-trates that the genetic variability exhibited by EmsB is linked to
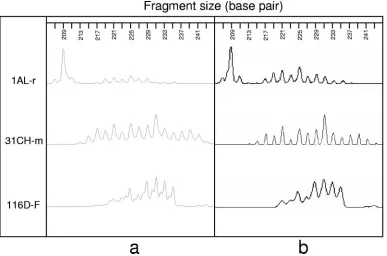
FIG. 3. Comparison between electrophoregrams performed with the automatic sequencers Beckman CEQ 8000 (a) and ABI Prism 3100 (b)
for three isolates arbitrarily selected from the present sample collection: 1AL-r, Alaskan rodent isolate; 31CH-m, Swiss zoo monkey isolate; and
116D-F, German red fox isolate. The Pearson correlation coefficient was determined for results obtained on the two systems and was 0.99 for AL-r,
0.96 for 31CH-m, and 0.99 for 116D-F (
P
⬍
0.001).
2948
KNAPP ET AL.
J. C
LIN. M
ICROBIOL.
on May 16, 2020 by guest
http://jcm.asm.org/
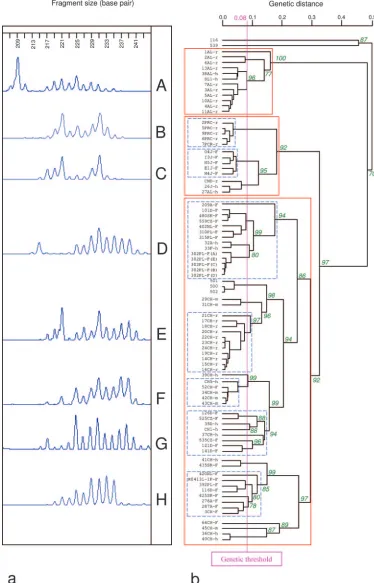
FIG. 4.
E. multilocularis
genetic classification according to EmsB results. On the left side (a), an example of electrophoregrams of EmsB loci
(209 bp to 241 bp), obtained using the automatic sequencer ABI Prism 3100. On the right side (b), a dendrogram based on EmsB genotypic data,
constructed by hierarchical clustering analysis (Euclidian distance, average link clustering method), with pvclust, under the R Project. The
approximately unbiased
P
values (numbers on nodes, in percent) were calculated with a multiscale bootstrap (
B
⫽
1,000). The three solid-line boxes
show St. Lawrence Island’s samples (upper box), the Asian-North American samples (middle box), and the European samples (lower box). The
electrophoregrams correspond to (A) the St. Lawrence Island profile in the genetic tree and the dotted-line boxes refer to (B) the Chinese rodent
profile, (C) the Japanese fox profile, and (D through H) the main European profiles. Samples 500, 501, and 502 represent a single isolate
maintained in vivo by several passages in
Meriones unguiculatus
. Sample 116 originating from a Mauritanian camel and sample 539 originating from
an Algerian sheep were
E. granulosus
samples and were included as outgroup controls.
2949
on May 16, 2020 by guest
the geographical specificity and not to the host specificity of
samples.
Genetic studies using microsatellites are commonly based
upon multiplex analyses in which 10 to 15 targets are
simulta-neously amplified in the same PCR. These analyses are usually
carried out in forensic investigations or in filiation studies for
livestock animals.
E. multilocularis
is an organism with a
par-ticular reproduction pattern. The very low encountered
het-erozygosity rate indicates a predominantly self-fertilizing
breeding process. This organism does not follow the
Hardy-Weinberg principle, and multiplex studies are thus not
appro-priate. Thus, the EmsB microsatellite proved to be very useful
because it provided more information with a single PCR than,
for example, 10 single-locus microsatellites together.
Further-more, it yielded a high rate of positive analyses, with nearly
100% of output.
For the first time, a relevant tool is now available to study
the temporal and spatial development of the parasite within
different host populations, since the similarity between the
profiles of definitive and intermediate hosts can be
demon-strated.
Using this tool, the question of emergence or reemergence
of the infection in several regions of Europe can be addressed
(14). Tracking the spread of single genotypes spatially and
temporally may help to identify the source of the parasites in
recently described new areas of endemicity. Due to the long
incubation period of AE in humans, tracing the contamination
to its source has been nearly impossible so far. The next
chal-lenge will be to superimpose a genetic distribution map on
eco-epidemiological data and to construct a risk map for better
public health management.
ACKNOWLEDGMENTS
We are very grateful to the following persons for providing parasite
specimens: Peter Deplazes (Switzerland), Joke van der Giessen (The
Netherlands), Thomas Romig (Germany), Andrzej Malczewski
(Po-land), Pavol Dubinsky (Slovak Republic), Karel Martinek (Czech
Re-public), Georg Duscher (Austria), Minorou Nakao and Nariaki
Nonaka (Japan), and Patrick Giraudoux, Francis Raoul, and
Marie-He
´le
`ne Guislain (France). We also thank Karen Haag (Brazil) for
constructive comments on the manuscript.
This work was supported by the EU EchinoRisk Project
QLK2-CT-2001-01995 (BBW no. 00.0586-1), the Swiss National Science
Founda-tion (grant no. 31-111780/1), and the U.S. NaFounda-tional Institutes of Health
and National Science Foundation (program R01 TW001565-05
“Ecol-ogy of Infectious Diseases”).
REFERENCES
1.Bardonnet, K., R. Piarroux, L. Dia, F. Schneegans, A. Beurdeley, V. Godot, and D. A. Vuitton.2002. Combined eco-epidemiological and molecular
bi-ology approaches to assessEchinococcus granulosustransmission to humans
in Mauritania: occurrence of the ‘camel’ strain and human cystic
echinococ-cosis. Trans. R. Soc. Trop. Med. Hyg.96:383–386.
2.Bart, J. M., K. Bardonnet, M. C. Elfegoun, H. Dumon, L. Dia, D. A. Vuitton, and R. Piarroux.2004.Echinococcus granulosusstrain typing in North Af-rica: comparison of eight nuclear and mitochondrial DNA fragments
Para-sitology128:229–234.
3.Bart, J. M., I. Breyer, B. Gottstein, T. Romig, and R. Piarroux.2003.
De-velopment of molecular tools to explore genetic diversity inEchinococcus
multilocularis. Helminthologia40:117–121.
4.Bart, J. M., J. Knapp, B. Gottstein, F. El-Garch, P. Giraudoux, M. L. Glowatzki, H. Berthoud, S. Maillard, and R. Piarroux.2006. EmsB, a tan-dem repeated multi-loci microsatellite, new tool to investigate the genetic
diversity ofEchinococcus multilocularis. Infect. Genet. Evol.6:390–400.
5.Bowles, J., D. Blair, and D. P. McManus.1992. Genetic variants within the
genusEchinococcusidentified by mitochondrial DNA sequencing. Mol.
Bio-chem. Parasitol.54:165–173.
6.Bowles, J., and D. P. McManus.1993 Molecular variation inEchinococcus.
Acta Trop.53:291–305.
7.Brack, M., K. Tackmann, F. J. Conraths, and S. Rensing.1997. Alveolar
hydatidosis (Echinococcus multilocularis) in a captive rhesus monkey
(Ma-caca mulatta) in Germany. Trop. Med. Int. Health2:754–759.
8.Bresson-Hadni, S., R. Piarroux, B. Bartholomot, J. P. Miguet, G. Mantion, and D. Vuitton.2005. Echinococcose alve´olaire—alveolar echinococcosis.
EMC He´pato-Gastroente´rologie2:86–104.
9.Bretagne, S., B. Assouline, D. Vidaud, R. Houin, and M. Vidaud.1996.
Echinococcus multilocularis: microsatellite polymorphism in U1snRNA
genes. Exp. Parasitol.82:324–328.
10.Bulle, B., L. Millon, J. M. Bart, M. Gallego, F. Gambarelli, M. Portus, L. Schnur, C. L. Jaffe, S. Fernandez-Barredo, J. M. Alunda, and P. Piarroux.
2002. Practical approach for typing strains ofLeishmania infantumby
micro-satellite analysis. J. Clin. Microbiol.40:3391–3397.
11.Combes, C.1997. Fitness of parasites: pathology and selection. Int. J.
Para-sitol.27:1–10.
12.Craig, P. S.2006. Epidemiology of human alveolar echinococcosis in China.
Parasitol. Int.55(Suppl.):S221–S225.
13.Deplazes, P., and J. Eckert.2001. Veterinary aspects of alveolar
echinococ-cosis—a zoonosis of public health significance. Vet. Parasitol.98:65–87.
14.Eckert, J., F. J. Conraths, and K. Tackmann. 2000. Echinococcosis: an
emerging or re-emerging zoonosis? Int. J. Parasitol.30:1283–1294.
15.Eiermann, T. H., F. Bettens, P. Tiberghien, K. Schmitz, I. Beurton, S. Bresson-Hadni, R. W. Ammann, S. F. Goldmann, D. A. Vuitton, B. Gottstein, and P. Kern.1998. HLA and alveolar echinococcosis. Tissue Antigens52:
124–129.
16.Gottstein, B., F. Bettens, A. J. Parkinson, and F. Wilson.1996. Immunolog-ical parameters associated with susceptibility or resistance to alveolar
hyda-tid disease in Yupiks/Inupiats. Arctic Med. Res.55:14–19.
17.Haag, K. L., A. M. Araujo, B. Gottstein, and A. Zaha.1998. Selection,
recombination and history in a parasitic flatworm (Echinococcus) inferred
from nucleotide sequences. Mem. Inst. Oswaldo Cruz93:695–702.
18.Haag, K. L., A. Zaha, A. M. Araujo, and B. Gottstein.1997. Reduced genetic
variability within coding and non-coding regions of theEchinococcus
mul-tilocularisgenome. Parasitology115:521–529.
19.Hunter, P. R., and M. A. Gaston.1988. Numerical index of the discrimina-tory ability of typing systems: an application of Simpson’s index of diversity.
J. Clin. Microbiol.26:2465–2466.
20.Ito, A., T. Romig, and K. Takahashi.2003. Perspective on control options for
Echinococcus multiloculariswith particular reference to Japan. Parasitology
127(Suppl.):S159–S172.
21.Kern, P., K. Bardonnet, E. Renner, H. Auer, Z. Pawlowski, R. W. Ammann, and D. A. Vuitton.2003. European echinococcosis registry: human alveolar
echinococcosis, Europe, 1982–2000. Emerg. Infect. Dis.9:343–349.
22.Nakao, M., Y. Sako, and A. Ito.2003. Isolation of polymorphic microsatellite
loci from the tapewormEchinococcus multilocularis. Infect. Genet. Evol.
3:159–163.
23.Piarroux, M., S. Bresson-Hadni, I. Capek, J. Knapp, J. Watelet, J. Dumortier, A. Abergel, A. Minello, A. Ge´rard, J. Beytout, R. Piarroux, B. Kantelip, E. Delabrousse, V. Vaillant, D. Vuitton, and P. L. R. Francechino.2006.
Surveil-lance de l’e´chinococcose alve´olaire en France: bilan de cinq anne´es
d’enregistrement 2001–2005. Bull. Epidemiol. Hebd.27–28/2006:206–208.
24.R Development Core Team.2005. R: a language and environment for sta-tistical computing. R Foundation for Stasta-tistical Computing, Vienna, Austria. http://www.r-project.org.
25.Rehmann, P., A. Grone, A. Lawrenz, O. Pagan, B. Gottstein, and L. N. Bacciarini.2003.Echinococcus multilocularisin two lowland gorillas (Gorilla
g. gorilla). J. Comp. Pathol129:85–88.
26.Romig, T., A. Dinkel, and U. Mackenstedt.2006. The present situation of
echinococcosis in Europe. Parasitol. Int.55(Suppl.):S187–S191.
27.Schantz, P. M., C. F. von Reyn, T. Welty, and M. G. Schultz.1976. Echino-coccosis in Arizona and New Mexico. Survey of hospital records, 1969–1974.
Am. J. Trop. Med. Hyg.25:312–317.
28.Shimodaira, H.2002. An approximately unbiased test of phylogenetic tree
selection. Syst. Biol.51:492–508.
29.Shimodaira, H.2004. Approximately unbiased test of regions using
multi-step-multiscale bootstrap resampling. Ann. Stat.32:2616–2641.
30.Simpson, E. H.1949. Measurement of diversity. Nature (London)163:688. 31.Suzuki, R., and H. Shimodaira.2005. pvclust: hierarchical clustering with
p-values. R package version 1.0-3. http://www.is.titech.ac.jp/⬃shimo/prog
/pvclust/.
32.Thompson, R. C., C. M. Kapel, R. P. Hobbs, and P. Deplazes.2006.
Com-parative development ofEchinococcus multilocularisin its definitive hosts.
Parasitology132:709–716.
33.Vuitton, D. A., S. L. Zhang, Y. Yang, V. Godot, I. Beurton, G. Mantion, and S. Bresson-Hadni.2006. Survival strategy ofEchinococcus multilocularisin
the human host. Parasitol. Int.55(Suppl.):S51–S55.
34.Vuitton, D. A., H. Zhou, S. Bresson-Hadni, Q. Wang, M. Piarroux, F. Raoul, and P. Giraudoux.2003. Epidemiology of alveolar echinococcosis with
par-ticular reference to China and Europe. Parasitology127(Suppl.):S87–S107.