Application of Reliability, Availability,
Maintainability (RAM) study, on Compressors
Facility
Saravanan Boopathy1, Dr. Nihal Anwar Siddiqui2, Abhinav Srivastava3
1
M.Tech (HSE-Corp), 2Associate Professor & Head,3Research Scholar, Department of Health Safety & Environment, University of Petroleum & Energy Studies, Dehradun INDIA
Abstract: The industry has continuously increased its needs with high intricacy of technological systems and the higher effectiveness of markets, has compelled providers to implement acceptable strategies for these systems in order to improve their availability and productivity to meet those more demanding criteria. In this context, the complex of RAM factors constitute a strategic approach for integrating reliability, availability and maintainability, by using methods, tools and engineering techniques (Mean Time to Failure, Equipment down Time and System Availability values) to identify and quantify equipment and system failures that prevent the achievement of the productive objectives. The application of such methodologies requires a deep experience and know-how together with the possibility of acquiring and processing data in operating conditions. This paper presents the most relevant aspects and findings of a study conducted for assessing the operational performance of a Compressor package installed and used in the oil and gas' industries. The study was based on the simulation method that is used to simulate the performance of an installation. First the design of the installation is transferred into a Reliability Block Diagram (RBD). Component failure data, together with RBD’s forms the basis input of the AVSim software that employs Monte Carlo simulation to calculate the system reliability and availability. The effect of changes in the configuration of an installation on the availability and reliability of the installation can be made visible. This makes it possible to optimize an installation already in the design phase In this study, three criteria called reliability, availability and maintainability (RAM) of the compressor facility have been employed to compare to future maintenance strategies.
I. INTRODUCTION
This RAM Study is performed for the Compressor facility which is used for Carbon Capture and Storage for both the compression/conditioning facility and the transmission pipeline for supply of CO2 to Oil wells for use in Enhanced Oil Recovery (EOR).CO2 Emission of 0.8 MMPTA from Steel Plant is captured and transferred to the Compressor Facility for dehydration and compression/conditioning to a supercritical state (dense phase) for delivery into the new CO2 transmission pipeline which will be further injected in oil wells for enhanced oil recovery.
A. RAM Study Objectives
The objectives of project RAM study are to:
1) To determine the availability of the Project facility
2) To identify the failure mode of the all equipment and their contribution to the downtime to the Project Facility. 3) Study shall include all shutdown & maintenance requirements for critical equipment.
4) Availability of all equipment for the full operating period shall be studied.
5) Rank the facility systems that are major contributors to the overall unavailability of the facility. 6) Identify the critical equipment within the facility.
7) Assess the estimated availability of the facility against targeted production efficiency requirements; and 8) Propose effective means for improving the facility’s availability.
9) To provide inputs to sparing philosophy by identifying sparing requirement
General reliability, availability and maintainability data from OREDA shall be applied for the study.
B. RAM Methodology
probability of failure, the effect of failure and the ability to detect a failure. The basic design of the Project facility and the performance requirements form the basis for the FMECA-sheet.
RAM (Reliability, Availability, and Maintainability) is a simulation method that is used to simulate the performance of an installation. First the design of the installation is transferred into a Reliability Block Diagram (RBD). Component failure data, together with RBD’s forms the basis input of the AVSim software that employs Monte Carlo simulation to calculate the system reliability and availability. The effect of changes in the configuration of an installation on the availability and reliability of the installation can be made visible. This makes it possible to optimize an installation already in the design phase. The relationship between the design, the demands on performance, the FMECA, failure data and RAM is schematically presented below;
C. RAM Study Basis
A RAM analysis has been performed to determine the availability. In this chapter the RBD model and the results of the RAM analyses are presented and discussed.
D. Definitions
The following are the main terms used in the RAM Study.
Reliability is the probability that an item can perform a required function under stated conditions for a given period of time. Reliability (Re) is calculated using the formula:
total repair total
T
M
T
Re
Availability is the ability of an item to be in a state to perform a required function, under stated conditions at a given instant of time or over a given time interval.
Availability (Av) is calculated using the formula:
total repair preventive total
T
M
M
T
Av
Where Total the total number of hours in the evaluation period; this is usually one year (8760 hours) for an all year round operating facility; M preventive = the total number of hours downtime of the plant for preventive maintenance in the evaluation period; this is often referred to as scheduled downtime; Mrepair = the total number of hours downtime of the plant for corrective maintenance in the evaluation period; this is often referred to as unscheduled downtime and includes a. o. detection time, response time, diagnosis, repair, testing and start-up.
Maintainability is the probability that a given maintenance action, for an item under stated conditions of use, can be carried out within a given time interval.
Production Efficiency is one of the main system performance indicators expressing the achieved production as a percentage of the required production.
Production Efficiency (PE) is calculated using the below formula: PE = Predicted Achieved Production x 100%
Outage is the Period of time during which there is a complete production stoppage.
MTTF or Mean Time to Failure is the average time between consecutive failures – calculated by dividing the cumulative observed time by the total number of failures. This term only applies to components with exponential failure distributions.
MTTR or Mean Time to Repair is a measure of the average time taken to diagnose and restore failed equipment to an operational state. It does not include logistic delays.
MTBF or Mean Time Between Failures of a system is the sum of the MTTF & MTTR and assumes each component will be repaired after a failure and not replaced.
Reliability Block Diagrams are a pictorial representation of the logical interdependencies (parallel or series paths) required for the system under analysis to function correctly.
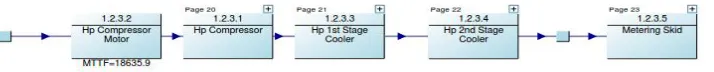
E. Set-up of the Reliability Block Diagram
The first step of the RAM modeling is the development of a Reliability Block Diagram (RBD). The components from the FMECA that are critical for the operation form the basis of the RBD. The relations between the components are modelled and failure data that applies for the failure modes are included.
F. Software
The Availability Workbench (AVSim) software from Isograph has been used to model the Compressor Facility as a series of systems, sub-systems and components. AvSim uses Monte Carlo simulation to explore the model for the different scenarios over a given timeframe (30 years). By performing 3000 runs per scenario, the error estimate for the total downtime and the error estimate for the number of outages can be reduced. Statistically sound results are generated with great certainty.
G. Origin of the Failure Data
The major part of the Mean Time To Failure data for the RAM model is collected from the OREDA.
H. Analysed Period
The minimum analysis lifetime considered for Project Facility system is 30 years. The availability has been calculated over this period of time.
I. Executive Summary
The targeted production efficiency for the Compressor Facility is 94%. To evaluate the same, different simulations of the Compressor Facility are run to calculate the availability and production efficiency in different scenarios.
The following were the base simulations run for the RAM Study. Simulation 1: Availability of the Compressor Facility
[image:4.612.145.502.300.336.2]Simulation 2: Availability of the Compressor Facility (with additional HP Compressor, without Steel Plant 1 & 2) The following were the main findings of the Simulations.
Table 1: Simulation Results
Compressor Facility %
C Compressor Facility +(Additional HP Comp) %
Availability at 100% production 96.56 96.8
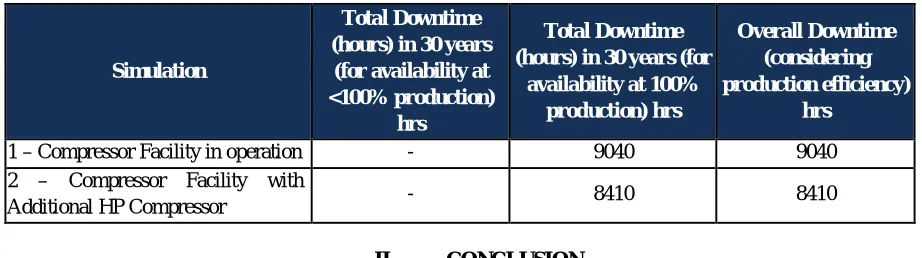
Table 2: Total Availability & Downtime
Simulation
Total Downtime (hours) in 30 years
(for availability at <100% production)
hrs
Total Downtime (hours) in 30 years (for
availability at 100% production) hrs
Overall Downtime (considering production efficiency)
hrs
1 – Compressor Facility in operation - 9040 9040
2 – Compressor Facility with
Additional HP Compressor - 8410 8410
II. CONCLUSION
The simulations demonstrated that, based on failure data and the availability of the Project FACILITY is estimated for the following simulation scenarios:
A. Conclusions from Simulation 1 are:
1) The availability of the Compressor Facility was found out to be 96.56% for 100% capacity.
2) The production efficiency is found to be 96.56%.
B. Conclusions from Simulation 2 are:
3) The availability of the Compressor Facility (with additional HP Compressor) was found out to be 96.8% for 100% capacity.
4) The production efficiency is found to be 96.8%.
The most critical subsystems with regard to unavailability are the Supply of CO2 from Steel plant, the LP Compressor System, the HP Compressor System and the Dehydration System.
REFERENCES
[1] BP Group, Engineering Technical Practice - In Service Inspection and Testing of Above Ground Atmospheric and Low Pressure Storage Tanks, Doc. No.: GP32-44, 17th Aug 2010
[2] BP Group, Engineering Technical Practice - Guidance on Practice for In-Service Inspection and Testing of Pressure Containing Envelope of Rotating Equipment, Doc. No.: GP32-43, 26th Dec 2005
[3] BP Group, Engineering Technical Practice - Inspection and Testing of Equipment in Service Management Principles, Doc. No.: GP32-30, 5th Aug 2008 [4] Exploration and Production Segment Common Maintenance Strategy for New Project, Group Practice, Doc Ref: GN 35-020
[5] Offshore Reliability Data (OREDA 2009), 5th Edition
[6] The Update of Loss of Containment Data for Offshore Pipelines (PARLOC), 2001 [7] Process Equipment Reliability Data, CCPS-AIChE, 1987
[8] F.P. Lees, Loss of Prevention in the Process Industries, 1996 [9] Reliability Information Analysis Centre, 2006