ISSN: 1992-8645 www.jatit.org E-ISSN: 1817-3195
43
CROSS-RELATIONAL STUDY BETWEEN INTELLIGENCE
AND BRAIN ASYMMETRY ABILITIES USING EEG-BASED
IQ CLASSIFICATION MODEL
*AISYAH HARTINI JAHIDIN,MEGAT SYAHIRUL AMIN MEGAT ALI, MOHD NASIR TAIB,
NOORITAWATI MD. TAHIR, AHMAD IHSAN MOHD YASSIN
Faculty of Electrical Engineering, Universiti Teknologi MARA, 40450 Shah Alam, Selangor,
MALAYSIA.
E-mail: *[email protected]
ABSTRACT
EEG is an established technique that has been widely implemented in brain research. Recent innovations in signal processing approaches have allowed implementation of EEG beyond the clinical settings. It has been widely acknowledged that each individual exhibits multi-facet potential which is rooted in the brain. Hence, there is a possibility that these abilities are inter-related with each other. This study proposes to map the relationship between intelligence quotient (IQ) and brain asymmetry (BA) using EEG and intelligent signal processing approach. EEG-based ANN modelling has been previously developed and enhanced. The model is then implemented to predict three levels of IQ (low, medium and high IQ) from 51 samples with distinct BA indices. The indices are derived from Alpha asymmetry score. Mapping between IQ and BA revealed that through a systematic technique; significant relationship exists between distinct IQ levels and symmetrical brain indices. Findings have demonstrated that the best performance occur when subjects maintain relatively balanced control between the two hemispheres. Hence, by implementing feedforward neural network model based on EEG power ratio features, the attempt to relate IQ with BA has been realised with promising results.
Keywords: Artificial Neural Network (ANN), Brain Asymmetry (BA), Electroencephalogram (EEG), Intelligence Quotient (IQ), Power Ratio
1. INTRODUCTION
Electroencephalogram (EEG) is a classic non-invasive method and cost-effective measurement technique for assessing physiological changes relating to brain function. Nowadays, the widespread implementation of EEG has been made possible due the recent advancements in knowledge, which parallels with technological progression. The EEG consists of the summed electrical activities of neuronal population. The intensity of collective neuronal activation in the brain influences the EEG frequency characteristics. As such, variations in the EEG waveform is analysed to deduce between normal from abnormal conditions [1].
Nowadays, various studies on EEG signals have been integrated with intelligent signal processing (ISP) techniques; whereby information obtained from raw signal can be fully extracted with the implementation of advanced processing algorithms and artificial intelligence [2-4]. Lately, ANN has established itself as the most success modelling
technique in biomedical applications [5-8], particularly in the area of pattern recognition [9]. The primary benefit of ANN classifiers are the ability to learn and generalise the solution for complex problems [10, 11].
ISSN: 1992-8645 www.jatit.org E-ISSN: 1817-3195
44 Work has been reported in [41, 42]
Mapping predicted IQ levels for each BA index
IQ classification model
Segregation of brain asymmetry index and extraction of power ratio
(PR) features from BA dataset
Predict IQ levels using IQ classification model Samples selection, data acquisition, cognitive measures, and EEG signal processing to extract PR features
Relationship between IQ and BA individuals to use the brain more effectively [12, 20-25]. With the brain as the source of ability, mental performance can be optimised through training, which can also be related with other cognitive abilities [26-30].
Asymmetries exist at all levels of the nervous system and this concept extensively relates to emotional studies [31-35]. Several studies have correlated brain asymmetry with higher cognitive processes [36, 37]. However, to date, there is still limited research that explores this innate human ability via a systematic model approach [38-40].
Hence, this paper proposes a novel method to evaluate relationship between intelligence and brain asymmetry based on brain signals integrated with ANN. The IQ model was trained with Theta, Alpha and Beta power ratio sub-bands of IQ dataset as inputs vector. The analysis involves predicting IQ levels from brain asymmetry dataset using the established network model. Procedures related to the proposed work are explained in Section 2, followed by the findings in Section 3. Finally, the conclusion is drawn in Section 4.
2. METHODOLOGY
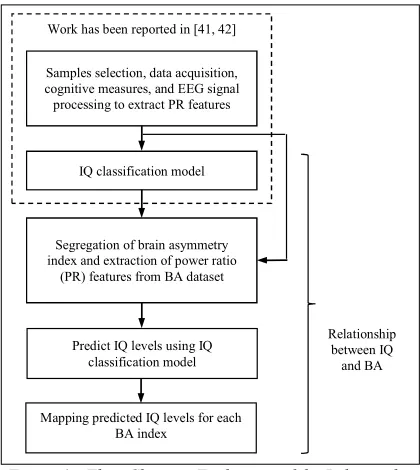
[image:2.612.89.299.446.681.2]This section explains on the experiments that have been executed. Figure 1 illustrates the flow of the proposed methods.
Figure 1: Flow Chart on Evaluation of the Relationship between IQ and Brain Asymmetry.
It consists of samples selection, data acquisition, and cognitive measures (IQ and BA datasets). It is also consists of EEG signal processing to extract
power ratio features. This is then followed by a brief description on the enhancement of IQ classification model. Finally, the nonlinear mapping was done by implementing the developed model in predicting the IQ levels from BA dataset. This is implemented to evaluate the relationship between IQ and BA. Initial parts of the tasks have been reported previously [41, 42].
2.1 Samples Selection, Data Acquisition, Cognitive Measures And EEG Signal Processing
The focus of this current work is to segregate different set of samples, which is BA dataset into distinct groups of brain asymmetry. Previous works have focused on segregation of IQ dataset into high, medium and low IQ levels based on distribution of IQ scores from Raven’s Progressive Matrices [41, 42]. Detailed elaborations on data acquisition, EEG pre-processing, derivation of energy spectral density (ESD) and extraction of power ratio (Theta, Alpha and Beta) were also discussed [41].
In cognitive brain research, the neural efficiency hypothesis has been thoroughly investigated through the fluctuations of EEG power in the Alpha band (8– 13Hz) [43], which can also be translated into analysis on brain asymmetry. Thus, the computation of Alpha asymmetry score feature is important to segregate and gauge the level of brain asymmetry.
Alpha asymmetry scores (AS) were computed from ESD of the Alpha band using Equation 1. Initially, the normalised ESD for both hemispheres was computed via ln-transformation. The asymmetry score (AS) is then computed from the difference of normalised magnitude between both hemispheres; right prefrontal (Fp2) and left prefrontal (Fp1) of brain as mathematically expressed by Equation 1.
(
, 2)
ln(
, 1)
ln jFp jFp
j ESD ESD
AS = − . (1)
where j represent brainwave frequency bands. In this paper, the study focused only on Alpha band. Since the Alpha power is inversely related to brain activation, higher value of the AS would indicate greater relative left hemisphere activation and vice versa.
ISSN: 1992-8645 www.jatit.org E-ISSN: 1817-3195
45 Table 1:Threshold Limit of Asymmetry Score (AS) for
Each Brain Asymmetry (BA) Index. BA Indices (Indicator) Range of Asymmetry Score
(AS) 1 (poorly balanced) 1 ≤ AS
2 (moderately balanced) 0.05 ≤ AS ≤ 1
3 (highly balanced) 0 ≤ AS ≤ 0.05
In this work, the approximate cut-off score for the asymmetry index was adopted from the work by van Putten [44]. Thus, the lower bound for the index near zero reflects perfect symmetry. For subjects with balanced brain state, the index between 0.042 ± 0.005 would be acceptable and is adopted for index BA3 (highly balanced). Scores equal to or more than 1 are referred to as maximal asymmetry and coded with index BA1 (poorly balanced). For AS between 0.05 to 1, the samples will be coded as index BA2 (moderately balanced).
2.2 IQ Classification Model – Network Enhancement And Validation Signal Processing
The IQ classification model, which has been developed earlier, was re-trained to achieve best possible performance. The network was trained to learn the unique pattern of Theta, Alpha and Beta sub-bands power ratio with respect to the low, medium and high IQ levels [41]. Model development employs similar approach, but with extended network validation procedures using correlation function tests.
Correlation tests are effective methods of validating identified neural networks by determining the whiteness of its residuals. These tests are crucial to ensure the performance of the identified ANN model. The correlation tests consist of auto-correlation function (ACF) and cross-auto-correlation function (CCF) [45]. ACF measures the similarity between the residual and itself, while CCF measures the similarity of the residuals to the actual output. It is common to execute the ACF and CCF between lags
±
20
[46]. Correlation tests were done by shifting the signals at different lags and measuring the correlation coefficients between each lag.If a high correlation is detected, this would indicate that there are unmodeled dynamics that have not been accounted for by the MFFN. In this case, the MFFN model would be unacceptable. The MFFN model can only be accepted if the correlation tests meet all the necessary requirements. The ACF and CCF each can be mathematically expressed by Equation 2 and Equation 3.
( )
τ
[
ε
(
τ
) ( )
ε
] ( )
δ
τ
θ
εε =E t− t = . (2)( )
τ[
(
τ) ( )
ε]
τθyε =E yt− t =0, ∀ . (3)
where, δ
( )
τ is the Kronecker delta, E( )
• is mathematical expectation of the correlation function,( )
tε is prediction error (residual between actual output and predicted output),
τ
is lag space and( )
ty is actual output. The Kronecker delta,
δ
( )
τ
, is defined as Equation 4.( )
≠ = =
0 , 0
0 , 1
τ
τ
τ
δ
. (4)The correlation tests are expected to attain the results in the Equation 4 with a certain level of tolerance. Hence, for the identified model to be accepted, the correlation coefficients should lie inside the 95% confidence interval limits, defined as, ±1.96 n (where
n
is the number of data points in particular set) for all lags [45], except at lag 0 for ACF test. The MFFN model can only be accepted when the conditions set by the correlation tests are satisfied.The successfully trained model which complies with the correlation requirements are then used to predict IQ from BA dataset. This will be further elaborated in Section 3.
2.3 Mapping The IQ-BA Relationship Using IQ Classification Model
As shown in Figure 1, evaluation on the relationship between IQ and brain asymmetry involves power ratio features from BA dataset that are fed as inputs to the established network. Power ratio from BA dataset were calculated using similar procedure as in [41]. The network will predict IQ level from the pattern that was previously learned. By taking IQ levels as references, the predicted IQ levels from BA dataset were then calculated in percentage value. Finally, bar graphs for the predicted IQ levels were plotted correspondingly with the BA index to evaluate the possible relationship that exists between both IQ and BA.
3 RESULTS AND DISCUSSION
3.1 Samples Of Brain Asymmetry Dataset And EEG Signal Processing
ISSN: 1992-8645 www.jatit.org E-ISSN: 1817-3195
46 samples from BA dataset into three balanced states; poorly (BA1), moderately (BA2) and highly balanced (BA3).
As for the IQ dataset, the detailed elaboration on sample distribution, as well as pattern of ESD and power ratio features (Theta, Alpha and Beta) corresponding to low, medium and high IQ levels have been described in previous work [41].
3.2 Enhancement And Validation Of The IQ Classification Model
Input layer consists of 3 neurons, which represent the EEG features of Theta, Alpha and Beta PR measured from the left prefrontal cortex. The output layer consists of single neuron which delivers the three distinct IQ levels as the computed result. Network training has been optimised with single hidden layer which comprises of 6 neurons.
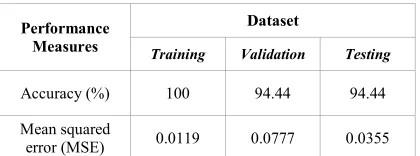
[image:4.612.314.522.113.288.2]Table 2 tabulates the improved final network which consists of accuracy and mean squared error (MSE) for training, testing and validation dataset. The network model yielded higher accuracy with minimal error (approximately zero) for training, validation and testing. Furthermore, it was found that previous percentage of testing accuracy was 88.89% [41], compared to the current network, which attained 94.44%.
Table 2:Classification Accuracy and Mean Squared Error in Training, Validation and Testing of Final
Network Model.
Performance Measures
Dataset
Training Validation Testing
Accuracy (%) 100 94.44 94.44
Mean squared
error (MSE) 0.0119 0.0777 0.0355
Meanwhile, Table 3 shows the precision and sensitivity for each IQ level during training, validation and testing. For the current network, one data from IQ level 2 of the validation dataset was misclassified to IQ level 3. Similar finding was also observed for the testing dataset. Hence, sensitivity of IQ level 2 during testing has improved to 80% compared to the previous finding; in which the sensitivity was at 60%.
Table 3:Performance Matrix Parameters which are Precision and Sensitivity in Training, Testing and
Validation for Three IQ Levels.
IQ Level
Datasets
Training Validation Testing
P re ci si o n ( % ) S en si ti v it y ( % ) P re ci si o n ( % ) S en si ti v it y ( % ) P re ci si o n ( % ) S en si ti v it y ( % )
1 100 100 100 100 100 100
2 100 100 100 87.5 100 80
3 100 100 85.7 100 88.9 100
In general, the network model is considered sufficiently trained when the output error during training is minimal (MSE = 0.0119) [47-49], and has generalised well with low error (MSE = 0.0355) for the testing dataset [48, 50]. Hence, this indicates a good model fit and well-trained network, which can predict distinct IQ levels from PR sub band features with minimal error.
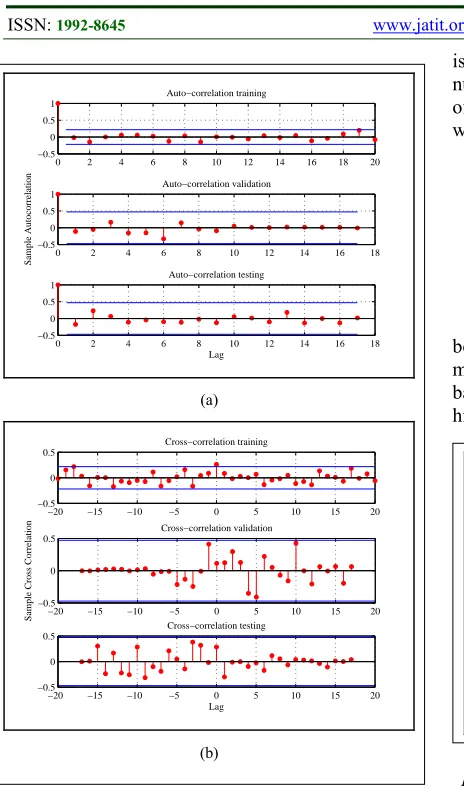
Furthermore, as mentioned in Section 2.2, correlation function tests were utilised to assess the validity of the model. The results were plotted in terms of auto-correlation function (ACF) and cross-correlation function (CCF), each in Figures 2(a) and 2(b), respectively. Results of ACF tests for training, validation and testing are as shown in Figure 2(a). It can be observed that the maximum correlation coefficient for ACF is 1 at lag 0 (
τ
=
0
). Furthermore, correlation coefficients for other lags were distributed within the 95% confidence limit. The results were in agreement with the white noise auto-correlation definition where δ( )
τ =1 when0
=
τ
, and δ( )
τ =0 whenτ
≠0. Findings for CCF test as depicted in Figure 2(b) shows that correlation coefficients were within the boundary of 95% confidence limit for all lags except atτ
=0 in training dataset. Whereas, the validation and testing datasets showed that coefficients of cross-correlation are within the boundary of 95% confidence limit for all lags. These findings suggested that the residuals were uncorrelated with the actual output for all lags. Overall, the correlation tests on the network model revealed that the model is valid and acceptable for practical implementation. [image:4.612.90.300.462.540.2]ISSN: 1992-8645 www.jatit.org E-ISSN: 1817-3195
47
0 2 4 6 8 10 12 14 16 18 20
−0.5 0 0.5 1
Auto−correlation training
0 2 4 6 8 10 12 14 16 18
−0.5 0 0.5 1
Sample Autocorrelation
Auto−correlation validation
0 2 4 6 8 10 12 14 16 18
−0.5 0 0.5 1
Lag Auto−correlation testing
(a)
−20 −15 −10 −5 0 5 10 15 20
−0.5 0 0.5
Cross−correlation training
−20 −15 −10 −5 0 5 10 15 20
−0.5 0 0.5
Sample Cross Correlation
Cross−correlation validation
−20 −15 −10 −5 0 5 10 15 20
−0.5 0 0.5
Lag Cross−correlation testing
(b)
0 5 10 15 20 25 30 35 40 45 50
0 0.5 1 1.5 2 2.5 3 3.5 4
Predicted IQ
Samples
[image:5.612.87.319.69.465.2]Predicted IQ before threshold Predicted IQ after threshold Figure 2: (a) ACF and (b) CCF Tests During Training,
Validation, and Testing of Network Model.
3.3 Evaluation On The Relationship Between IQ And BA Using IQ Classification Model
The distributions of predicted IQ levels from BA dataset are as depicted in Figure 3. It can be observed that IQ levels for 48 out of 50 samples were successfully predicted between the ranges of threshold limit from 0.5 to 3.5. These are marked with asterisks (*). After employing the threshold, it
is observed that two samples, who are sample number 10 and 26 have predicted IQ over the limit of 3.5. Therefore, the predicted IQ falls to zero, which were considered as unclassified IQ.
[image:5.612.308.524.289.439.2]Figure 3: Predicted IQ Levels from BA Dataset using Power Ratio Features with IQ Classification Model. Subsequently, Figure 4 shows the relationship between both cognitive abilities; IQ levels (low, medium, high) and BA indices (BA1-poorly balanced, BA2-moderately balanced and BA3-highly balanced).
Figure 4: Relationship between BA Indices; (Poorly Balanced, Moderately Balanced, and Highly Balanced)
and Distinct IQ Levels using Power Ratio Features.
Results have revealed that low IQ level is dominant compared to the other two IQ levels. Percentage of samples in poorly balanced shows a decreasing pattern with increasing intelligence levels. Similar trend was observed in moderately balanced state. However, the difference between low and medium IQ levels was not that significant. As expected, percentage of high IQ levels was dominant in highly balanced state. Furthermore, no sample was mapped to low IQ level in highly balanced condition. This indicates that best IQ can be obtained when samples maintain relatively balanced control between the two hemispheres. Hence, the findings revealed that through a systematic technique; significant relationship exists between distinct IQ levels and symmetrical brain indices which lead to continuous attempt to use the brain more effectively [12, 20-25].
ISSN: 1992-8645 www.jatit.org E-ISSN: 1817-3195
48 The proposed study has been proven that the mapping between IQ and brain asymmetry using IQ classification model is realisable with promising results. As such, the different symmetrical brain conditions can be mapped to distinct IQ levels using the PR features with the established network model. Findings have demonstrated that the best performance occurs when subjects maintain relatively balanced control between the two hemispheres.
ACKNOWLEDGMENTS
This work was supported by the Ministry of Higher Education Grant No.: 600-RMI/FRGS 5/3 (72/2012) and Grant No: 600-RMI/RAGS 5/3 (48/2012) and Faculty of Electrical Engineering, Universiti Teknologi MARA, Malaysia. The first author also expresses her gratitude to the Ministry of Higher Education Malaysia for supporting her studies through the MyBrain15 scholarship programme.
REFRENCES:
[1] A. J. Casson, D. Yates, S. Smith, J. S. Duncan, and
E. Rodriguez-Villegas, "Wearable
Electroencephalography," Engineering in Medicine
and Biology Magazine, IEEE, Vol. 29, No. 3, 2010, pp. 44-56.
[2] S. Haykin and B. Kosko, "Special Issue On Intelligent Signal Processing," Proceedings of the IEEE, Vol. 86, No. 11, 1998, pp. 2119-2120. [3] V. V. Moca, B. Scheller, R. C. Muresan, M.
Daunderer, and G. Pipa, "EEG under
anesthesia--feature extraction with TESPAR," Computer
Methods and Programs in Biomedicine, Vol. 95, No. 3, 2009, pp. 191-202.
[4] M. Ronzhina, O. Janousek, J. Kolarova, M. Novakova, P. Honzik, and I. Provaznik, "Sleep scoring using artificial neural networks," Sleep Medicine Reviews, Vol. 16, No. 3, 2012, pp. 251-263.
[5] J. Kuruvilla and K. Gunavathi, "Lung cancer classification using neural networks for CT images,"
Computer Methods and Programs in Biomedicine,
Vol. 113, No. 1, 2014, pp. 202-209.
[6] F. Amato, A. López, E. M. Peña-Méndez, P. Vaňhara, A. Hampl, and J. Havel, "Artificial neural networks in medical diagnosis," Journal of Applied Biomedicine, Vol. 11, No. 2, 2013, pp. 47-58. [7] T. Faisal, F. Ibrahim, and M. N. Taib, "A
noninvasive intelligent approach for predicting the
risk in dengue patients," Expert Systems with
Applications, Vol. 37, No. 3, 2010, pp. 2175-2181.
[8] P. J. Lisboa, "A review of evidence of health benefit
from artificial neural networks in medical
intervention," Neural Networks, Vol. 15, No. 1, 2002, pp. 11-39.
[9] J. L. Amaral, A. J. Lopes, J. M. Jansen, A. C. Faria, and P. L. Melo, "An improved method of early diagnosis of smoking-induced respiratory changes
using machine learning algorithms," Computer
Methods and Programs in Biomedicine, Vol. 112, No. 3, 2013, pp. 441-454.
[10] S.-Q. Shi, W. L. Maner, L. B. Mackay, and R. E. Garfield, "Identification of term and preterm labor in rats using artificial neural networks on uterine
electromyography signals," American Journal of
Obstetrics and Gynecology, Vol. 198, No. 2, 2008, pp. 235.e231-235.e234.
[11] S. Haykin, Neural networks: a comprehensive
foundation, 2nd ed. Singapore: Prentice Hall PTR, 1994.
[12] D. Vernon, Human potential: Exploring techniques used to enhance human performance, 1 ed. Hoboken: Taylor and Francis, 2009.
[13] S. B. Kaufman, C. G. DeYoung, J. R. Gray, J. Brown, and N. Mackintosh, "Associative learning predicts intelligence above and beyond working memory and processing speed," Intelligence, Vol. 37, No. 4, 2009, pp. 374-382.
[14] B. H. Dobkin, "Rehabilitation after stroke," New England Journal of Medicine, Vol. 352, No. 16, 2005, pp. 1677-1684.
[15] N. Sharma and T. Gedeon, "Objective measures, sensors and computational techniques for stress recognition and classification: a survey," Computer Methods and Programs in Biomedicine, Vol. 108, No. 3, 2012, pp. 1287-1301.
[16] R. J. Sternberg, "Intelligence," Wiley
Interdisciplinary Reviews: Cognitive Science, Vol. 3, No. 5, 2012, pp. 501-511.
[17] R. Colom, S. Karama, R. E. Jung, and R. J. Haier, "Human intelligence and brain networks," Dialogues in Clinical Neuroscience, Vol. 12, No. 4, 2010, p. 489.
[18] R. Grabner, A. Fink, A. Stipacek, C. Neuper, and A. Neubauer, "Intelligence and working memory systems: evidence of neural efficiency in alpha band ERD," Cognitive Brain Research, Vol. 20, No. 2, 2004, pp. 212-225.
[19] A. W. Toga and P. M. Thompson, "Mapping brain asymmetry," Nature Reviews Neuroscience, Vol. 4, No. 1, 2003, pp. 37-48.
[20] P. E. Vernon, "Intelligence, cognitive styles, and
brain lateralization," International Journal of
Psychology, Vol. 19, No. 1-4, 1984, pp. 435-455. [21] A. Fink, R. H. Grabner, M. Benedek, G. Reishofer,
ISSN: 1992-8645 www.jatit.org E-ISSN: 1817-3195
49
means of EEG and fMRI," Human Brain Mapping,
Vol. 30, No. 3, 2009, pp. 734-748.
[22] A. C. Neubauer and A. Fink, "Intelligence and neural efficiency: Measures of brain activation versus measures of functional connectivity in the brain," Intelligence, Vol. 37, No. 2, 2009, pp. 223-229.
[23] M. Doppelmayr, W. Klimesch, W. Stadler, D. Pöllhuber, and C. Heine, "EEG alpha power and intelligence," Intelligence, Vol. 30, No. 3, 2002, pp. 289-302.
[24] W. Klimesch, "EEG alpha and theta oscillations reflect cognitive and memory performance: a review and analysis," Brain Research Reviews, Vol. 29, No. 2–3, 1999, pp. 169-195.
[25] E. Tamez, J. Myerson, and S. Hale, "Contributions of associative learning to age and individual differences in fluid intelligence," Intelligence, Vol. 40, No. 5, 2012, pp. 518-529.
[26] O. Razoumnikova, "Interaction of personality and intelligence factors in cortex activity modulation,"
Personality and Individual Differences, Vol. 35, No. 1, 2003, pp. 135-162.
[27] S. S. Sparrow and S. M. Davis, "Recent advances in the assessment of intelligence and cognition,"
Journal of Child Psychology and Psychiatry, Vol. 41, No. 1, 2000, pp. 117-131.
[28] D. A. Peterson and M. H. Thaut, "Music increases frontal EEG coherence during verbal learning,"
Neuroscience Letters, Vol. 412, No. 3, 2007, pp. 217-221.
[29] I. M. Gómez-Chacón, J. A. García-Madruga, J. Ó. Vila, M. R. Elosúa, and R. Rodríguez, "The dual processes hypothesis in mathematics performance: Beliefs, cognitive reflection, working memory and reasoning," Learning and Individual Differences,
Vol. 29, No. 0, 2014, pp. 67-73.
[30] T. Vogt, S. Schneider, V. Abeln, V. Anneken, and H. K. Strüder, "Exercise, mood and cognitive
performance in intellectual disability—A
neurophysiological approach," Behavioural Brain
Research, Vol. 226, No. 2, 2012, pp. 473-480. [31] N. L. Lopez-Duran, R. Nusslock, C. George, and M.
Kovacs, "Frontal EEG asymmetry moderates the effects of stressful life events on internalizing symptoms in children at familial risk for depression," Psychophysiology, Vol. 49, No. 4, 2012, pp. 510-521.
[32] B. Schmidt and S. Hanslmayr, "Resting frontal EEG alpha-asymmetry predicts the evaluation of affective musical stimuli," Neuroscience Letters, Vol. 460, No. 3, 2009, pp. 237-240.
[33] G. Wiedemann, P. Pauli, W. Dengler, W. Lutzenberger, N. Birbaumer, and G. Buchkremer, "Frontal brain asymmetry as a biological substrate of emotions in patients with panic disorders," Archives of General Psychiatry, Vol. 56, No. 1, 1999, pp. 78-84.
[34] J. A. Coan and J. J. Allen, "Frontal EEG asymmetry as a moderator and mediator of emotion," Biological Psychology, Vol. 67, No. 1, 2004, pp. 7-50. [35] M. Mikolajczak, K. Bodarwé, O. Laloyaux, M.
Hansenne, and D. Nelis, "Association between frontal EEG asymmetries and emotional intelligence
among adults," Personality and Individual
Differences, Vol. 48, No. 2, 2010, pp. 177-181. [36] M. Çiçek and E. Nalçacı, "Interhemispheric
asymmetry of EEG alpha activity at rest and during the Wisconsin Card Sorting Test: relations with performance," Biological Psychology, Vol. 58, No. 1, 2001, pp. 75-88.
[37] A. J. Hughes and B. J. Rutherford, "Hemispheric interaction, task complexity, and emotional valence:
Evidence from naturalistic images," Brain and
Cognition, Vol. 81, No. 2, 2013, pp. 167-175. [38] T. Egner and J. H. Gruzelier, "The temporal
dynamics of Electroencephalographic responses to alpha/theta neurofeedback training in healthy subjects," Journal of Neurotherapy, Vol. 8, No. 1, 2004, pp. 43-57.
[39] V. V. Busato, F. J. Prins, J. J. Elshout, and C. Hamaker, "Intellectual ability, learning style, personality, achievement motivation and academic success of psychology students in higher education,"
Personality and Individual Differences, Vol. 29, No. 6, 2000, pp. 1057-1068.
[40] S. Makeig, K. Gramann, T.-P. Jung, T. J. Sejnowski, and H. Poizner, "Linking brain, mind and behavior,"
International Journal of Psychophysiology, Vol. 73, No. 2, 2009, pp. 95-100.
[41] A. H. Jahidin, M. S. A. Megat Ali, M. N. Taib, N. Md. Tahir, I. M. Yassin, and S. Lias, "Classification of intelligence quotient via brainwave sub-band power ratio features and artificial neural network,"
Computer Methods and Programs in Biomedicine,
Vol. 114, No. 1, 2014, pp. 50-59.
[42] A. H. Jahidin, M. N. Taib, N. Md Tahir, M. S. A. Megat Ali, S. Lias, N. Fuad, and W. R. W. Omar, "Brainwave sub-band power ratio characteristics in
intelligence assessment," in IEEE Control and
System Graduate Research Colloquium (ICSGRC), 2012, pp. 318-321.
[43] A. C. Neubauer and A. Fink, "Intelligence and neural efficiency," Neuroscience & Biobehavioral Reviews, Vol. 33, No. 7, 2009, pp. 1004-1023. [44] M. J. van Putten and D. L. Tavy, "Continuous
quantitative EEG monitoring in hemispheric stroke patients using the brain symmetry index," Stroke,
Vol. 35, No. 11, 2004, pp. 2489-2492.
[45] Z. Li Feng, Z. Quan Min, and A. Longden, "A correlation-test-based validation procedure for identified neural networks," IEEE Transactions on Neural Networks, Vol. 20, No. 1, 2009, pp. 1-13. [46] M. Nørgaard, O. Ravn, N. K. Poulsen, and L. K.
Hansen, Neural networks for modelling and control
ISSN: 1992-8645 www.jatit.org E-ISSN: 1817-3195
50
[47] M. N. Taib and R. Narayanaswamy, "Multichannel calibration technique for optical-fibre chemical sensor using artificial neural network," Sensors and Actuators B: Chemical, Vol. 39, No. 1–3, 1997, pp. 365-370.
[48] M. Pardo and G. Sberveglieri, "Learning from data: A tutorial with emphasis on modern pattern recognition methods," IEEE Sensors Journal, Vol. 2, No. 3, 2002, pp. 203-217.
[49] S. A. Kalogirou, "Applications of artificial neural-networks for energy systems," Applied Energy, Vol. 67, No. 1–2, 2000, pp. 17-35.
[50] L. Prechelt, "Automatic early stopping using cross
validation: quantifying the criteria," Neural