Journal of Chemical and Pharmaceutical Research
__________________________________________________
ISSN No: 0975-7384 CODEN(USA): JCPRC5
J. Chem. Pharm. Res., 2010, 2(5):626-641
626
Adsorption dynamics of methylene blue by acid activated carbon
S Arivoli*1,M. Hema2, S Parthasarathy3and N Manju4
1
Department of Chemistry, Thiru Vi Ka Government Arts College, Thiruvarur, India
2
Department of Chemistry, Anna University of Technology, Tiruchirappalli, Thirukkuvalai Campus, India
Department of Chemistry, CARE School of Engineering, Thiruchirapalli, India
4
Department of Chemistry, CARE School of Engineering and Technology, Thiruchirapalli, India
______________________________________________________________________________
ABSTRACT
A carbonaceous adsorbent prepared from an indigenous waste by acid treatment was tested for its efficiency in removing Methylene blue. The parameters studied include agitation time, initial dye concentration, carbon dose, pH and temperature. The adsorption followed first order reaction equation and the rate is mainly controlled by intra-particle diffusion. Freundlich and Langmuir isotherm models were applied to the equilibrium data. The adsorption capacity (Qm)
obtained from the Langmuir isotherm plots were 60.61, 59.95, 62.11 and 62.50 mg/g respectively at an initial pH of 7.0 at 30, 40, 50 and 600C. The temperature variation study showed that the Methylene blue adsorption is endothermic and spontaneous with increased randomness at the solid solution interface. Significant effect on adsorption was observed on varying the pH of the Methylene blue solutions. Almost 68% removal of Methylene blue was observed at 600C. The Langmuir and Freundlich isotherms obtained, positive H0 value, pH dependent results and desorption of dye in mineral acid suggest that the adsorption of Methylene blue on MCC involves physisorption mechanism.
Key words: Activated carbon (MCC), Methylene blue (MB), Adsorption isotherm, Equilibrium,
Kinetic and Thermodynamic parameters, Intraparticle diffusion, Regeneration pattern.
627
INTRODUCTION
The concentration and effective utilization of activated carbon generated from natural plant material have attracted worldwide attention in a view of the large disposal problem without detriment to environment. Many investigators have studied the feasibility of using inexpensive alternative materials like pearl millet husk, date pits, saw dust buffing dust of leather industry, coir pith, crude oil residue tropical grass, olive stone and almond shells, pine bark, wool waste, coconut shell etc., as carbonaceous precursors for the removal of dyes from water and wastewater [1,2,3].
The present study undertaken to evaluate the efficiency of a carbon adsorbent prepared from acid activated morinda coreia buch-ham bark carbon (MCC) for the removal of Methylene blue dye in aqueous solution. In order to design adsorption treatment systems, knowledge of kinetic and mass transfer processes is essential. In this paper, we have reported the applicability of kinetic and mass-transfer models for the adsorption of Methylene blue onto acid activated carbon.
EXPERIMENTAL SECTION
Materials
2.1 Adsorbent Materials
The dried morinda coreia buch-ham bark was carbonized with concentrated sulphuric acid in the weight ratio of 1:1 (w/v). Heating for six hours in a furnace at 400°C has completed the carbonization and activation. The resulting carbon was washed with distilled water until a constant pH of the slurry was reached. Then the carbon was dried for four hours at 120°C in a hot air oven. The dried material was ground well to a fine powder and sieved.
Adsorption dynamic experiments 3.1 Batch equilibration method
The adsorption experiments were carried out in a batch process at 30, 40, 50 and 60˚ C temperatures. The known weight of adsorbent material was added to 50 ml of the dye solutions with an initial concentration of 20 mg/L to 100 mg/L. The contents were shaken thoroughly using a mechanical shaker rotating with a speed of 120 rpm. The solution was then filtered at preset time intervals and the residual dye concentration was measured.
3.2 Effect of variable parameters 3.2.1 Dosage of adsorbents
The various doses of the adsorbents are mixed with the dye solutions and the mixture was agitated in a mechanical shaker. The adsorption capacities for different doses were determined at definite time intervals by keeping all other factors constant.
3.2.2 Initial concentration of dye
628
3.2.3 Contact time
The effect of period of contact on the removal of the dye on adsorbent in a single cycle was determined by keeping particle size, initial concentration, dosage, pH and concentration of other ions constant.
3.2.4 pH
Adsorption experiments were carried out at pH 3 - 10. The acidic and alkaline pH of the media was maintained by adding the required amounts of dilute hydrochloric acid and sodium hydroxide solutions. The parameters like particle size of the adsorbents, dye concentration, dosage of the adsorbent and concentration of other ions have kept constant while carrying out the experiments. The pH of the samples was determined using a portable pH meter, Systronics make. The pH meter was calibrated with 4.0 and 9.2 buffers.
3.2.5 Chloride
The experiments were done in the presence of varying chloride environments using various sodium chloride solutions. While doing the experiments, the absence of other anions has ensured.
3.2.6 Temperature
The adsorption experiments were performed at four different temperatures viz., 30, 40, 50 and 60˚C in a thermostat attached with a shaker, Remi make. The constancy of the temperature was maintained with an accuracy of ± 0.5º C.
3.2.7 Zero point charge
The pH at the potential of zero charge of the carbon (pHzpc) was measured using the pH drift method [4]. The pH of the solution was adjusted by using 0.01 M sodium hydroxide or hydrochloric acid. Nitrogen was bubbled through the solution at 250C to remove the dissolved carbon dioxide. 50 mg of the activated carbon was added to 50 ml of the solution. After stabilization, the final pH was recorded. The graphs of final pH versus initial pH used to determine the zero point charge of the activated carbon.
3.2.8 Titration studies
629
3.2.9 Desorption studies
Desorption studies help to elucidate the nature of adsorption and recycling of the spent adsorbent and the dye. The effect of various reagents used for desorption are studied.
RESULTS AND DISCUSSION
4.1 Characterization of the adsorbent
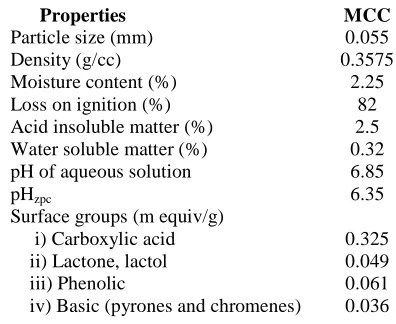
[image:4.595.194.392.301.463.2]Activated carbons are a widely used adsorbent due to its high adsorption capacity, high surface area, micro porous structure and high degree of surface respectively. The wide usefulness of carbon is a result of their specific surface area, high chemical and mechanical stability. The chemical nature and pore structure usually determines the sorption activity. The physico chemical properties of the chosen adsorbent are listed in Table 1
Table 1-Characteristics of the adsorbent
Properties MCC
Particle size (mm) 0.055
Density (g/cc) 0.3575
Moisture content (%) 2.25
Loss on ignition (%) 82
Acid insoluble matter (%) 2.5 Water soluble matter (%) 0.32 pH of aqueous solution 6.85
pHzpc 6.35
Surface groups (m equiv/g)
i) Carboxylic acid 0.325 ii) Lactone, lactol 0.049
iii) Phenolic 0.061
iv) Basic (pyrones and chromenes) 0.036
4.2 Effect of contact time and initial dye concentration
630
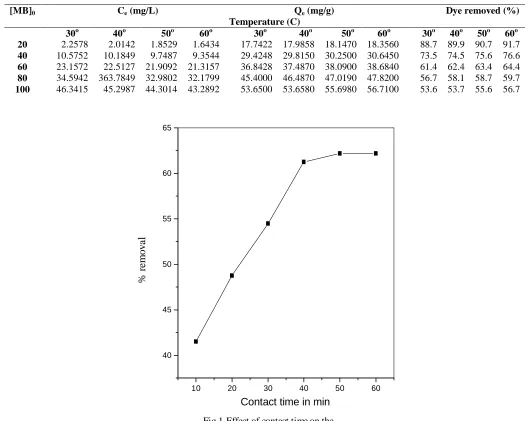
Table 2- Equilibrium parameters for the adsorption of Dye onto activated Carbon
[MB]0 Ce (mg/L) Qe (mg/g) Dye removed (%)
Temperature (C)
30o 40o 50o 60o 30o 40o 50o 60o 30o 40o 50o 60o 20 2.2578 2.0142 1.8529 1.6434 17.7422 17.9858 18.1470 18.3560 88.7 89.9 90.7 91.7
40 10.5752 10.1849 9.7487 9.3544 29.4248 29.8150 30.2500 30.6450 73.5 74.5 75.6 76.6
60 23.1572 22.5127 21.9092 21.3157 36.8428 37.4870 38.0900 38.6840 61.4 62.4 63.4 64.4
80 34.5942 363.7849 32.9802 32.1799 45.4000 46.4870 47.0190 47.8200 56.7 58.1 58.7 59.7
100 46.3415 45.2987 44.3014 43.2892 53.6500 53.6580 55.6980 56.7100 53.6 53.7 55.6 56.7
10 20 30 40 50 60
[image:5.595.33.558.124.545.2]40 45 50 55 60 65
Fig.1-Effect of contact time on the adsorption of methylene blue onto MCC [MG]=60mg/L;Adsorbent dose=50 mg/50ml;pH=7
%
r
em
o
v
a
l
631
0 50 100 150 200 250
40 50 60 70 80 90
Fig.2-Effect adsorbent dose on the adsorption of methylene blue onto MCC
[MG]=60mg/L;Contact time=60 min;pH=7
%
r
e
m
o
v
al
Adsorbent dose in mg
4.3 Effect of carbon concentration:
The adsorption of the Methylene blue dye on carbon was studied by varying the carbon concentration (10-250 mg/50ml) for 60 mg/L of dye concentration. The percent adsorption increased with increase in the carbon concentration (Figure 2). This was attributed to increased carbon surface area and availability of more adsorption sites [5,6]. Hence the entire studies are carried out with the adsorbent dose of 50 mg of adsorbent /50 ml of the adsorbate solution.
4.4 Adsorption isotherm
The experimental data analyzed according to the linear form of the Langmuir and Freundlich isotherms [7,8]. The Langmuir isotherm represented by the following equation
C e/Q e = 1/Qmb + Ce /Qm
632
temperature. From the values we can conclude that the maximum adsorption corresponds to a saturated monolayer of adsorbate molecules on adsorbent surface with constant energy and no transmission of adsorbate in the plane of the adsorbent surface. The observed b values shows that the adsorbent prefers to bind acidic ions and that speciation predominates on sorbent characteristics, when ion exchange is the predominant mechanism takes place in the adsorption of Methylene blue, it confirms the endothermic nature of the process involved in the system [9,10,11]. To confirm the favourability of the adsorption process, the separation factor (RL) was calculated and presented in Table 4. The values were found to be between 0 and 1 and confirm that the ongoing adsorption process is favorable [12].
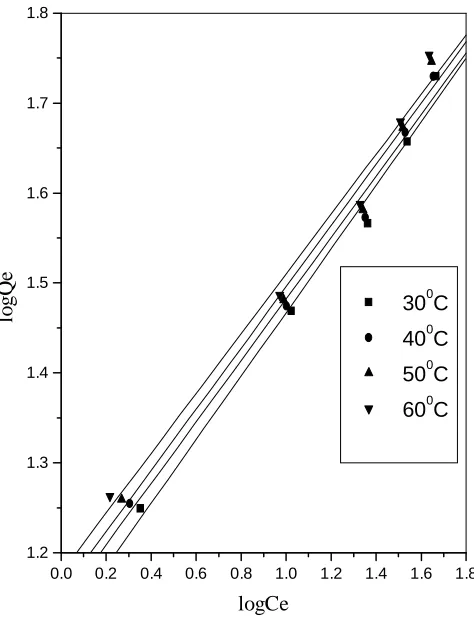
The Freundlich equation was employed for the adsorption of Methylene blue on the adsorbent. The Freundlich isotherm was represented by
log Qe = log Kf + 1/n log Ce
633
0 10 20 30 40 50
0.0 0.1 0.2 0.3 0.4 0.5 0.6 0.7 0.8 0.9
Fig.3-Langmuir isotherm for the adsorption of methylene blue by MCC
300C
400C
500C
600C
C
e
/Q
e
634
0.0 0.2 0.4 0.6 0.8 1.0 1.2 1.4 1.6 1.8
[image:9.595.180.417.119.429.2]1.2 1.3 1.4 1.5 1.6 1.7 1.8
Fig.4-Freundlich isotherm for the adsorption of methylene blue onto MCC
300C
400C
500C
600C
lo
g
Q
e
logCe
Table 3 - Langmuir isotherm results
Dye Temp Statistical parameters/constants
0
C r2 Qm b
MB 30 0.9758 60.61 0.1078
40 0.9787 59.95 0.1141
50 0.9756 62.11 0.1137
60 0.9737 62.50 0.1218
Table 4 Dimensionless Separation factor (RL)
Temperature (0C)
[MB]0 30 40 50 60
(mg/L)
20 0.316 0.304 0.305 0.290
40 0.189 0.179 0.181 0.171
60 0.134 0.127 0.128 0.120
80 0.104 0.098 0.099 0.093
100 0.084 0.080 0.081 0.076
635
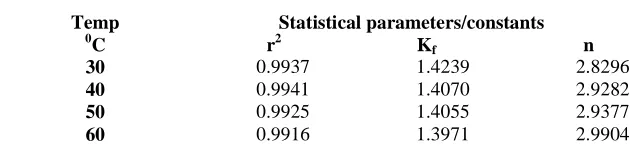
Table 5 - Freundlich isotherm results
Dye Temp Statistical parameters/constants
0C r2 K
f n
MB 30 0.9937 1.4239 2.8296
40 0.9941 1.4070 2.9282
50 0.9925 1.4055 2.9377
60 0.9916 1.3971 2.9904
4.5 Effect of temperature
The adsorption capacity of the carbon increased with increase in the temperature of the system from 30°-60°C. Thermodynamic parameters such as change in free energy (∆G°) (kJ/mol), enthalpy (∆H°)(kJ/mol) and entropy (∆S°)(J/K/mol) were determined using the following equations
K0 = Csolid/Cliquid ∆G° = -RT lnKO
logK0 = ∆S°/ (2.303RT) - ∆H°/(2.303RT)
Where Ko is the equilibrium constant, Csolid is the solid phase concentration at equilibrium (mg/ L), Cliquid is the liquid phase concentration at equilibrium (mg/L), T is the temperature in Kelvin and R is the gas constant. The ∆H° and ∆S° values obtained from the slope and intercept of Van’t Hoff plots have presented in Table 6. The values ∆H° are with in the range of 1 to 93 KJ/mol indicates the physisorption. From the results we could make out that physisorption is much more favorable for the adsorption of Methylene blue. The positive values of ∆H° show the endothermic nature of adsorption and it governs the possibility of physical adsorption [11,13]. Because in the case of physical adsorption, while increasing the temperature of the system, the extent of Methylene blue dye adsorption increases, this rules out the possibility of chemisorption [13]. The low ∆H° value depicts dye is physisorbed onto adsorbent MCC.
The negative values of ∆G° (Table 6) shows the adsorption is highly favorable and spontaneous. The positive values of ∆S° (Table 6) shows the increased disorder and randomness at the solid solution interface of Methylene blue with MCC adsorbent, while the adsorption there are some structural changes in the dye and the adsorbent occur. The adsorbed water molecules, which have displaced by the adsorbate species, gain more translational entropy than is lost by the adsorbate molecules, thus allowing the prevalence of randomness in the system. The enhancement of adsorption capacity of the activated carbon at higher temperatures was attributed to the enlargement of pore size and activation of the adsorbent surface [12,13,14].
4.6 Kinetics of adsorption
The kinetics of sorption describes the solute uptake rate, which in turn governs residence time or sorption reaction. It is one of the important characteristics in defining the efficiency or sorption. In the present study, the kinetics of the dye removal was carried out to understand the behaviour of these low cost carbon adsorbents. The adsorption of dye from an aqueous follows reversible first order kinetics, when a single species are considered on a heterogeneous surface. The heterogeneous equilibrium between the dye solutions and the activated carbon are expressed as
636 A B k2
Where k1 is the forward rate constant and k2 is the backward rate constant. A represents Methylene blue dye remaining in the aqueous solution and B represent Methylene blue dye adsorbed on the surface of activated carbon. The equilibrium constant (K0) is the ration of the concentration adsorbate in adsorbent and in aqueous solution (K0=k1/k2).
In order to study the kinetics of the adsorption process under consideration the following kinetic equation proposed by Natarajan and Khalaf as cited in literature has been employed [1].
log C0/Ct=(Kad/2.303)t
Where C0 and Ct are the concentration of the dye in (in mg/L) at time zero and at time t, respectively. The rate constants (Kad) for the adsorption processes have been calculated from the slope of the linear plots of log C0/Ct versus t for different concentrations and temperatures. The determination of rate constants as described in literature given by
Kad=k1+k2=k1+(k1/K0)=k1[1+1/K0]
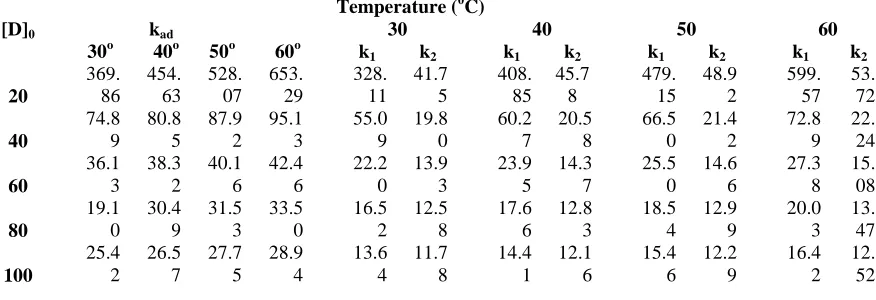
The overall rate constant kad for the adsorption of dye at different temperatures are calculated from the slopes of the linear Natarajan-Khalaf plots. The rate constant values are collected in Table 7 shows that the rate constant (kad) increases with increase in temperature suggesting that the adsorption process in endothermic in nature. Further, kad values decrease with increase in initial concentration of the dye. In cases of strict surface adsorption a variation of rate should be proportional to the first power of concentration. However, when pore diffusion limits the adsorption process, the relationship between initial dye concentration and rate of reaction will not be linear. Thus, in the present study pore diffusion limits the overall rate of dye adsorption. The over all rate of adsorption is separated into the rate of forward and reverse reactions using the above equation. The rate constants for the forward and reverse processes are also collected in Table 7 indicate that, at all initial concentrations and temperatures, the forward rate constant is much higher than the reverse rate constant suggesting that the rate of adsorption is clearly dominant [1,11,13].
Table 6 Equilibrium constant and thermodynamic parameters for the adsorption of Methylene blue dyes onto carbon
[M B]0
K0 ∆Go
∆Ho ∆So
Temperature (0C)
30o 40o
50o 60o 30o
40o
50o 60o
20 7.85 8.92 9.79 11.16 -5.70 -4.39 -6.12 -6.68 13.72 68.27
40 2.78 2.92 3.10 3.27 -2.57 -2.79 -3.04 -3.28 9.51 48.51
60 1.59 1.66 1.74 1.81 -1.17 -1.32 -1.48 -1.64 6.20 33.65
80 1.31 1.37 1.42 1.48 -0.68 -0.83 -0.95 -1.09 4.73 26.51
637
Table 7 - Rate constants for the adsorption of Methylene blue dye (103 kad, min -1) and the constants for forward (103 k1, min –1) and reverse (103 k2, min-1) process
Temperature (0C)
[D]0 kad 30 40 50 60
30o 40o 50o 60o k1 k2 k1 k2 k1 k2 k1 k2
20 369. 86 454. 63 528. 07 653. 29 328. 11 41.7 5 408. 85 45.7 8 479. 15 48.9 2 599. 57 53. 72 40 74.8 9 80.8 5 87.9 2 95.1 3 55.0 9 19.8 0 60.2 7 20.5 8 66.5 0 21.4 2 72.8 9 22. 24 60 36.1 3 38.3 2 40.1 6 42.4 6 22.2 0 13.9 3 23.9 5 14.3 7 25.5 0 14.6 6 27.3 8 15. 08 80 19.1 0 30.4 9 31.5 3 33.5 0 16.5 2 12.5 8 17.6 6 12.8 3 18.5 4 12.9 9 20.0 3 13. 47 100 25.4 2 26.5 7 27.7 5 28.9 4 13.6 4 11.7 8 14.4 1 12.1 6 15.4 6 12.2 9 16.4 2 12. 52
4.7 Intraparticle diffusion
The most commonly used technique for identifying the mechanism involved in the sorption process is by fitting the experimental data in an intraparticle diffusion plot. Previous studies by various researchers showed that the plot of Qt versus t0.5 represents multi linearity, which characterizes the two or more steps involved in the sorption process. According to Weber and Morris, an intraparticle diffusion coefficient Kp is defined by the equation:
Kp=Q/t0.5
638
3 4 5 6 7 8
35.6 35.8 36.0 36.2 36.4 36.6 36.8 37.0
Fig.5-Intraparticle diffusion effect on the adsorption of methylene blue onto MCC
[MG]= 60 mg/L;Contact time = 60 min;Adsorbent dose=50mg/50ml
%
r
e
m
o
v
al
Time0.5
4.8 Effect of pH
pH is one of the most important parameters controlling the adsorption process. The effect of pH of the solution on the adsorption of Methylene blue ions on MCC was determined. The result is shown in Fig. 6. The pH of the solution was controlled by the addition of HCl or NaOH. The uptake of Methylene blue ions at pH 8.0 was the minimum and a maximum in uptake was obtained at pH 3.00. However, when the pH of the solution was increased (more than pH 9), the uptake of Methylene blue ions was increased. It appears that a change in pH of the solution results in the formation of different ionic species, and different carbon surface charge. At pH values lower than 5, the Methylene blue ions can enter into the pore structure. At a pH value higher than 7, the zwitterions form of Methylene blue in water may increase the aggregation of Methylene blue to form a bigger molecular form (dimer) and become unable to enter into the pore structure of the carbon surface. The greater aggregation of the zwitterionic form is due to the attractive electrostatic interaction between the ionic groups of the monomer.
639
2 3 4 5 6 7 8 9 10 11
50 55 60 65 70 75 80
Fig.6-Effect of pH on the adsorption of methylene blue onto MCC
[MG]=60mg/L;Contact time=60 min;Adsorbent dose=50 mg/50 ml
%
r
em
o
v
a
l
pH
4.9 Effect of the ionic strength on the adsorption of Methylene blue on MCC
640
0 50 100 150 200 250
62 64 66 68 70 72 74 76 78 80
Fig.7-Effect of other ion on the adsorption of methylene blue by MCC [MG]=60 mg/L;Contact time=60 min;Adsorbent dose=50 mg/50 ml
%
r
e
m
o
v
a
l
Con of Chloride ion in mg/L
4.10 Desorption studies
Desorption studies help to elucidate the nature of adsorption and recycling of the spent adsorbent and the dye. If the adsorbed dyes can be desorbed using neutral pH water, then the attachment of the dye of the adsorbent is by weak bonds. If sulphuric acid or alkaline water desorp the dye then the adsorption is by ion exchange. If organic acids, like acetic acid can desorp the dye, then the dye has held by the adsorbent through chemisorption. The effect of various reagents used for desorption studies indicate that hydrochloric acid is a better reagent for desorption, because we could get more than 68% removal of adsorbed dye. The reversibility of adsorbed dye in mineral acid or base is in agreement with the pH dependent results obtained. The desorption of Methylene blue dye by mineral acids and alkaline medium indicates that the dyes were adsorbed onto the activated carbon through by physisorption mechanisms [12,18].
CONCLUSION
641
removal of Methylene blue from aqueous solution. The values of ∆H°, ∆S° and ∆G° results shows that the carbon employed has a considerable potential as an adsorbent for the removal of Methylene blue.
Acknowledgement
The authors acknowledge sincere thanks to Mrs. Mala Arivoli, The Principal, M.R.Government Arts College, Mannargudi and The Director of Collegiate Education, Chennai for carrying out this research work successfully.
REFERENCES
[1]Arivoli S, Kinetic and thermodynamic studies on the adsorption of some metal ions and dyes onto low cost activated carbons, Ph D., Thesis, Gandhigram Rural University, Gandhigram,
2007.
[2]Sekaran G, Shanmugasundaram K A, Mariappan M and Raghavan K V, Indian J Chem
Technol, 1995, 2, 311.
[3]Selvarani K, Studies on Low cost Adsorbents for the removal of organic and Inorganics from Water, Ph D., Thesis, Regional Engineering College, Thiruchirapalli, 2000.
[4]Jia Y F and Thomas K K, Langmuir, 2002, 18, 470-478.
[5]Namasivayam C, Muniasamy N, Gayathri K, Rani M and Renganathan K, Biores Technol,
1996, 57, 37.
[6]Namasivayam C and Yamuna R T, Environ Pollut, 1995, 89, 1. [7]Langmuir I, J Amer Chem Soc, 1918, 40, 1361.
[8]Freundlich H, Phys Chemie, 1906, 57, 384.
[9]Krishna D G and Bhattacharyya G, Appl Clay Sci, 2002, 20, 295.
[10]Arivoli S, Viji Jain M and Rajachandrasekar T, Mat Sci Res India, 2006, 3, 241-250. [11]Arivoli S and Hema M, Intern J Phys Sci., 2007, 2, 10-17.
[12]Arivoli S, Venkatraman B R, Rajachandrasekar T and Hema M, Res J Chem Environ. 2007, 17, 70-78.
[13]Arivoli S, Kalpana K, Sudha R and Rajachandrasekar T, E J Chem, 2007, 4, 238-254. [14]Renmin Gong, Yingzhi Sun, Jian Chen, Huijun Liu, Chao yang, Dyes and Pigments, 2005, 67, 179.
[15]Vadivelan V, Vasanthkumar K, J Colloid Interf Sci, 2005, 286, 91.
[16]Weber W J, Principle and Application of Water Chemistry, edited by Faust S D and Hunter J V Wiley, New York, 1967.
[17]Yupeng Guo, Jingzhu Zhao, Hui Zhang, Shaofeng Yang, Zichen Wang and Hongding Xu, Dyes and Pigments, 2005, 66, 123-128.