comm
en
t
re
v
ie
w
s
re
ports
de
p
o
si
te
d r
e
se
a
rch
refer
e
e
d
re
sear
ch
interacti
o
ns
inf
o
rmation
Functional classification of proteins for the prediction of cellular
function from a protein-protein interaction network
Christine Brun
*
, François Chevenet
¤
†
, David Martin
¤
*
, Jérôme Wojcik
‡
,
Alain Guénoche
§
and Bernard Jacq
*
Addresses: *Laboratoire de Génétique et Physiologie du Développement, CNRS UMR6545, Parc Scientifique et Technologique de Luminy, Case 907, 13288 Marseille Cedex 9, France. †Centre d'Etude sur le Polymorphisme des Micro-organismes, CNRS/IRD UMR 9926, 911 avenue Agropolis, BP 6450, 34394 Montpellier Cedex 5, France. ‡Hybrigenics SA, 3/5 impasse Reille, 75014 Paris, France. §Institut de Mathématiques de Luminy, CNRS UPR9016, Parc Scientifique et Technologique de Luminy, Case 907, 13288 Marseille Cedex 9, France.
¤ These authors contributed equally to this work.
Correspondence: Bernard Jacq. E-mail: [email protected]
© 2003 Brun et al.; licensee BioMed Central Ltd. This is an Open Access article: verbatim copying and redistribution of this article are permitted in all media for any purpose, provided this notice is preserved along with the article's original URL.
Functional classification of proteins for the prediction of cellular function from a protein-protein interaction network
We here describe PRODISTIN, a new computational method allowing the functional clustering of proteins on the basis of protein-protein interaction data. This method, assessed biologically and statistically, enabled us to classify 11% of the Saccharomyces cerevisiae proteome into several groups, the majority of which contained proteins involved in the same biological process(es), and to predict a cellular function for many otherwise uncharacterized proteins.
Abstract
We here describe PRODISTIN, a new computational method allowing the functional clustering of proteins on the basis of protein-protein interaction data. This method, assessed biologically and statistically, enabled us to classify 11% of the Saccharomyces cerevisiae proteome into several groups, the majority of which contained proteins involved in the same biological process(es), and to predict a cellular function for many otherwise uncharacterized proteins.
Background
Complete genome sequencing makes available a large number of coding protein sequences for which we have little or no functional information. In fact, the function of 30-35% of encoded proteins per completely sequenced genome remains unknown [1]. To decipher the functions of these pro-teins and, more broadly, to propose functional relationships among proteins, new computational methods relying upon genome organization have been developed. The Rosetta Stone method proposes that two proteins in a given proteome are functionally linked when they exist as a single fused polypeptide in another proteome [2,3]. The chromosomal proximity method suggests that genes repeatedly found as neighbors on chromosomes in different organisms may encode functionally related proteins [4-6]. Finally, the phylo-genetic co-inheritance of proteins in several different pro-teomes may indicate their functional link [7]. Although these methods and combinations thereof [8] successfully predict
the function of certain proteins, they suffer from several lim-itations: they are more informative when applied to com-pletely sequenced genomes; they are generally more appropriate for prokaryotic genome organization; and the principles underlying some of them are only valid for a small number of proteins.
Molecular interactions are essential actors for all biological processes. Large-scale studies of protein-protein interactions have been carried out in several organisms to establish inter-action maps and to decipher protein function [9-16]. These large intricate networks now need to be analyzed in detail to extract information related to protein function and to rela-tionships linking cellular processes. Various methods of bio-logical network analysis have been proposed so far. They may, for instance, allow identification of functional modules after network clustering [17], or the assignment of function to pro-teins of unknown function on the basis of the functional
Published: 15 December 2003 Genome Biology 2003, 5:R6
Received: 25 June 2003 Revised: 6 October 2003 Accepted: 14 November 2003 The electronic version of this article is the complete one and can be
annotation of their neighbors [18]. Another way to analyze the interaction network is to compare proteins functionally at the cellular level. This approach would represent a useful complement to sequence-comparison methods, which address function at the molecular level. With this in mind, we propose a new bioinformatics method allowing a functional classification of the proteins according to the identity of their interacting partners.
The method, named PRODISTIN for protein distance based on interactions, was applied to the yeast interactome and sta-tistically evaluated for robustness using several independent
criteria. The analysis of the results obtained demonstrated that proteins are grouped according to their cellular rather than molecular function; proteins involved in the same molecular complex(es), pathway(s) or cellular process(es) are clustered; a sound prediction of cellular function for the uncharacterized proteins is possible. The biological relevance of the obtained predictions is discussed with respect to recent experimental results.
Results
Principle of the PRODISTIN method and classification of the yeast proteome
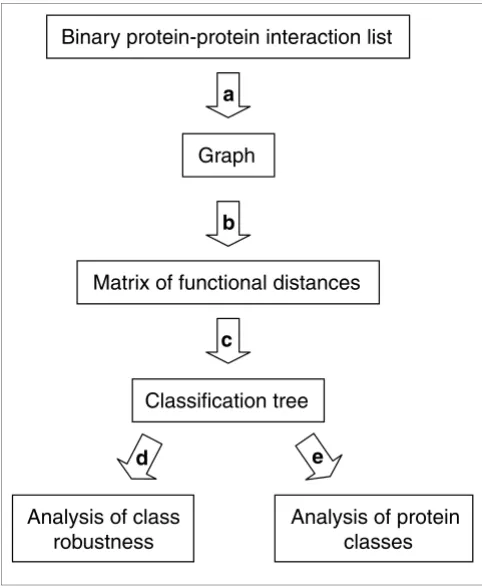
We previously suggested that comparing the sets of interac-tors for different proteins should allow detection of functional similarity independently of the sequence information [19]. We therefore developed the PRODISTIN method based on the principle that the more two proteins share common inter-actors, the more likely they are to be functionally related. In practice, starting from a list of binary protein-protein interac-tions, the PRODISTIN method consists of three different and successive bioinformatic steps (Figure 1, see Materials and methods for details). First, a graph comprising all proteins connected by a specific relation is constructed and a func-tional distance is calculated between all possible pairs of pro-teins in the graph with regard to the number of interactors they share. Second, all distance values are clustered, leading to a classification tree. Third, the tree is visualized and subdi-vided into formal classes. We thus define a PRODISTIN class as the largest possible subtree composed of at least three pro-teins sharing the same functional annotation and represent-ing at least 50% (the absolute majority) of the individual class members for which a functional annotation is available. Classes of proteins are then analyzed for their biological rele-vance and tested for their statistical robustness.
In the first experiment, we analyzed 2,946 yeast protein-pro-tein interactions involving 2,139 proprotein-pro-teins, that is, 38% of the
Saccharomyces cerevisiae proteome [20,21]. The classifica-tion tree obtained contains 602 proteins (Figure 2).
PRODISTIN clustering depends neither on sequence similarity nor on biochemical function
To understand the biological foundation of PRODISTIN clus-tering, we examined different possibilities that could explain protein segregation in the tree. First, we tested whether sequence similarity correlates with our clustering results, given the abundance of proteins involved in related functions
[image:2.612.57.298.86.380.2]Flowchart of PRODISTIN Figure 1
Flowchart of PRODISTIN. (a) A graph is constructed from a list of binary protein-protein interactions. (b) A functional distance based on the identity of the shared interactors is calculated among all proteins. (c) The distance matrix obtained is used to build a classification tree, on which functional classes are subsequently determined and analyzed by evaluating (d) their statistical robustness and (e) their biological relevance.
Binary protein-protein interaction list
a
Graph
b
Matrix of functional distances
c
Classification tree
e
d
Analysis of class
robustness
Analysis of protein
classes
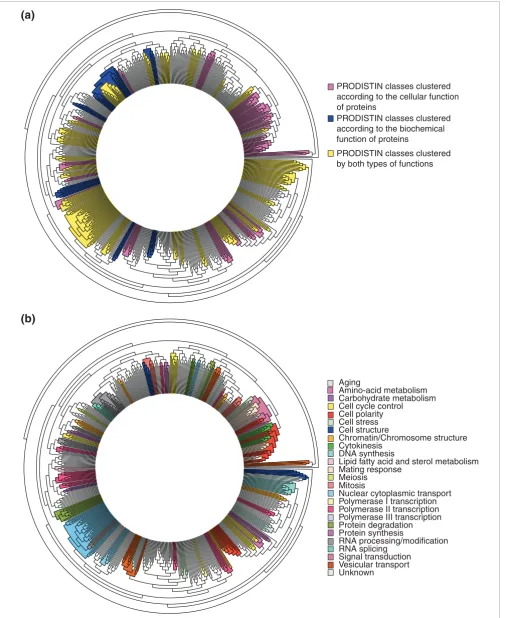
A functional classification tree for 602 yeast proteins computed with the PRODISTIN method Figure 2 (see following page)
A functional classification tree for 602 yeast proteins computed with the PRODISTIN method. (a) The foundation for protein clustering. PRODISTIN classes are clustered according to the 'cellular role' of proteins only (pink), according to the 'functional category' of proteins only (blue), and according to both criteria (yellow). (b) Functional classification. PRODISTIN classes on the circular classification tree have been colored according to their
comm
en
t
re
v
ie
w
s
re
ports
refer
e
e
d
re
sear
ch
de
p
o
si
te
d r
e
se
a
rch
interacti
o
ns
inf
o
[image:3.612.55.561.86.704.2]rmation
Figure 2 (see legend on previous page)
Aging
Amino-acid metabolism Carbohydrate metabolism Cell cycle control Cell polarity Cell stress Cell structure
Chromatin/Chromosome structure Cytokinesis
DNA synthesis
Lipid fatty acid and sterol metabolism Mating response
Meiosis Mitosis
Nuclear cytoplasmic transport Polymerase I transcription Polymerase II transcription Polymerase III transcription Protein degradation Protein synthesis
RNA processing/modification RNA splicing
Signal transduction Vesicular transport Unknown
PRODISTIN classes clustered according to the cellular function of proteins
PRODISTIN classes clustered according to the biochemical function of proteins
PRODISTIN classes clustered by both types of functions
(a)
that exhibit similarity in their sequences. Pairwise alignments between the sequences of the 602 yeast proteins classified by PRODISTIN were computed using a global and a local align-ment algorithm. Given that the obtained distances (expressed as the percentage of similarity for global and the score for local alignments, respectively) do not fit with tree distances, the tree model is not appropriate to represent these huge alignments [22]. We thus directly compared the distance val-ues obtained with PRODISTIN, the global and the local align-ments (as described above), by identifying for each distance matrix the nonredundant pairs of proteins (x, y) for which y is the closest neighbour of x or vice versa.
Among the 611 closest pairs of proteins identified with PRO-DISTIN, the 546 obtained with the global and the 527 obtained with the local alignment, 112 are shared between both alignments (21.2%), 32 between PRODISTIN and the global alignment (5.8%) and 38 between PRODISTIN and the local alignment (7.2%). This result strongly suggests that sequence alignments do not cluster the same proteins that PRODISTIN does, leading to the conclusion that PRODISTIN clustering is only moderately dependent on sequence similarity.
As sequence similarity is not a key determinant of TIN clustering, we then investigated the capacity of PRODIS-TIN to cluster proteins with identical or related functions. To do so, we separately analyzed PRODISTIN classes using two types of protein functional annotations described in the Yeast Proteome Database (YPD) [23]: the 'functional category' cor-responding to the biochemical function(s) and the 'cellular role' describing the cellular function(s) (see [19,24] for dis-cussions about the notion of function). Both types of function are known for 420 proteins in the tree. For comparison, PRO-DISTIN classes were separately constructed as defined above according to either the cellular or the biochemical function of proteins, using the 420/602 proteins annotated for both types of function (Figure 2a). Among the total of 369 proteins belonging to PRODISTIN classes, 212 (57%) are clustered according to both types of function, and 157 (43%) according to only one type of function. Strikingly, 69% of the latter (108/ 157) are clustered according to the cellular function whereas the remaining 31% (49/157) are grouped according to the bio-chemical function. Therefore, the PRODISTIN method clus-ters proteins more efficiently by their cellular function than by their biochemical function. This result is further validated by the following observations. First, when the subcellular localization of the classified proteins is investigated, proteins belonging to the same subcellular compartment are found clustered in the tree, as would be expected from clustering based on cellular function (data not shown). Second, when the biochemical function of proteins is considered, proteins with functions such as 'protein kinase' or 'hydrolase' are found broadly scattered in the tree. Given that proteins with such biochemical functions are likely to be involved in a large number of different cellular processes, their scattering
throughout the tree is to be expected from clustering on the basis of the cellular function. Third, sequence-similarity clas-sification of proteins differs from PRODISTIN protein clus-tering, as described above. Consequently, from now on, we will only consider PRODISTIN classes based on the cellular function of proteins.
Classification of the S. cerevisiae proteome: integrated analysis of cellular processes and their cross-talk
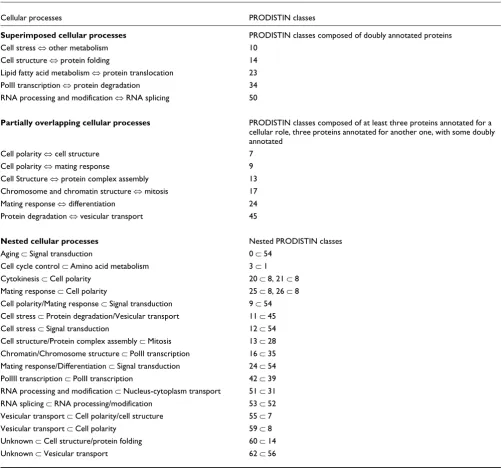
Using the 509 yeast proteins of the tree annotated in YPD for 'cellular role', 64 different PRODISTIN classes were con-structed, containing 3 to 36 members each. They contain two-thirds (408/602) of the tree proteins and cover 29 different 'cellular roles' out of 44 possible (Figure 2b; see also Addi-tional data file 1). Whereas some 'cellular roles' are associated with only one class in the tree (such as 'meiosis', which is class 27 (Figure 2b, see also Additional data file 1)), several classes have the same cellular role. This generally corresponds to dif-ferent aspects of a given cellular process: for instance, the six classes accounting for 'vesicular transport' (Figure 2b) are specifically devoted to autophagy (class 45), structural pro-teins related to actin (class 55), endoplasmic reticulum to Golgi transport (classes 56, 57), endocytosis (class 58) and exocytosis (class 59), respectively (see Additional data file 1).
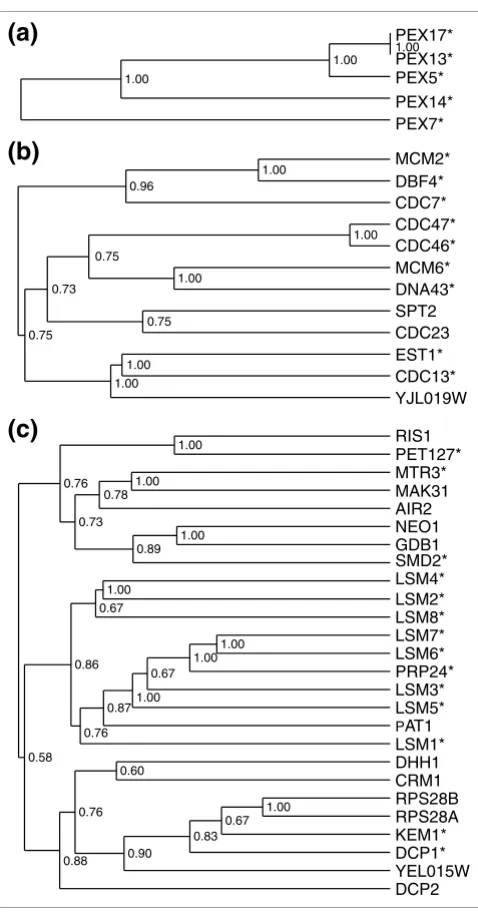
A detailed analysis of the PRODISTIN classes shows that sev-eral types of classes are encountered when class functional homogeneity is considered. In the simplest case, proteins are associated with the same molecular complex or involved in a particular cellular process. Nearly half of the classes fall into this category; for instance, class 23 (Figure 3a) consists solely of five members of the peroxisomal import complex [25], and class 22 'DNA synthesis' (Figure 3d; see also Additional data file 1) contains 9 out of 12 proteins involved in DNA replica-tion (labelled with an asterisk on Figure 3d). The two other characterized proteins belonging to this class are implicated in related and/or overlapping processes such as 'cell cycle control' and 'chromatin and chromosome structure' (Cdc23 and Spt2, respectively).
comm en t re v ie w s re ports refer e e d re sear ch de p o si te d r e se a rch interacti o ns inf o rmation
between superimposed or partially overlapping cellular proc-esses, via the dual function of some proteins.
Finally, a third case is encountered, in which small classes are nested within larger classes (Table 1) representing another example of cross-talk between cellular processes. The exam-ple given is for class 1 'amino acid metabolism' (Figure 3c; see also Additional data file 1). The metabolism of amino acids is related to cell-cycle control (class 3, Figure 3c) through the
ubiquitin-dependent proteolysis pathway mediated by the ubiquitin protein ligase complex SCF (Skp1-Cdc53-F-box protein). This complex contains two core proteins - Skp1 and Cdc53 - and a F-box motif-containing protein required for the specific targeting of certain proteins to the degradation path-way [26]. Consequently, a 'cell cycle control' class containing Skp1, Cdc53 and the F-box protein Cdc4, which targets Sic1 to degradation at the G1-S transition of the cell cycle, is nested within an 'amino acid metabolism' class enclosing the F-box protein Met30, which targets the transcription activator Met4 towards degradation during methionine biosynthesis. It is interesting to note that these classes encompass the unchar-acterized F-box-containing protein Flm1 which, on the basis of its position in the classification tree (Figure 3c), is a candi-date to target Csm3, a protein needed for chromosome segre-gation at meiosis [27], towards the ubiquitin-dependent proteolysis pathway.
The detailed analysis of the classes shows that the PRODIS-TIN method clusters proteins belonging to the same molecu-lar complex, pathway or cellumolecu-lar process, and underlines cross-talk between functions. Therefore, the method enables the extraction of complex functional information from inter-action networks by considerably reducing their complexity.
Functional predictions and their biological relevance
Among the 602 tree proteins, 93 had no defined 'cellular role' in YPD when we retrieved annotations (see Materials and methods). As 42 of them belong to a defined PRODISTIN class, a cellular function could consequently be proposed. Our predictions (Table 2; see also Additional data file 2) were compared with predictions obtained by others using several bioinformatics methods [8,18,28], the association of the pro-tein to a complex of known functions [29] and recent experi-mental results described in the literature and reported in the
Saccharomyces Genome Database (SGD) [30].
For two proteins (5%), no cellular function has ever been pro-posed by any other method. For 27 proteins (64%), our pre-diction is in accordance with or related to previously proposed ones, or the experimental results. For 13 proteins (30%), our predictions disagree (Table 2; see also Additional data file 2). When only the 19 experimentally determined functions are considered, PRODISTIN predictions are in accordance with 11/19 (58%) of them. Noticeably, when the functional predictions obtained by the global optimization method (GOM [18]) for the same proteins are considered, only 4/13 (31%) predictions are in accordance with the exper-imentally determined functions. Taken together, these observations strengthen the relevance of the PRODISTIN predictions for the uncharacterized proteins.
Interestingly enough, the PRODISTIN method also reveals the existence of clusters containing only proteins of unknown function. In one case, a cellular function can now be proposed for the entire cluster: as class 62 (annotated 'unknown') is
[image:5.612.55.294.82.539.2]Examples of PRODISTIN classes Figure 3
nested into class 56 (annotated 'vesicular transport'), all its members can therefore be associated with 'vesicular transport' and a posteriori recent experimental results strengthen our predictions (Table 2) [31,32].
Finally, the putative involvement of proteins of already known function in new cellular processes is also encountered. Class 52 (Figure 3e) contains proteins involved in RNA processing, including the members of the two LSM complexes which play a part in mRNA decapping (Lsm1-7) and pre-mRNA splicing (Lsm2-8) [33]. Given that two small subunit
ribosomal proteins Rps28A and B have been found to interact with Lsm2, Lsm4, and Lsm8 in the two-hybrid screen from Uetz et al. [15], these authors suggested either a possible involvement of Lsm proteins in translation/ribosomal bio-genesis or an unforeseen role of the ribosomal proteins in RNA splicing. As both proteins share all their interactors with Dcp1 (mRNA-decapping enzyme), PRODISTIN rather sug-gests a novel implication of Rps28A and B in mRNA decay.
[image:6.612.57.559.114.582.2]Altogether, these results lend further support to the ability of the PRODISTIN method to directly derive a cellular function
Table 1
Cross-talk between cellular processes after PRODISTIN classification
Cellular processes PRODISTIN classes
Superimposed cellular processes PRODISTIN classes composed of doubly annotated proteins Cell stress ⇔ other metabolism 10
Cell structure ⇔ protein folding 14 Lipid fatty acid metabolism ⇔ protein translocation 23 PolII transcription ⇔ protein degradation 34 RNA processing and modification ⇔ RNA splicing 50
Partially overlapping cellular processes PRODISTIN classes composed of at least three proteins annotated for a cellular role, three proteins annotated for another one, with some doubly annotated
Cell polarity ⇔ cell structure 7 Cell polarity ⇔ mating response 9 Cell Structure ⇔ protein complex assembly 13 Chromosome and chromatin structure ⇔ mitosis 17 Mating response ⇔ differentiation 24 Protein degradation ⇔ vesicular transport 45
Nested cellular processes Nested PRODISTIN classes Aging ⊂ Signal transduction 0 ⊂ 54
comm
en
t
re
v
ie
w
s
re
ports
refer
e
e
d
re
sear
ch
de
p
o
si
te
d r
e
se
a
rch
interacti
o
ns
inf
o
[image:7.612.57.547.123.729.2]rmation
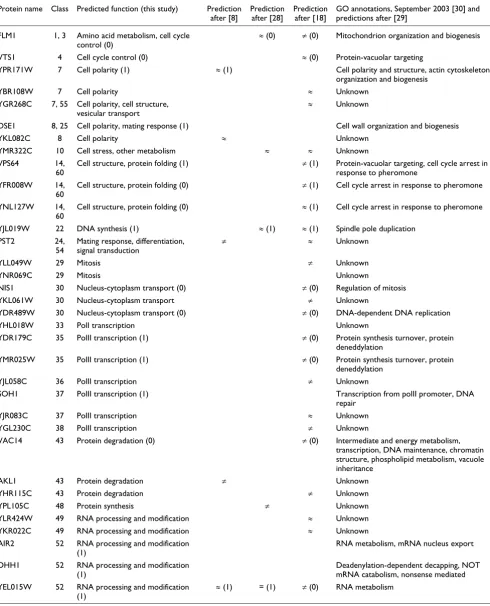
Table 2
Functional predictions and comparisons with predictions obtained by other means
Protein name Class Predicted function (this study) Prediction after [8]
Prediction after [28]
Prediction after [18]
GO annotations, September 2003 [30] and predictions after [29]
FLM1 1, 3 Amino acid metabolism, cell cycle control (0)
≈ (0) ≠ (0) Mitochondrion organization and biogenesis
VTS1 4 Cell cycle control (0) ≈ (0) Protein-vacuolar targeting
YPR171W 7 Cell polarity (1) ≈ (1) Cell polarity and structure, actin cytoskeleton organization and biogenesis
YBR108W 7 Cell polarity ≈ Unknown
YGR268C 7, 55 Cell polarity, cell structure, vesicular transport
≈ Unknown
DSE1 8, 25 Cell polarity, mating response (1) Cell wall organization and biogenesis
YKL082C 8 Cell polarity ≈ Unknown
YMR322C 10 Cell stress, other metabolism ≈ ≈ Unknown VPS64 14,
60
Cell structure, protein folding (1) ≠ (1) Protein-vacuolar targeting, cell cycle arrest in response to pheromone
YFR008W 14, 60
Cell structure, protein folding (0) ≠ (1) Cell cycle arrest in response to pheromone
YNL127W 14, 60
Cell structure, protein folding (0) ≈ (1) Cell cycle arrest in response to pheromone
YJL019W 22 DNA synthesis (1) ≈ (1) ≈ (1) Spindle pole duplication PST2 24,
54
Mating response, differentiation, signal transduction
≠ ≈ Unknown
YLL049W 29 Mitosis ≠ Unknown
YNR069C 29 Mitosis Unknown
NIS1 30 Nucleus-cytoplasm transport (0) ≠ (0) Regulation of mitosis YKL061W 30 Nucleus-cytoplasm transport ≠ Unknown
YDR489W 30 Nucleus-cytoplasm transport (0) ≠ (0) DNA-dependent DNA replication YHL018W 33 PolI transcription Unknown
YDR179C 35 PolII transcription (1) ≠ (0) Protein synthesis turnover, protein deneddylation
YMR025W 35 PolII transcription (1) ≠ (0) Protein synthesis turnover, protein deneddylation
YJL058C 36 PolII transcription ≠ Unknown
SOH1 37 PolII transcription (1) Transcription from polII promoter, DNA repair
YJR083C 37 PolII transcription ≈ Unknown YGL230C 38 PolII transcription ≠ Unknown
VAC14 43 Protein degradation (0) ≠ (0) Intermediate and energy metabolism, transcription, DNA maintenance, chromatin structure, phospholipid metabolism, vacuole inheritance
AKL1 43 Protein degradation ≠ Unknown YHR115C 43 Protein degradation ≠ Unknown YPL105C 48 Protein synthesis ≠ Unknown YLR424W 49 RNA processing and modification ≈ Unknown YKR022C 49 RNA processing and modification ≈ Unknown AIR2 52 RNA processing and modification
(1)
RNA metabolism, mRNA nucleus export
DHH1 52 RNA processing and modification (1)
Deadenylation-dependent decapping, NOT mRNA catabolism, nonsense mediated YEL015W 52 RNA processing and modification
(1)
for proteins from the information contained within the inter-action network, without using any additional sequence or structure information.
Statistical evaluations of PRODISTIN clusters
To evaluate the quality of PRODISTIN classifications and predictions on a more statistical basis, four different types of control experiments have been performed in order to assess the influence of various parameters.
First, given that annotations taken from databases may con-tain inconsistencies, our classification for the yeast proteome (originally established with YPD annotations) was further tested using the Gene Ontology (GO) annotations [34]. We used the GO Term Finder tool from the SGD database to search for significant shared GO terms (or their parents) used to describe the genes of interest and to calculate a p value for the occurrence of common terms (for details see Help in [35]). Lists of genes constituting all PRODISTIN classes were successively processed with the GO term finder for the 'biological process' ontology. On average, for 87.3% of the PRODISTIN classes, the best hit, that is, the common GO term with the lowest p value, is in accordance with the class annotation proposed using YPD annotations. These terms are highly statistically significant as a p value < 1e-6 is
encoun-tered for 83.63% of the classes. Moreover, these terms applied to 77% of the class members on average. As GO terms represent an independent source of functional annotation from YPD, these congruent results confirm that PRODISTIN efficiently clusters proteins having common or related cellu-lar functions.
In a second control experiment, the overall accuracy of our functional predictions was estimated on the basis of the abil-ity of PRODISTIN to predict correctly the function of already known proteins. For this, we first supposed that members of a given PRODISTIN class all perform the function attributed
to the class (independently of their actual function) and then compared these predictions to the known functions. We defined the prediction success rate as the ratio between the number of correctly predicted functions and the total number of predictions. In this test, PRODISTIN performances were compared with those of a 'majority rule' algorithm (MRA [28]), which assigns to a given protein the function most frequently found among its neighbors in the original protein-protein network. As shown in Table 3, the highest success rate for function predictions is attained with PRODISTIN. In fact, 67% of the predictions made with PRODISTIN are correct against only 43% of the ones proposed by the MRA.
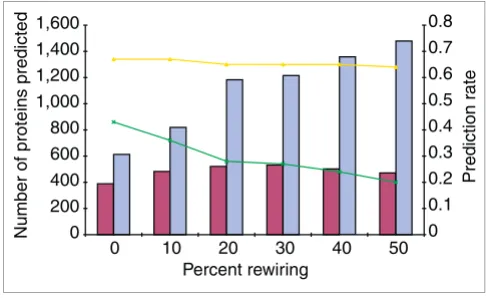
Third, we tested the robustness of PRODISTIN towards the presence of both spurious and missing interactions in the dataset because, despite the fact that it was carefully assem-bled (see Materials and methods), the actual accuracy of our dataset is difficult to estimate. This prompted us to test PRO-DISTIN's reliability when the topology of the network is dis-turbed by false or missing edges. For this, we rewired the network by randomly removing edges and putting them back in between pairs of proteins not already connected. PRODIS-TIN and the MRA were applied to these rewired networks and the pattern of change of the prediction rate was monitored when the percentage of modified edges gradually increases from 0 to 50%. Interestingly, the rate of correct predictions stays remarkably even (between 64 to 67%) (Figure 4). The number of proteins for which a prediction is possible (because they belong to a PRODISTIN class of known func-tion) also remains quite stable (from 389 for the initial net-work to 471 on average for 50% rewired netnet-works), although the actual number of proteins in the tree increases from 601 to 1,493 on average for 50% rewired networks. Comparison with the MRA clearly shows that, although this algorithm is able to offer a prediction for a larger number of proteins in the network, its success rate is always two to three times lower than that of PRODISTIN. In addition, it is also very sensitive
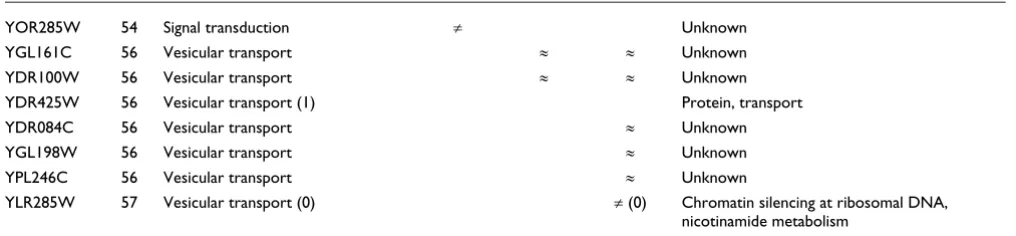
YOR285W 54 Signal transduction ≠ Unknown YGL161C 56 Vesicular transport ≈ ≈ Unknown YDR100W 56 Vesicular transport ≈ ≈ Unknown YDR425W 56 Vesicular transport (1) Protein, transport YDR084C 56 Vesicular transport ≈ Unknown YGL198W 56 Vesicular transport ≈ Unknown YPL246C 56 Vesicular transport ≈ Unknown
YLR285W 57 Vesicular transport (0) ≠ (0) Chromatin silencing at ribosomal DNA, nicotinamide metabolism
[image:8.612.55.563.115.233.2]=, ≈, ≠, are used to indicate when prediction from other bioinformatic methods are the same, almost the same, or different from PRODISTIN predictions. The number in parentheses indicates when the prediction is in accordance or related to (1), or different (0) from functions demonstrated experimentally.
Table 2 (Continued)
comm
en
t
re
v
ie
w
s
re
ports
refer
e
e
d
re
sear
ch
de
p
o
si
te
d r
e
se
a
rch
interacti
o
ns
inf
o
rmation
to the introduction of false interactions, as its success rate drops dramatically from 43% for the initial network to 20% on average with 50% rewired networks. In summary, it is pos-sible to conclude that clustering proteins within classes according to their cellular functions has a positive buffering effect on the prediction rate and that PRODISTIN is thus very robust against the presence of false interactions in the dataset.
We then tested PRODISTIN's performance on random net-works of identical topologies in order to assess whether PRO-DISTIN clustering would have occurred by chance. For this, all protein names were reshuffled and randomly assigned to nodes in the network. The PRODISTIN analysis of such net-works only allows the construction of a tiny number of classes (15 on average, instead of 63), consequently leading to a very low number of proteins for which a prediction is possible (51 on average instead of 389 in the current study). Finally, the prediction rate drops to 60%. This clearly indicates that ran-dom interaction networks never lead to both a high number of PRODISTIN classes and a correct prediction rate, as true networks do.
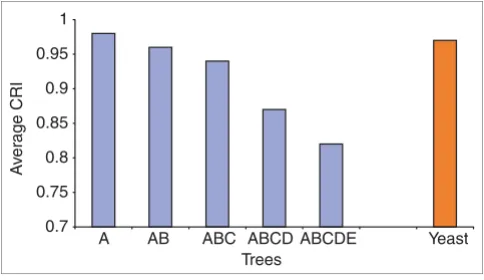
A final statistical assessment of PRODISTIN has been per-formed by measuring the robustness of the protein clusters with another criterion based on tree topology (see Materials and methods for details). For this, we applied PRODISTIN to the protein-protein interaction network of the bacterium
Helicobacter pylori [14], for which information on putative true/false positives is available. Using the PBS® algorithm,
these interactions had been ranked in five experimental cate-gories of decreasing biological confidence (from A to E) [14]. A recent assessment has further confirmed the existence of a positive correlation between this reliability score and the true-positive rate [36]. Classification trees built with five datasets corresponding to the interactions of categories A, A+B, A+B+C, A+B+C+D, and A+B+C+D+E were computed and tested for the robustness of their subtrees and the average robustness value was calculated for each tree (see Materials
and methods for details). As expected, this value decreases as more interactions of lower biological significance occur in the dataset (Figure 5). This correlation between PBS categories and the average statistical robustness of the trees represents a fourth and independent support for the reliability of the PRODISTIN approach. In addition, the fact that the average robustness value of the yeast tree is almost equivalent to that of the H. pylori A tree reinforces the conclusion that the Sac-charomyces tree is biologically meaningful.
Discussion
Protein-protein interactions as good indicators of protein cellular function
We present here a new bioinformatics method that is able to compute a functional clustering of proteins on the basis of protein-protein interaction data. When applied to the yeast interactome, our method classified 602 proteins, represent-ing a significant part of the proteome (11%), into 64 classes of functionally related proteins.
[image:9.612.312.555.87.236.2]Our method was based on the assumption that a distance for-mula (the Czekanovski-Dice distance) that uses information on shared interactors could potentially mirror a functional distance between proteins. The demonstration that the classi-fication and the protein clustering resulting from PRODIS-TIN are essentially driven by the cellular function of proteins gives strong support to our initial assumption. This also may be explained by the fact that the chosen distance formula makes it possible to take into account not only the functional information carried by the nearest neighbors in the protein-protein network, but also by protein-proteins two edges away.
Table 3
Success rates for PRODISTIN vs majority rule
MR PRODISTIN
Success rate 0.43 0.67
Predictions
Totally in accordance 0.23 0.35 Partially in accordance 0.69 0.76 In disagreement 0.31 0.24
Number of proteins on which a prediction is possible
520 346
[image:9.612.53.296.113.245.2]Robustness of PRODISTIN towards false interactions Figure 4
Robustness of PRODISTIN towards false interactions. The prediction rate (number of correct predictions divided by number of predictions) was measured for PRODISTIN (yellow curve) and for the majority rule algorithm (green curve) on networks on which a certain percentage of interactions were randomly 'rewired' (from 10 to 50%) (see text). The number of proteins for which a prediction is possible is also reported as a histogram (dark red, PRODISTIN; blue, majority rule). The values correspond to an average of 50 experiments for each percentage of false interactions introduced into the dataset.
0 0.1 0.2 0.3 0.4 0.5 0.6 0.7 0.8
0 200 400 600 800 1,000 1,200 1,400
Number of proteins predicted
Prediction r
ate
0 10 20 30 Percent rewiring
Therefore, the obtained distance values, once clustered, are able to highlight subgraphs in the network, such as those formed by proteins involved in the same pathway(s) or cellu-lar process(es).
As we also showed that the PRODISTIN functional distance clusters proteins independently of their sequence similarities and their actual biochemical function, we now have the opportunity to quantify functional relationships between pro-teins in the same way that sequence alignments make it pos-sible to quantify protein-sequence similarity. PRODISTIN thus represents a useful complement to sequence-compari-son methods, which rather point towards proteins that have the same molecular function. It is interesting to note that the majority of proteins with the same biochemical function are not clustered in the tree despite their sequence similarity. This moderate dependence of cellular function on sequence similarities clearly means that many functional similarities are at present missed by sequence-based methods, emphasizing the importance of using other types of data than sequence and structure as a basis for function assessment.
Two major advantages result from the fact that PRODISTIN computes all interactions constitutive to an interaction network at once. First, it produces a large functional tree, allowing direct comparison in terms of cellular function for any pair or group of proteins. Second, it makes it possible to visualize a large number of cellular processes and their main actors in a single integrated view, thus offering the possibility of examining the links between cellular functions, and more broadly, the organization of cellular functions within the interaction network. In doing so, PRODISTIN functional trees can capture the essential part of the functional informa-tion buried in complex interacinforma-tion networks, something which is at present impossible to deduce from the intricate graphical representations. Consequently, PRODISTIN can be
considered to be one of the first cellular bioinformatics tools available that allows not only comparison of the function of individual proteins but also the ability to study cell function more globally. For instance, the dissection of given cellular functions into sub-functions visible at network level or the study of the functional relationships between known cellular functions can be investigated. As discussed in Results, PRO-DISTIN has shown that the 'vesicular transport' general func-tion can be separated into distinct subfuncfunc-tions. An analytic approach of this kind could be systematically undertaken for all known yeast cellular functions, as they are statistically rep-resented in the tree, and later on for those of other organisms. As far as the second question of the relationships between functions is concerned, PRODISTIN could represent a valuable functional data-mining tool. It is, for instance, inter-esting to note that, although there exist 44 different YPD 'cel-lular roles' to describe the complete yeast proteome, of which 42 are represented by more than one protein in the tree, our PRODISTIN classes at present cover only 29 of them. Despite the existence of biases in the interaction dataset generally, due to a deeper investigation of certain proteins and to meth-odological flaws, this observation could suggest a predominant role for these 29 cellular functions in the organ-ization of the network.
Comparison of the PRODISTIN method with recent functional prediction methods
Comparison of the results of PRODISTIN with those of other computational methods for assessing and comparing protein functions is not straightforward. Because of the lack of com-mon interaction sets, functional annotations, comcom-mon evalu-ation tools and sometimes insufficient description of the algorithms used, no simple benchmarking comparative anal-yses are yet possible. However, in an attempt to evaluate the relative advantages and disadvantages of the different meth-ods, we compared their results when available. For this pur-pose, we evaluated PRODISTIN against the MRA [28] and two networks-based methods, the GOM [18] and the Rives and Galitski method (RGM [17]). We measured their relative behavior in terms of success rate in the prediction of the func-tion of already known proteins (PRODISTIN vs MRA vs GOM), functional assignment of unclassified proteins (PRO-DISTIN vs GOM), and ability to cope with false-positive and false-negative interactions in the dataset (PRODISTIN vs GOM vs MRA).
Our results (see Table 3) and those of the GOM (Table 1 in [18]) both agree that the MRA has a lower success rate than PRODISTIN or GOM in predicting the function of known pro-teins. When the ability of GOM and PRODISTIN to predict a function for 42 otherwise uncharacterized proteins is com-pared to recently published experimental results as a refer-ence, the latter performs better (Table 2). We found that 58% of PRODISTIN predictions are in accordance with the litera-ture, whereas only 31% of the predictions made by the GOM are.
[image:10.612.57.299.87.227.2]Evaluation of PRODISTIN robustness by analysis of the H. pylori interactome
Figure 5
Evaluation of PRODISTIN robustness by analysis of the H. pylori interactome. Average class robustness index (CRI) value for the five H. pylori trees obtained with interactions of decreasing PBS (blue histograms) and for the yeast tree (orange histogram).
Trees 0.7
0.75 0.8 0.85
A
v
er
age CRI
0.9 0.95 1
comm
en
t
re
v
ie
w
s
re
ports
refer
e
e
d
re
sear
ch
de
p
o
si
te
d r
e
se
a
rch
interacti
o
ns
inf
o
rmation
Finally, when robustness towards the presence of false-posi-tive and false negafalse-posi-tive interactions is assayed by changing the topology of the network, the MRA again performs less effi-ciently than PRODISTIN (Figure 4). In addition, on random networks of identical topology, both PRODISTIN and the RGM (Table 1 in [17]) show that clustering of proteins in true networks is always higher than clustering observed in ran-dom networks.
Unlike GOM, PRODISTIN and RGM produce functional trees as an output. But PRODISTIN goes one step further, by find-ing functional classes on the tree accordfind-ing to two parameters (the minimal number of annotated proteins for the same function in the class and their minimal representation in the class - 3 and 50%, respectively, in this study). This considera-bly facilitates the process of function assessment, as it mini-mizes the ambiguity inherent in tree representation. This class construction also has a positive buffering effect that lim-its the influence of false interactions on the classification and makes it possible to maintain high prediction rates, as already discussed. One may argue that constructing classes limits the number of proteins for which a prediction is possible. It is then important to note that PRODISTIN settings may be changed easily at different levels. Depending on the goal of the user (favoring class coverage of the tree, for instance), the number of proteins per class can be increased by juggling with the two parameters defining the PRODISTIN classes, but at the unavoidable price of a slight decrease in the overall accu-racy of the predictions. Switching from the YPD annotation system to the GO system using GO slim categories also increases the number of classified proteins in the tree and consequently, of possible predictions (D.M., B.J. and C.B., unpublished data).
Conclusions
As more interactions become available, the coverage of the proteome and the mean number of interactions per protein will increase, therefore improving the relevance of the protein clusters found by the PRODISTIN method. Noticeably, it can be anticipated that using interactions recently described in the literature as well as new interactions produced by large-scale approaches could rapidly lead to the classification of the majority of the yeast proteome. As far as the PRODISTIN method is concerned, work presently in progress in our labo-ratory will soon totally automate the tedious task of manually constructing PRODISTIN classes on the tree.
Finally, PRODISTIN can be applied not only to the proteomes of unicellular organisms (this study) but also to those of metazoans. The classification trees recently obtained on the
Drosophila and the human proteome (C.B., S. Siret, P. Mouren and B.J., unpublished data) show protein clusters having a true biological significance. Furthermore, other types of interaction networks such as genetic interaction networks (A. Baudot, B.J., C.B., unpublished data) and
tran-scriptional networks can also benefit from the application of our general method. These new developments will allow PRODISTIN to be applied to a large variety of biological ques-tions, such as the evolutionary fate of duplicated genes, the functional aspects of horizontal transfer of genes from one species to another, the integration of signaling pathways and the evolutionary comparison of gene networks.
Materials and methods
Protein-protein interaction data sets
Yeast protein-protein interactions were extracted from the MIPS database [37]. Only direct binary interactions were selected, based on the method used for their identification (two-hybrid, excluding high-throughput experiments, in vitro binding, far western, gel retardation and biochemical experiments). For high-throughput two-hybrid experiments, 948 interactions were taken from Uetz et al. [15] and 839 from Ito's core data [12]. This yielded a total of 2,946 interac-tions involving 2,139 proteins (average connectivity 2.6 inter-actions per protein). The 1,517 protein-protein interinter-actions involving 730 proteins from Helicobacter pylori and their corresponding PBS categories were taken from Rain et al.
[14].
Classification method
Only proteins involved in at least three binary interactions were selected for further classification. Taking into account that the existence of false-positive and false-negative interac-tions weights more for poorly connected proteins, and that the estimated number of interactions per protein is close to five [38,39], we chose to rule out proteins for which the con-tribution of such false interactions may blur the analysis. Pro-teins in our dataset have 2.6 interactors on average. We thus chose to set the connectivity threshold to be classified to 3, which means that proteins implicated in one or two interac-tions were not classified but taken into account for the com-putation. First, it is stated that a relation between two proteins to be classified exists if either they interact with each other and/or they share at least one common interactor. Sub-sequently, a graph in which vertices are proteins and edges correspond to this relation, was computed. The connected components are computed and the main one containing almost all of the proteins was selected. Second, the Czekanovski-Dice distance between all pairs of proteins of this class was then calculated. This classical distance on graphs corresponds to the formula
D(i,j) = #(Int(i) ∆ Int(j))/ [#(Int(i) ∪ Int(j)) + #(Int(i) ∩
Int(j))]
shared interactors by giving more weight to the similarities than to the differences; it is very close to an ultrametric dis-tance because the vast majority of disdis-tance values between protein pairs is at a maximum (for two proteins that do not share any interactor, the distance value is 1, the highest value, whereas for two proteins interacting with each other and sharing exactly the same interactors, the distance value is 0, the lowest value). Consequently, the advantage of choosing this distance is that it authorizes the use of tree representa-tion. With such distance values, only one tree structure fits the initial distance values, independently of the chosen clus-tering algorithm. We have used the BioNJ algorithm [40] to build a tree from our distance matrices. This is an improve-ment of the neighbor-joining algorithm [41], which takes into account the variance of the distance between proteins to eval-uate the length of the branches in the tree. A circular classifi-cation tree was then drawn using the TreeDyn package [42].
Sequence alignments and analysis
Pairwise sequence alignments have been performed on the set of 602 protein sequences classified with the PRODISTIN method. Both Needleman-Wunsch (global alignment) and Smith-Waterman (local alignment) algorithms have been applied. The programs used for the two algorithms are avail-able at [43] and [44], respectively. The chosen alignment matrix was BLOSUM50, and the gap-opening and gap-exten-sion penalties were set to 12 and 2, respectively. The resulting 363,004 alignments have been processed to calculate the dis-tance corresponding to the percentage of similarity for each protein pair in the global alignment and for the score in the local alignment.
Subtree robustness measurement
The robustness of each subtree was computed by measuring its homogeneity using a criterion based on topology. Consid-ering triples made of two elements within a given subtree and one outside the subtree (possibly restricted to the sibling sub-tree), we evaluated the percentage of these triples for which the two elements belonging to the same subtree are separated by the smallest distance value. This allowed us to calculate a class robustness index (CRI) for each inner branch, which was computed by the Qualitree program [22] as a measure-ment of robustness/quality of the downward class. CRI may be considered as functionally equivalent to the bootstrap index usually used to assess the quality of phylogenetic sub-trees. CRI values for PRODISTIN classes are available in Additional data file 1. The average CRI per tree corresponds to the sum of all triples for which the two elements belonging to the same subtree are separated by the smallest distance value divided by the sum of possible triples.
Annotation sources and functional tree visualization
We downloaded the 'cellular role', 'functional categories' and 'sub-cellular localization' annotation files for yeast proteins from YPD [23] on 28 May 2002. The category labels were
then loaded into Treedyn [42] for a direct class visualization on the trees as displayed in Figure 2b.
Additional data files
The following additional data are available with the online version of this article: details of all the proteins and protein classes included in this analysis (Additional data file 1), and details of the functional predictions and comparisons with predictions obtained by other means (Additional data file 2).
Additional data file 1
Details of all the proteins and protein classes included in this analysis
Composition of the 63 PRODISTIN classes. Numbers in column ''Cellular Role' Annotation' indicate founder proteins for each class (see Fig. 3 legend). When two 'Cellular Roles' are assigned to a same class, 1 and 2 indicate proteins annotated with the first one and/or the second class respectively. A question mark (?) marks proteins of unknown function. The class robustness index is indicated for each class
Click here for additional data file Additional data file 2
Details of the functional predictions and comparisons with predic-tions obtained by other means
Details of the functional predictions and comparisons with predic-tions obtained by other means
Click here for additional data file
Acknowledgements
We thank J.-C. Rain for providing the H. pylori data, A. Baudot, L. Fasano, S. Gangloff, A. Kissenpfennig, D. Nesic, E. Remy, L. Röder, J. Smith and D. Thieffry for carefully reading the manuscript and helpful discussions, and Pierre Mouren for technical assistance. This project is supported by three Action Bioinformatique inter-EPST grants to A.G., F.C. and B.J. respectively. C.B. thanks Valigen SA and the Fondation pour la Recherche Médicale for financial support.
References
1. Galperin MY, Koonin EV: Who's your neighbor? New computational approaches for functional genomics. Nat Biotechnol 2000, 18:609-613.
2. Enright AJ, Iliopoulos I, Kyrpides NC, Ouzounis CA: Protein inter-action maps for complete genomes based on gene fusion events.Nature 1999, 402:86-90.
3. Marcotte EM, Pellegrini M, Ng HL, Rice DW, Yeates TO, Eisenberg D: Detecting protein function and protein-protein interac-tions from genome sequences.Science 1999, 285:751-753. 4. Tamames J, Casari G, Ouzounis C, Valencia A: Conserved clusters
of functionally related genes in two bacterial genomes.J Mol Evol 1997, 44:66-73.
5. Dandekar T, Snel B, Huynen M, Bork P: Conservation of gene order: a fingerprint of proteins that physically interact.Trends Biochem Sci 1998, 23:324-328.
6. Overbeek R, Fonstein M, D'Souza M, Pusch GD, Maltsev N: The use of gene clusters to infer functional coupling.Proc Natl Acad Sci USA 1999, 96:2896-2901.
7. Pellegrini M, Marcotte EM, Thompson MJ, Eisenberg D, Yeates TO: Assigning protein functions by comparative genome analy-sis: protein phylogenetic profiles.Proc Natl Acad Sci USA 1999, 96:4285-4288.
8. Marcotte EM, Pellegrini M, Thompson MJ, Yeates TO, Eisenberg D: A combined algorithm for genome-wide prediction of protein function.Nature 1999, 402:83-86.
9. Bartel PL, Roecklein JA, SenGupta D, Fields S: A protein linkage map of Escherichia coli bacteriophage T7. Nat Genet 1996, 12:72-77.
10. Flajolet M, Rotondo G, Daviet L, Bergametti F, Inchauspe G, Tiollais P, Transy C, Legrain P: A genomic approach of the hepatitis C virus generates a protein interaction map. Gene 2000, 242:369-379.
11. Fromont-Racine M, Mayes AE, Brunet-Simon A, Rain JC, Colley A, Dix I, Decourty L, Joly N, Ricard F, Beggs JD, Legrain P: Genome-wide protein interaction screens reveal functional networks involving Sm-like proteins.Yeast 2000, 17:95-110.
12. Ito T, Chiba T, Ozawa R, Yoshida M, Hattori M, Sakaki Y: A compre-hensive two-hybrid analysis to explore the yeast protein interactome.Proc Natl Acad Sci USA 2001, 98:4569-4574. 13. McCraith S, Holtzman T, Moss B, Fields S: Genome-wide analysis
of vaccinia virus protein-protein interactions.Proc Natl Acad Sci USA 2000, 97:4879-4884.
14. Rain JC, Selig L, De Reuse H, Battaglia V, Reverdy C, Simon S, Lenzen G, Petel F, Wojcik J, Schachter V et al.: The protein-protein inter-action map of Helicobacter pylori.Nature 2001, 409:211-215. 15. Uetz P, Giot L, Cagney G, Mansfield TA, Judson RS, Knight JR,
comm
en
t
re
v
ie
w
s
re
ports
refer
e
e
d
re
sear
ch
de
p
o
si
te
d r
e
se
a
rch
interacti
o
ns
inf
o
rmation
cerevisiae.Nature 2000, 403:623-627.
16. Walhout AJ, Sordella R, Lu X, Hartley JL, Temple GF, Brasch MA, Thi-erry-Mieg N, Vidal M: Protein interaction mapping in C. elegans using proteins involved in vulval development.Science 2000, 287:116-122.
17. Rives AW, Galitski T: Modular organization of cellular networks.Proc Natl Acad Sci USA 2003, 100:1128-1133.
18. Vazquez A, Flammini A, Maritan A, Vespignani A: Global protein function prediction from protein-protein interaction networks.Nat Biotechnol 2003, 21:697-700.
19. Jacq B: Protein function from the perspective of molecular interactions and genetic networks.Brief Bioinform 2001, 2:38-50. 20. Wood V, Rutherford KM, Ivens A, Rajandream M-A, Barrell B: A re-annotation of the Saccharomyces cerevisiae genome.Comp Funct Genomics 2001, 2:143-154.
21. Malpertuy A, Tekaia F, Casaregola S, Aigle M, Artiguenave F, Blandin G, Bolotin-Fukuhara M, Bon E, Brottier P, de Montigny J et al.: Genomic exploration of the hemiascomycetous yeasts: 19. Ascomycetes-specific genes.FEBS Lett 2000, 487:113-121. 22. Guénoche A, Garreta H: Can we have confidence in a tree
representation?Comput Biol 2001, 2066:45-56.
23. Costanzo MC, Crawford ME, Hirschman JE, Kranz JE, Olsen P, Rob-ertson LS, Skrzypek MS, Braun BR, Hopkins KL, Kondu P et al.: YPD, PombePD and WormPD: model organism volumes of the BioKnowledge library, an integrated resource for protein information.Nucleic Acids Res 2001, 29:75-79.
24. Brun C, Baudot A, Guénoche A, Jacq B: The use of protein-pro-tein interaction networks for genome wide proprotein-pro-tein function comparisons and predictions. In Methods in Proteome and Protein Analysis Edited by: Kamp RM, Calvete JJ, Choli-Papadopoulou T. Berlin Heidelberg: Springer-Verlag; 2004:103-124.
25. Huhse B, Rehling P, Albertini M, Blank L, Meller K, Kunau WH: Pex17p of Saccharomyces cerevisiae is a novel peroxin and component of the peroxisomal protein translocation machinery.J Cell Biol 1998, 140:49-60.
26. Patton EE, Willems AR, Tyers M: Combinatorial control in ubiq-uitin-dependent proteolysis: don't Skp the F-box hypothesis. Trends Genet 1998, 14:236-243.
27. Rabitsch KP, Toth A, Galova M, Schleiffer A, Schaffner G, Aigner E, Rupp C, Penkner AM, Moreno-Borchart AC, Primig M et al.: A screen for genes required for meiosis and spore formation based on whole-genome expression. Curr Biol 2001, 11:1001-1009.
28. Schwikowski B, Uetz P, Fields S: A network of protein-protein interactions in yeast.Nat Biotechnol 2000, 18:1257-1261. 29. Gavin AC, Bosche M, Krause R, Grandi P, Marzioch M, Bauer A,
Schultz J, Rick JM, Michon AM, Cruciat CM et al.: Functional organ-ization of the yeast proteome by systematic analysis of pro-tein complexes.Nature 2002, 415:141-147.
30. Saccharomyces Genome Database [http://genome-www.stan ford.edu/Saccharomyces]
31. Calero M, Winand NJ, Collins RN: Identification of the novel pro-teins Yip4p and Yip5p as Rab GTPase interacting factors. FEBS Lett 2002, 515:89-98.
32. Hettema EH, Lewis MJ, Black MW, Pelham HR: Retromer and the sorting nexins Snx4/41/42 mediate distinct retrieval path-ways from yeast endosomes.EMBO J 2003, 22:548-557. 33. He W, Parker R: Functions of Lsm proteins in mRNA
degrada-tion and splicing.Curr Opin Cell Biol 2000, 12:346-350.
34. Ashburner M, Ball CA, Blake JA, Botstein D, Butler H, Cherry JM, Davis AP, Dolinski K, Dwight SS, Eppig JT et al.: Gene ontology: tool for the unification of biology. The Gene Ontology Consortium.Nat Genet 2000, 25:25-29.
35. SGD Gene Ontology Term Fineder [http://genome-www4.stan ford.edu/cgi-bin/SGD/GO/goTermFinder]
36. Wojcik J, Boneca IG, Legrain P: Prediction, assessment and vali-dation of protein interaction maps in bacteria.J Mol Biol 2002, 323:763-770.
37. Mewes HW, Frishman D, Guldener U, Mannhaupt G, Mayer K, Mokrejs M, Morgenstern B, Munsterkotter M, Rudd S, Weil B: MIPS: a database for genomes and protein sequences.Nucleic Acids Res 2002, 30:31-34.
38. Legrain P, Wojcik J, Gauthier JM: Protein-protein interaction maps: a lead towards cellular functions.Trends Genet 2001, 17:346-352.
39. Grigoriev A: On the number of protein-protein interactions in the yeast proteome.Nucleic Acids Res 2003, 31:4157-4161. 40. Gascuel O: BIONJ: an improved version of the NJ algorithm
based on a simple model of sequence data.Mol Biol Evol 1997, 14:685-695.
41. Saitou N, Nei M: The neighbor-joining method: a new method for reconstructing phylogenetic trees. Mol Biol Evol 1987, 4:406-425.
42. TreeDyn [http://viradium.mpl.ird.fr/treedyn]
43. Bioinformatics web site of Dr. Andrew C.R. Martin [http:// www.bioinf.org.uk/software]