Technology (IJRASET)
Despeckling of Optical Coherence Tomography
Images: A Comparative Study
A. Stella1, Dr. Bhushan Trivedi2 , Dr. N.N.Jani3 1,3
Kadi Sarva Vishwavidyalaya, Gujarat, India
2
GLS Institute of Computer Technology (MCA), Gujarat, India.
Abstract: Optical coherence tomography images are susceptible to speckle noise which affects the interpretation and analysis of internal structures of specimens. Speckle noise reduction is an important prerequisite, whenever coherent imaging is used for tissue characterization. The speckle pattern depends on the structure of the image tissue and various imaging parameters. Denoising techniques are aimed at removing noise or distortion from images while retaining the original quality of the image. This paper examines the performance of some spatial domain linear and non-linear filters in denoising an OCT image. A comparative study is made on the performance of these filters which is expected to remove the speckle noise from the image while preserving the edges. Various image metrics are used to evaluate the performance of the denoising filters. The comparison shows that bilateral filter performs better than other denoising filters.
Key Words: Speckle Noise, Denoising techniques, Denoising filters, Image Restoration, Image metrics.
I. INTRODUCTION
Speckle noise is a common phenomenon exhibited by coherent imaging which appears in many applications like optical coherence tomography, synthetic aperture radar and ultra sound imaging. Speckle noise is generated due to constructive and destructive interference of multiple echoes returned from each pixel[1]. As a result, a granular pattern is produced in the image which significantly corrupts the appearance of the image objects which constitutes a major image quality degradation factor. It does not affect contrast resolution though it does reduce the useful spatial resolution. The reduction affects the human ability to identify normal and pathological tissues in optical coherence tomography images Speckle is a kind of correlated noise and therefore it is difficult to completely eliminate although it can be significantly reduced by denoising techniques. Many filtering methods have been proposed in the literature to reduce speckle noise[2,4,5]. One possible side effect is that filtering algorithms eliminate part of the original information along with noise, especially high frequency information related to image edges or details. In general, denoising methods can be broadly classified as adaptive and non-adaptive filtering algorithms. Non-adaptive filters are faster and easy to be implemented. They use the same smoothing weights for the whole image ignoring the differences in the image contrast and texture. Examples of non-adaptive filters are mean and median filters. On the other hand adaptive speckle filtering methods preserve edges and high-textured details. Several techniques for suppressing speckle noise have been developed. They are divided mainly into two classes: (i) techniques that are applied in the spatial domain and (ii) techniques that are applied in the transform domain. This paper presents a comparative study on the performance of spatial domain linear and non-linear filters. The paper is organized as follows: Section 2 describes the mathematical model of speckle noise. Section 3 presents the review of existing speckle filters. Section 4 presents quality evaluation metrics used for evaluating the quality of speckle reduction technique. Section 5, presents the experimental results on OCT images and the conclusion is given in section 6.
II. MATHEMATICAL MODEL OF SPECKLE
Speckle is well modeled by a multiplicative noise. It is a random signal where the average amplitude increases with the overall signal intensity. It is known to have Rayleigh distribution. It appears as bright specks in the lighter region of the image[3]. It can be modeled as a pixel value multiplied by the random value. Speckle noise can be modeled as:
Y(x, y) = S(x, y).N(x, y) (1)
where Y, S and N represent the noisy data, signal and speckle noise, respectively. In order to change the multiplicative nature of the noise to additive one, a logarithmic transformation is applied to the image data [3]. Taking logarithm of the both sides of equation (1), leads to:
f(x,y) = s(x,y) + e(x,y) (2)
Technology (IJRASET)
III. REVIEW OF LITERATURE
A. Lee Filter
The Lee filter[6], developed by Jong-Sen Lee, is an adaptive filter which changes its characteristics according to the local statistics in the neighborhood of the current pixel. Lee filter forms an output image by computing a linear combination of the center pixel intensity in a filter window with the average intensity of the window. The distinct characteristic of the filter is that in the areas of low signal activity (flat regions) the estimated pixel approaches the local mean, whereas in the areas of high signal activity (edge areas) the estimated pixel favors the corrupted image pixel, thus retaining the edge information.
B. Wiener Filter
Wiener filter[7] is based on the least-squared principle, i.e. the filter minimizes the mean-squared error (MSE) between the actual output and the desired output. Image statistics vary too much from a region to another even within the same image. Thus, both global statistics (mean, variance, etc. of the whole image) and local statistics (mean, variance, etc. of a small region or sub-image) are important. Wiener filtering is based on both the global statistics and local statistics.
C. Frost Filter
The Frost filter[8] replaces the pixel of interest with a weighted sum of the values within the n x n moving window. The weighting factors decreases with distance from the pixel of interest and increases for the central pixels as variance within the window increases. This filter assumes multiplicative noise and stationary noise statistics.
D. Sigma Filter
It reduces speckle noise by replacing the center pixel of a scanning window with the average of those pixels within the two-sigma range of the center pixel. Pixels outside the two-sigma[9] range are considered as outliers, and they are not included in computing the sample mean. It is well known, that small details of the input image are not well preserved by the sigma filter.
E. Homomorphic Filter
Homomorphic filtering[10] technique is one of the image enhancement methods implemented in frequency domain. It is a kind of approach based on the illumination-reflectance image model which is very useful in performing image enhancement by simultaneous brightness range compression and contrast enhancement.
F. Bilateral Filter
The Bilateral filter[11], a nonlinear filter proposed by Tomasi and Manduchi, is used to suppress additive noise from images. It smoothes images while preserving edges, by means of a nonlinear combination of nearby image values. The method is noniterative, local, and simple. It combines gray levels or colors based on both their geometric closeness and their photometric similarity, and prefers near values to distant values.
G. Total Variation Filter
Rudin et al. proposed Total variation (TV) [12] which is a constrained optimization type of numerical algorithm for removing noise from images. The total variation of the image is minimized subject to constraints involving the statistics of the noise. The constraints are imposed using Lagrange multipliers. The solution is obtained using the gradient-projection method. This amounts to solving a time dependent partial differential equation on a manifold determined by the constraints, as the solution converges to a steady state which is the denoised image.
H. Non-local Means (NL-Means) Filter
NL-means filter, introduced by Buades et al., is based on the natural redundancy of information in images. It is due to the fact that every small window in a natural image has many similar windows in the same image [13]. The property of this filter is that the similarity of pixels has been more robust to noise by using a region comparison, rather than pixel comparison and also that matching patterns are not restricted to be local. That is, the pixels far away from the pixel being filtered are not penalized.
I. Anisotropic Diffusion (AD)
Technology (IJRASET)
[image:4.612.36.577.137.570.2]anisotropic diffusion filter it is necessary to extract a family of derived images of multiple scales of resolution in order to be able to identify global objects through blurring. Anisotropic models do not only take into account the modulus of the edge detector, but also its direction. In the anisotropic diffusion method, the gradient magnitude is used to detect an image edge or boundary as a step discontinuity in intensity.
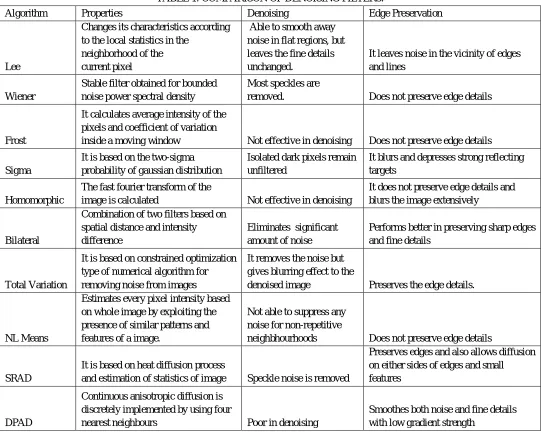
TABLE 1: COMPARISON OF DENOISING FILTERS.
Algorithm Properties Denoising Edge Preservation
Lee
Changes its characteristics according to the local statistics in the
neighborhood of the current pixel
Able to smooth away noise in flat regions, but leaves the fine details unchanged.
It leaves noise in the vicinity of edges and lines
Wiener
Stable filter obtained for bounded noise power spectral density
Most speckles are
removed. Does not preserve edge details
Frost
It calculates average intensity of the pixels and coefficient of variation
inside a moving window Not effective in denoising Does not preserve edge details
Sigma
It is based on the two-sigma probability of gaussian distribution
Isolated dark pixels remain unfiltered
It blurs and depresses strong reflecting targets
Homomorphic
The fast fourier transform of the
image is calculated Not effective in denoising
It does not preserve edge details and blurs the image extensively
Bilateral
Combination of two filters based on spatial distance and intensity difference
Eliminates significant amount of noise
Performs better in preserving sharp edges and fine details
Total Variation
It is based on constrained optimization type of numerical algorithm for removing noise from images
It removes the noise but gives blurring effect to the
denoised image Preserves the edge details.
NL Means
Estimates every pixel intensity based on whole image by exploiting the presence of similar patterns and features of a image.
Not able to suppress any noise for non-repetitive
neighbhourhoods Does not preserve edge details
SRAD
It is based on heat diffusion process
and estimation of statistics of image Speckle noise is removed
Preserves edges and also allows diffusion on either sides of edges and small features
DPAD
Continuous anisotropic diffusion is discretely implemented by using four
nearest neighbours Poor in denoising
Smoothes both noise and fine details with low gradient strength
IV. ASSESSMENT PARAMETERS FOR DESPECKLING
Various assessment parameters[12,13] that are used to evaluate the performance of denoising filters for speckle reduction and edge preservation are Peak Signal to Noise Ratio (PSNR), Root Mean Square Error (RMSE), Universal Quality Index (UQI), Structural Similarity Index (SSIM), Correlation Coefficient (CC), Noise Mean Value (NMV), Noise Standard Deviation (NSD), Mean Square Difference (MSD), Deflection Ratio (DR) and Equivalent Number of Looks (ENL).
A. Peak Signal to Noise Ratio (PSNR), Root Mean Square Error (RMSE), Universal Quality Index (UQI)
Technology (IJRASET)
(3)
(4)
(5)
B. Structural Similarity Index (SSIN)
The structural similarity (SSIN) [17] index measures the similarity between two images in a manner that is more consistent with human perception than traditional techniques. The range of values for the SSIN lies between −1, for a bad and 1 for a good
similarity between the original and despeckled images, respectively.
(6)
C. Noise Mean Value (NMV), Noise Variance (NV), and Noise Standard Deviation (NSD)
NV determines the contents of the speckle in the image. A lower variance gives a “cleaner” image as more speckle is reduced, although, it not necessarily depends on the intensity. The formulas for the NMV, NV and NSD calculation are as follows[18].
(7)
D. Mean Square Difference (MSD)
MSD[18] indicates average square difference of the pixels throughout the image between the original image (with speckle) and
denoised image.
Technology (IJRASET)
E. Equivalent Numbers of Looks (ENL)
The value of ENL[18] depends on the size of the tested region, theoretically a larger region will produces a higher ENL value than over a smaller region but it also tradeoff the accuracy of the readings. The formula for the ENL calculation is
(9)
The significance of obtaining both MSD and ENL measurements in this work is to analyze the performance of the filter on the overall region as well as in smaller uniform regions.
F. Deflection Ratio (DR)
The formula for the deflection ratio[18] calculation is
(10)
The ratio DR should be higher at pixels with stronger reflector points and lower elsewhere.
G. Correlation Coefficient(CC)
For digital images, the Pearson’s correlation coefficient [19] is defined where, xi and yi are intensity values of ith pixel in 1st and 2nd image respectively.
(11)
Also, xm and ym are mean intensity values of 1st and 2nd image respectively.
[image:6.612.44.573.490.645.2]V. RESULTS AND DISCUSSIONS
TABLE 2: PERFORMANCE ASSESSMENT OF DENOISING FILTERS.
PSNR RMSE UQI SSIN CC NMV NSD MSD DR ENL
Lee 26.5535 4.7872 0.5872 0.8113 0.553 29.752 8.0148 22.9594 1.075 13.78
anti-Technology (IJRASET)
[image:7.612.124.531.142.342.2]correlated. NMV value is used to calculate NSD of the denoised image. A lower NSD value gives a cleaner denoised image. A lower MSD indicates a smaller difference between the original (with speckle) and de-speckled image. The DR value should be higher for a denoised image. A larger value of ENL usually corresponds to a better quantitative performance. Comparison between the filters with the criteria’s of denoising and edge preservation is listed in table1.
Fig 1. Comparison of denoising filters
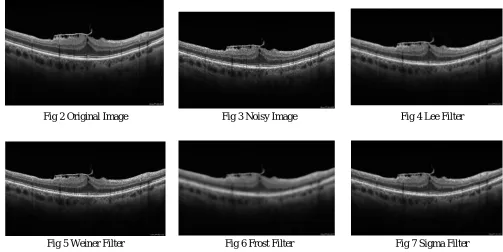
Fig 2 Original Image Fig 3 Noisy Image Fig 4 Lee Filter
Fig 5 Weiner Filter Fig 6 Frost Filter Fig 7 Sigma Filter
0 20 40 60 80 100 120
PSNR RMSE UQI SSIN CC NMV NSD MSD DR ENL
Lee
Wiener
Frost
Sigma
Homomorphic
Bilateral
Total Variation
NL Means
SRAD
[image:7.612.37.540.376.628.2]Technology (IJRASET)
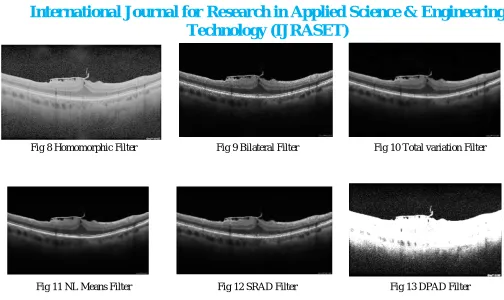
Fig 8 Homomorphic Filter Fig 9 Bilateral Filter Fig 10 Total variation Filter
Fig 11 NL Means Filter Fig 12 SRAD Filter Fig 13 DPAD Filter
Fig.1 gives statistics of the denoising filters that were executed. Fig.2 and Fig.3 are original and noisy images respectively. The outputs obtained from the execution of various denoising filters are listed from fig.4 to fig.13. The result shows that bilateral filter has a higher PSNR value, lower RMSE values compared to other filters. The UQI and SSIN values of the bilateral filter show that the quality and the structural similarity of the denoised image are improved. The correlation coefficient value of the bilateral filter indicates that there is less correlation between original image and denoised image. The ENL value of the bilateral filter shows that there are more uniform region in the denoised image, but the deflection ratio of the filter indicates that the reflection points of the denoised image is very low.
Both lee and weiner filters are based on the optimal minimum mean square error estimates of the original image. Both filters appear to reduce the speckle pattern, yet in homogenous regions some speckle patterns are visible. Total variation filter and SRAD filters removed the speckle noise causing some distortion to the image. The use of Frost and sigma filters resulted in some improvement to the PSNR value of the denoised image but the denoised image was blurred. Compared with other filters, Homomorphic filter exhibits less correlation between original image and denoised image and the visual contrast of the denoised image is too high. Besides, considerably increased deflection ratio of DPAD filter indicates that the speckle detection performance is poors.
VI. CONCLUSION
The performance metrics shows that among the different type of speckle reduction filters, bilateral filter removes substantial amount of noise without destroying important edges. Homomorphic filter is a frequency domain filter and rests of the filters are spatial domain filters. The spatial filters operate by smoothing over a fixed window and it produces artifacts around the object and sometimes causes over smoothing thus causing blurring of image. Wavelet transform is best suited for performance because of its properties like sparsity, multiresolution and multiscale nature. Further work can be carried out in the wavelet domain by modifying the bilateral filter to improve the deflection ratio of the image, which will strongly reduce speckle noise and preserves the edges of the denoised images.
REFERENCES
[1] Brett E.Bouma, Guillermo J Tearney, Handbook of Optical coherence Tomography, NewYork, Marcell Dekker 2002.
[2] Abd-Elmonien K, Youssef AB, Kadah Y (2002) Real-time speckle reduction and coherence enhancement in ultrasound imaging via nonlinear anisotropic diffusion. IEEE Trans Biomed Eng 49(9):997–1014
[3] Goodman, J. W. 1976. Some fundamental properties of Speckle, J. Opt. Soc. Am., 66, pp. 1145–1150. [4] Motwani, M.C., Gadiya, M. C., Motwani, R.C., Harris, F. C Jr. Survey of Image Denoising Techniques.
[image:8.612.39.543.37.337.2]Technology (IJRASET)
pp. 721–727, Mar. 2002.[6] J.S. Lee, “Digital image enhancement and noise filtering by use of local statistics,” IEEE Transactions on Pattern Analysis and Machine Intelligence, vol. 2, no. 3, pp. 165-168, 1980.
[7] Jingdong Chen,Jacob Benesty,Yiteng Huang, Simon Doclo,New Insights Into the Noise Reduction Wiener Filter, IEEE Transactions on audio, speech, and language processing, vol. 14, no. 4, July 2006.
[8] Frost, V. S.; Stiles, J. A. Shanmugan, K. S. Holtzman, J. C.“A model for radar images and its application to adaptive digital filtering of multiplicative noise”. IEEE transactions on pattern analysis and machine intelligence, Vol. 4, 1982, pp.157–165, 1982.
[9] J.S. Lee et al; Improved Sigma Filter for Speckle Filtering of SAR Imagery, IEEE transactions on geoscience and remote sensing, vol. 47, no. 1, January 2009 [10] A.K. Jain, Fundamentals of Digital Image Processing. Englewood Cliffs, NJ: Prentice-Hall; 1989.
[11] Danny Barash et al; A common framework for nonlinear diffusion, adaptive smoothing, bilateral filtering and mean shift, Image and Vision Computing 22 (2004) 73–81.
[12] L. I. Rudin, S. Osher and E. Fatemi, “Nonlinear total variation based noise removal algorithms,” Physica D, vol. 60, pp. 259-268, 1992.
[13] A. Buades, B. Coll, and J. Morel, “A non-local algorithm for image denoising,” Proc. IEEE international conference on computer vision and pattern recognition, pp. 60-65, 2005
[14] P. Perona and J. Malik, “Scale space and edge detection using anisotropic diffusion,” IEEE Trans. Pattern Anal. Machine Intell., vol. 12, no. 7, pp. 629-639, 1990.
[15] S.Sridhar, Digital Image Processing, Oxford University Press, 2011.
[16] Z. Wang, A.C. Bovik, “A universal image quality index”, IEEE Signal Processing Letters, vol. 9, no. 3, pp.81-84, 2002.
[17] C.P.Loizou et al; Comparative Evaluation of Despeckle Filtering In Ultrasound Imaging of the Carotid Artery, IEEE transactions on ultrasonics, ferroelectrics, and frequency control, vol. 52, no. 10, October 2005.
[18] Mario Mastriani, New Wavelet-Based Super resolution Algorithm for Speckle Reduction in SAR Images, World Academy of Science, Engineering and Technology 15 2008.