2017 2nd International Conference on Wireless Communication and Network Engineering (WCNE 2017) ISBN: 978-1-60595-531-5
Modeling and Simulation of Wireless Communication Reliability
Jing-rui WANG, Yuan-liang HUANG* and Wei-xiong CHEN
Institute of Electrical Automation, Jinan University, Guangdong, Zhuhai 519070, China
*Corresponding author
Keywords: Reliability, RSSI, ZigBee, SER, PLR, Pseudo loss.
Abstract. On the basis of analyzing the development status of the wireless communication technique, a new method to analyze the wireless communication reliability is proposed by using the Received Signal Strength Indication (RSSI). A wireless network model based on module CC2530PA is built, which is composed with a coordinator and a few terminal nodes. By analyzing the data received coordinator and sent terminal nodes, the relations of SER, PER and "pseudo-loss" phenomenon whit RSSI are studied, the model of relation between PER and RSSI is built, analyzing the reliability of wireless communication and threshold value of received data via the model. The research results have very high practical value and will promote the development of wireless communication in the future.
Introduction
The wireless communication technique is developed rapidly in now modem science and techno- logy, and applied broadly in industrial control, internet of things and home automation fields. The reliability of wireless communication is the important developmental foundation, and is a core technology to need to be solved in other communication technique. As a widespread use wireless communication technique, the ZigBee's reliability analysis is always the focus. FOR example, Martínez-Garrido and P. Daponte analyze the effect of wireless communication reliability. Currently, most of the researchers are studying on ZigBee's reliability from a single factor, like communication links, obstacles and external electromagnetic interference, etc. However, in this paper, Received Signal Strength Indication (RSSI), which can reflect the results of various factors
influence in complex condition, is used to analyze the reliability of wireless communication based on ZigBee, and relational model of RSSI and packet loss rate (PLR) is built. This research has important reference value to build the network wireless communication and design the distribution of each node.
Wireless Communication Network
Nowadays, ZigBee, Wireless LAN (Wi-Fi), Bluetooth, Ultra Wideband (UWB) and short-range wireless transmission are five most popular wireless technologies. And because wireless communication based on ZigBee has three characteristics: low-power consumption and Ad-Hoc network and good reliability, it is used in many applications.
National Bureau of Standards gives the definition of reliability, it means a product's ability to complete the required functions in specified conditions within set time. With the rapid development of the wireless network technology, the standard of reliability analysis is changed constantly. However, reliability analysis is an important prerequisite for developers to design and to optimize the wireless network structure, therefore, the reliability analysis of ZigBee technology turns to be crucial in our life.
In this paper, the wireless communication reliability is analyzed from the perspective of network transmission performance, and RSSI is used to characterize the communication signal strength, thus studying the relationship between the signal strength with symbol error rate and packet loss rate in wireless communication based on ZigBee.
the RSSI is, the stronger the signal is.
the conversion formula of RSSI and power is following:
RSSI=
mW 1
value power log
10 10 (1)
By definition (1), we know the corresponding RSSI value of 1mW power is 0dBm. On the wireless communication process, because the detected power in receiver is less than 1mW, the measured RSSI value is negative.
In this paper's experiment, a symbol represents a code element, so in the process of information transmission, max number of transport code element is 256 (from 0x00 to 0xFF).
For the convenience to analyze the reliability, three concepts are introduced:
Symbol Error Rate: Symbol error rate (SER) refers to the percentage of the number of error transmitted symbols within the total symbol transmission in due time, BER is a index to measure the reliability of the data transmission.
Packers Loss Rate: Packers loss rate (PLR) refers to the percentage of the number of packets that the recipient does not receive within the total number of packets sent by the sender in due time. PER reflects the transmission reliability.
Pseudo-loss: In "Pseudo-loss" phenomenon, data packets are not truly lost, but the disorder order phenomenon of arrival coordinator occurs, the pseudo-loss rate is a special reflection of wireless communication reliability.
The Analysis of Wireless Network Transmission Reliability
Platform Design
In our wireless network platform, the hardware used is TI's module CC2530PA, the core is CC2530, combines with CC2591 chip, achieving RF radio frequency circuit, and it also includes the crystal peripheral circuits, power supply decoupling and filtering circuit. Meanwhile, it leads all the available I / O pins out. The software design are to operate and compile the programming of CC2530 based on IAR provided by TI's integrated development environment.
In order to eliminate the affect of obstructions, the experiments to obtain data is carried out on different places, in which there exist different magnetic intensity and obstructions, detecting communication results by changing the distance between the coordinator and the terminal device.
This experiment system is composed with a plurality of nodes, where a coordinator receives information and networks, and the other nodes are terminal devices. After joining the ZigBee network, they send the specified array to the coordinator periodically. After the coordinator receives a data packet, it sends the data packet and the corresponding RSSI value to the computer terminal via serial to USB. By analyzing the collected data, the symbol error rate and the packet loss rate are calculated.
When to detect the symbol error rate, the dada format sent by terminal devices is SER packet. In experiments, when the packet number received at a certain distance is closing to 100, the next round of collection will begin, and the distance is changed from near to far. In the process of collecting data, the two adjacent interval of detecting points is slowly decreases for improving the fit accuracy.
When detect the packet loss rate, the dada format sent by terminal device is PLR packet, and the rules of changing distance are the same as the previous one, but this time, the distance is changed only if the number received packets is nearly 1000.
SER Analysis
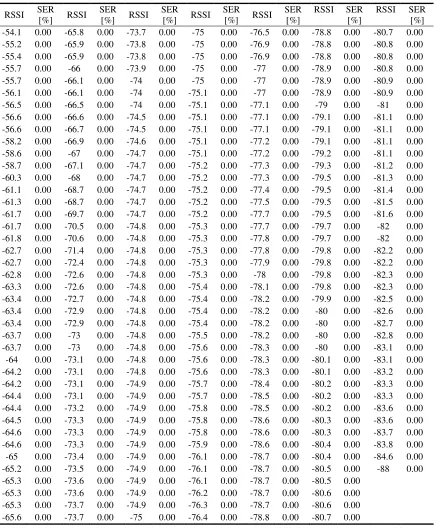
After processing, 283 groups obtained valid data pairs between RSSI and SER are as shown in Table 1.
Table 1. The relation table of RSSI and SER.
RSSI SER [%] RSSI
SER [%] RSSI
SER [%] RSSI
SER [%] RSSI
SER [%]
RSSI SER [%]
RSSI SER [%] -54.1 0.00 -65.8 0.00 -73.7 0.00 -75 0.00 -76.5 0.00 -78.8 0.00 -80.7 0.00 -55.2 0.00 -65.9 0.00 -73.8 0.00 -75 0.00 -76.9 0.00 -78.8 0.00 -80.8 0.00 -55.4 0.00 -65.9 0.00 -73.8 0.00 -75 0.00 -76.9 0.00 -78.8 0.00 -80.8 0.00 -55.7 0.00 -66 0.00 -73.9 0.00 -75 0.00 -77 0.00 -78.9 0.00 -80.8 0.00 -55.7 0.00 -66.1 0.00 -74 0.00 -75 0.00 -77 0.00 -78.9 0.00 -80.9 0.00 -56.1 0.00 -66.1 0.00 -74 0.00 -75.1 0.00 -77 0.00 -78.9 0.00 -80.9 0.00 -56.5 0.00 -66.5 0.00 -74 0.00 -75.1 0.00 -77.1 0.00 -79 0.00 -81 0.00 -56.6 0.00 -66.6 0.00 -74.5 0.00 -75.1 0.00 -77.1 0.00 -79.1 0.00 -81.1 0.00 -56.6 0.00 -66.7 0.00 -74.5 0.00 -75.1 0.00 -77.1 0.00 -79.1 0.00 -81.1 0.00 -58.2 0.00 -66.9 0.00 -74.6 0.00 -75.1 0.00 -77.2 0.00 -79.1 0.00 -81.1 0.00 -58.6 0.00 -67 0.00 -74.7 0.00 -75.1 0.00 -77.2 0.00 -79.2 0.00 -81.1 0.00 -58.7 0.00 -67.1 0.00 -74.7 0.00 -75.2 0.00 -77.3 0.00 -79.3 0.00 -81.2 0.00 -60.3 0.00 -68 0.00 -74.7 0.00 -75.2 0.00 -77.3 0.00 -79.5 0.00 -81.3 0.00 -61.1 0.00 -68.7 0.00 -74.7 0.00 -75.2 0.00 -77.4 0.00 -79.5 0.00 -81.4 0.00 -61.3 0.00 -68.7 0.00 -74.7 0.00 -75.2 0.00 -77.5 0.00 -79.5 0.00 -81.5 0.00 -61.7 0.00 -69.7 0.00 -74.7 0.00 -75.2 0.00 -77.7 0.00 -79.5 0.00 -81.6 0.00 -61.7 0.00 -70.5 0.00 -74.8 0.00 -75.3 0.00 -77.7 0.00 -79.7 0.00 -82 0.00 -61.8 0.00 -70.6 0.00 -74.8 0.00 -75.3 0.00 -77.8 0.00 -79.7 0.00 -82 0.00 -62.7 0.00 -71.4 0.00 -74.8 0.00 -75.3 0.00 -77.8 0.00 -79.8 0.00 -82.2 0.00 -62.7 0.00 -72.4 0.00 -74.8 0.00 -75.3 0.00 -77.9 0.00 -79.8 0.00 -82.2 0.00 -62.8 0.00 -72.6 0.00 -74.8 0.00 -75.3 0.00 -78 0.00 -79.8 0.00 -82.3 0.00 -63.3 0.00 -72.6 0.00 -74.8 0.00 -75.4 0.00 -78.1 0.00 -79.8 0.00 -82.3 0.00 -63.4 0.00 -72.7 0.00 -74.8 0.00 -75.4 0.00 -78.2 0.00 -79.9 0.00 -82.5 0.00 -63.4 0.00 -72.9 0.00 -74.8 0.00 -75.4 0.00 -78.2 0.00 -80 0.00 -82.6 0.00 -63.4 0.00 -72.9 0.00 -74.8 0.00 -75.4 0.00 -78.2 0.00 -80 0.00 -82.7 0.00 -63.7 0.00 -73 0.00 -74.8 0.00 -75.5 0.00 -78.2 0.00 -80 0.00 -82.8 0.00 -63.7 0.00 -73 0.00 -74.8 0.00 -75.6 0.00 -78.3 0.00 -80 0.00 -83.1 0.00 -64 0.00 -73.1 0.00 -74.8 0.00 -75.6 0.00 -78.3 0.00 -80.1 0.00 -83.1 0.00 -64.2 0.00 -73.1 0.00 -74.8 0.00 -75.6 0.00 -78.3 0.00 -80.1 0.00 -83.2 0.00 -64.2 0.00 -73.1 0.00 -74.9 0.00 -75.7 0.00 -78.4 0.00 -80.2 0.00 -83.3 0.00 -64.4 0.00 -73.1 0.00 -74.9 0.00 -75.7 0.00 -78.5 0.00 -80.2 0.00 -83.3 0.00 -64.4 0.00 -73.2 0.00 -74.9 0.00 -75.8 0.00 -78.5 0.00 -80.2 0.00 -83.6 0.00 -64.5 0.00 -73.3 0.00 -74.9 0.00 -75.8 0.00 -78.6 0.00 -80.3 0.00 -83.6 0.00 -64.6 0.00 -73.3 0.00 -74.9 0.00 -75.8 0.00 -78.6 0.00 -80.3 0.00 -83.7 0.00 -64.6 0.00 -73.3 0.00 -74.9 0.00 -75.9 0.00 -78.6 0.00 -80.4 0.00 -83.8 0.00 -65 0.00 -73.4 0.00 -74.9 0.00 -76.1 0.00 -78.7 0.00 -80.4 0.00 -84.6 0.00 -65.2 0.00 -73.5 0.00 -74.9 0.00 -76.1 0.00 -78.7 0.00 -80.5 0.00 -88 0.00 -65.3 0.00 -73.6 0.00 -74.9 0.00 -76.1 0.00 -78.7 0.00 -80.5 0.00
-65.3 0.00 -73.6 0.00 -74.9 0.00 -76.2 0.00 -78.7 0.00 -80.6 0.00 -65.3 0.00 -73.7 0.00 -74.9 0.00 -76.3 0.00 -78.7 0.00 -80.6 0.00 -65.6 0.00 -73.7 0.00 -75 0.00 -76.4 0.00 -78.8 0.00 -80.7 0.00
By table 1, we fine corresponding SER values are 0.00%, in other words, the probability of symbol errors phenomenon is very small.
Packet Loss Rate Analysis
In the experiment to analyze the relation between PLR and RSSI, 22568 packets are collected in 21 different intervals of RSSI value, which values range is from -4 to -91. In the experiment, the exceed 1000 data packets are regarded as a group to calculate the PLR of this group in the interval. Since there exists uncontrollable factors in the experiment environment, the signal strength will appear swing in collecting packets process, it is difficult to determine the specific signal strength, in this case, so the average value of all the collected RSSI in the interval is treated as the RSSI value of the received packets. The serial assistant can display the packets as line by line, each line is a data packet, and the received data will be stored in a document. note the sum numbers of the packets received by coordinator in a group n1, and the Packet loss number n2.
The data packets number are read by the C language programming, after taking a packet, the variable pktcount plus 1. After all the data are read, the pktcount value n1 is the number of the all
received packets. We define PER as follow
PER= n2÷(n1+n2)×100% (2)
After reading off a group, the current data packet number num and the last one num_pre are
compared, and through the result, we can determine whether the packet loss happens or not. Theory let the number of continuous loss packets is less than 256, then
① If num=num_pre+1 or num=0 and num_pre=255, n2k=0(k=0,1,2,…). ② If num_pre=255 and num≠0, n2i= num(i=0,1,2,…).
③ If num_pre<num≤255, n2j= num-num_pre-1(j=0,1,2,…). ④ If num_pre<255 and num=0, n2l =256-num_pre(l=0,1,2,…).
⑤ If num_pre<255 and num<num_pre,n2m=255-num_pre+num(m=0,1,2,…).
and
∑
∑
∑
∑
+ + + =m m l
l j
j i
i n n n
n n
2 2 2 2
2 . (3)
We can easy save above theory according to the places of compared packets.
Modeling of Reliability Analysis
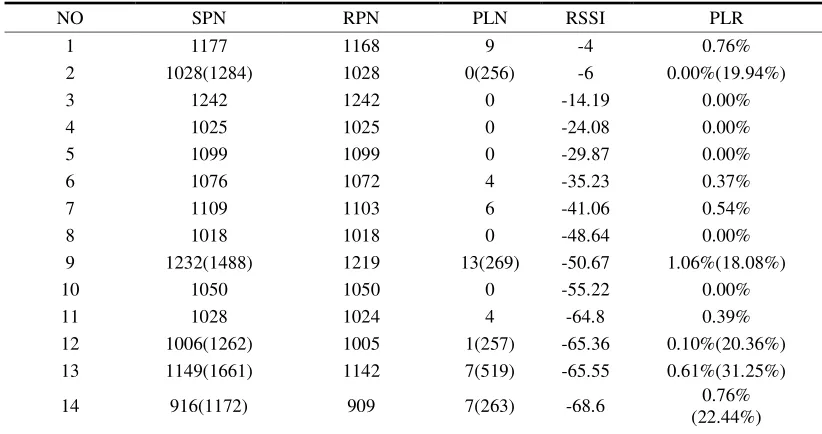
[image:4.612.99.510.534.751.2]By processing data and calculating the loss packet rate in 3.3 section, the relational data of RSSI and packet loss rate are obtained show as table 2. In table 2, some RSSI values are corresponded to two packet values or percentages, where one (above) is real PLR value, another(down) is the value of "pseudo-loss" phenomenon.
Table 2. The relation table of RSSI and PLR.
NO SPN RPN PLN RSSI PLR
1 1177 1168 9 -4 0.76%
2 1028(1284) 1028 0(256) -6 0.00%(19.94%)
3 1242 1242 0 -14.19 0.00%
4 1025 1025 0 -24.08 0.00%
5 1099 1099 0 -29.87 0.00%
6 1076 1072 4 -35.23 0.37%
7 1109 1103 6 -41.06 0.54%
8 1018 1018 0 -48.64 0.00%
9 1232(1488) 1219 13(269) -50.67 1.06%(18.08%)
10 1050 1050 0 -55.22 0.00%
11 1028 1024 4 -64.8 0.39%
12 1006(1262) 1005 1(257) -65.36 0.10%(20.36%) 13 1149(1661) 1142 7(519) -65.55 0.61%(31.25%)
15 1038(1294) 1035 3(259) -70.27 0.29%(20.02%)
16 1115 1110 5 -72.14 0.45%
17 1088(2112) 1088 0(1024) -76.39 0.00%(48.48%) 18 1179(1691) 1149 30(542) -80.66 2.54%(32.05%) 19 1107(1363) 1051 56(312) -83 5.06%(22.89%) 20 1184(2976) 1101 83(1875) -85.35 7.01%(63.00%)
21 1107 930 177 -87.97 15.99%
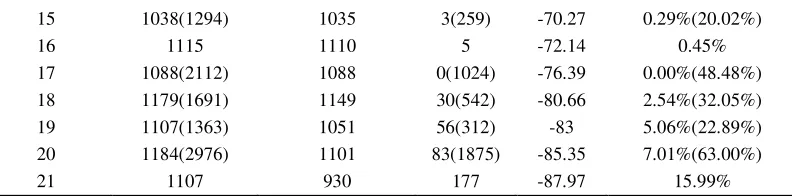
[image:5.612.111.507.64.162.2]Where SDN is sent packet number, RPN is received packet number, PLN is loss packet number. According to data in table 2, relation curve of RSSI and PER is obtained via fitting at least squares principle(as shown in Figure 1), and its fitting curve equation is
Figure 1. Relation chart of RSSI and PER.
y=1.279×10⁻¹¹×e-0.2641x (4)
first derivative of fitting curve is
y′=-0.33778×10⁻¹¹×e-0.2641x
If we require that PLR is less 0.1%, namely
| y|<0.1 % then when x=-68.81,
y|-68.81=0.00099812<0.1%. When x>-68.81,
|y′|<0.0002636≈0,
first derivative of fitting curve is tiny, which declare the change of PER is tiny and the value of PER is tiny too, so when x∈(-68.61, 0), PER is very low, the reliability of wireless network is high.
that is to say. When x<-68.81, first derivative of fitting curve |y′| begins to increase, for example,
|y′|-75=0.013518,
so PER value increase quickly,
y|-77.53=0.00998≈1%,
in other words, PER is increasing and the reliability of wireless network is low.
According to the definition of RSSI, we have when RSSI∈(-77.53, -68.61), the interval of
wireless signal value (mW) is (1.315×10⁻⁷, 1.766×10⁻⁸).
In this experiment, the coordinator doesn’t make response to the terminal reception device. Therefore, the following situations may probably cause the loss:
1) Poor wireless environment causes packet loss;
2) There exists the phenomenon of symbol error in the received packets, so the packet is abandoned.
Pseudo Packet Loss Phenomenon
In the wireless communication, there exists the "pseudo-loss" phenomenon (as shown in Figure 2) besides packet loss.
Figure 2. ‘Pseudo loss’ phenomenon.
In the transfer process, the phenomenon of packet disorder happens, namely packet is received but order of packet is error. For example as shown in Figure 2, the packet 31 is received ahead of the packet 30. We call it "pseudo-loss" phenomenon, which means packets arrive out of order, but it haven’t lost. Once the "pseudo-loss" phenomenon occurs, the number of loss packets increases 256, which is calculated by the theory. It means the packet loss rate increases substantially, and it affects the accuracy severely.
About the "pseudo-loss" phenomenon, we have the following analysis results:
1) The rate of wireless transmission is fast but the distance is limited, when a packet is disturbed in transmission, it is possible that latter packets arrive earlier, which confuses the arriving order, and the "pseudo-loss" phenomenon happens.
2) The smaller the RSSI value is, the more likely a "pseudo-loss" Phenomenon happens.
3) When the distance gets longer, the possibility of "pseudo-loss" is supposed to be larger, but because the packet loss rate is beginning increase, the possibility that a packet cannot reach the recipient becomes large, so the "pseudo-loss" phenomenon may not appear on the contrary.
Conclusions
Differs from most researches, which carry out research from a single element for reliability analysis, in this paper the RSSI values of ZigBee, which reflect influences of many factors, are used to
analyze the SER, PLR and the "pseudo-loss" phenomenon of wireless communication.
By studying the relationship between the SER and RSSI in the communication process based on ZigBee, we will do a Cyclic Redundancy Check (CRC) in the interval that the vaults of SER and PER, and abandon the error packets.
In view of the "packet loss" phenomenon and the "pseudo-loss" phenomenon, we propose the following recommendations for the wireless communication based on ZigBee:
1) Ensure that the RSSI value between key nodes is large enough, but the nodes should not be too close.
2) Make sure the RSSI value between nodes, which have direct communication links, is not less than-68.81, in specific application. In the tree topology, the children nodes do not communicate with each other, which subject to different parent nodes, therefore, to set these child nodes is not limited by the RSSI value;
Acknowledgment
This research is supported by the fund of Guangdong Province scietific project (2013B010401019) and Zhuhai City collaborative innovation center.
References
[1] Wenzhong. Li and Chaoyu. Duan, et al: ZigBee 2006 Wireless Network and Wireless Location combat. Beijing: Beihang University Press 2008.
[2] Lingling. Cao: Reliability Analysis in Wireless Networks. Nanjing: Nanjing University of
Aeronautics and Astronautics, 2012.
[3] Ali Safa Sadiq1, Kamalrulnizam Abu Bakar, et al. A smart handover prediction system based on curve fitting model for Fast Mobile IPv6 in wireless networks. Int. J. Commun. Syst. 2014;
27:969-990.
[4] Zhihong. Qian, Dayang. Sun and L. Victor: Survey on Localization Model in Wireless Networks.
Chinese Journal of Computers, 2016, 36(6) pp. 1239-1253.
[5] Hengjun. Zhu, Baoji. He, Hong Liang, Nannan. Zhang: Research on Optimization Method of Personnel Positioning in Mine Based on Zigbee. Computer Simulation, 2015, 32(11) pp. 311-314.
[6] Wenkjing. Liu, Tongfei. Zhang, Zhizhen. Hu, Peng. Hu, Peng. Yang, Jingbo. Guo: A Transmission Line Monitoring Device Based on Ultrasonic and Wireless Networking Technologies.
Automation of Electric Power Systems, 2013, 37(10) pp. 98-103.
[7] Shangbin. Jiao, Dan. Song, Qing. Zhang, Jinwei. Tang: Coal mine monitoring system based on Zig Bee wireless sensor networks. Journal of Electronic Measurement and Instrumentation, 2013,
27(5) pp. 436-442.
[8] Zhou. Lv: Research and Implementation of ZigBee Wireless Location Network. Wuhan:
Huazhong University of Science and Technology, 2009. Qiaoyun. Chen: Research of Link Reliability on ZigBee Wireless Sensor Network. Dalian, 2008.
[9] M.I. Martínez-Garrido, R. Fort. Experimental assessment of a wireless communications platform for the built and natural heritage, Measurement, 2016, 82: 188-201.
[10] P. Daponte, L. De Cito, F. Picariello, S. Rapuano, I. Tudosa, Prototype design and experimental evaluation of wirelesss measurement nodes for road safety, Measurement, 2014, 57:
1-14.
[11] F. Leccese, Remote-control system of high efficiency and intelligent street lighting using a zigbee network of devices and sensors, IEEE Trans. Power Delivery, 2013, 28: 21-28.
[12] O. Casas, M. López, M. Quílez, X. Martínez-Farre, G. Hornero, C. Rovira, M.R. Pinilla, P.M. Ramos, B. Borges, H. Marques, P. Silva Girão, Wireless sensor network for smart composting monitoring and control, Measurement, 2014, 47: 483–495.