2016 Joint International Conference on Artificial Intelligence and Computer Engineering (AICE 2016) and International Conference on Network and Communication Security (NCS 2016)
ISBN: 978-1-60595-362-5
Infrared Image Segmentation Based on AAFSA and 2D-Renyi
Entropy Threshold Selection
Xiao-Feng LI, Hui-Ying LIU, Ming YAN, Tai-Ping WEI
Armored Force Institute, Bengbu, China [email protected]
Keywords: Infrared Image, Segmentation, 2D-Renyi Entropy, AAFSA.
Abstract. To select optimal parameter a in decomposed 2D-Renyi entropy image threshold segmentation method, a new adaptive method according to the uniformity measure which is an image segmentation evaluation criteria is proposed based on adaptive artificial fish-swarm algorithm(AAFSA). Experiment results show that the method can get desired segmentation result for each image. The algorithm is of universality and can also reduce the computational complexity from O(L6) to O(L2).
Introduction
Wavelength of the infrared image is longer than other waves. But limited by craftsmanship, which produces the infrared image that is a low resolution, poor resolution, heterogeneity. In order to solve the problem above, many scholars have discussed and studied this problem: In view of low SNR and contrast of the infrared image to propose the study of image enhancement; In view of heterogeneity of the infrared image to propose the study of non-uniformity correction; In view of poor resolution of the infrared image to propose the study of edge detection. The flaws are large computation and unconspicuous effect by the above methods for the complex and multiple infrared images. However, the image segmentation can resolve the related problems well, which means the characteristics of image into regional extracts interested target technology and process. As the basis of image analysis, understanding and recognition, it can simplify or change expression of the infrared image, make the image more likely to be analyzed and understood.
After analyzing characteristics of low contrast and large noise for the infrared image, in view of good segmentation results for the 2D-Renyi entropy threshold method and high global searching ability for the artificial fish swarm algorithm (AFSA), an infrared image segmentation method based on combination for improved AFSA and 2D-Renyi entropy threshold method is proposed, which uses the AFSA to choose a best threshold value adaptively to the correspond parameter α. In comparison with existing methods, its computational complexity can be decreased from O(L6) to
O(L2).The experimental results show that the method not only gives the good segmentation effect
and anti-noise ability but also spends less computation time.
The Threshold Selection and Parameters of Quality Evaluation for 2D-Renyi entropy Threshold Method
The Threshold Selection for 2D-Renyi Entropy Threshold Method
Suppose an image which has L pixel grey-scale, whose collection of pixel grey-scale is Gx={0,1,∙∙∙,L-1} and the width of window is k, the average pixel gray-scale of which is in L pixel
grey-scale in neighborhood of k×k, collection of which is Gx= {0,1,∙∙∙,L-1}. Corresponding to an
image whose size is M×N, the formula f(x,y) is used for pixel grey-scale of point (x,y) in the image, the formula g(x,y) for the average pixel grey-scale for point g(x,y), since the g(x,y) is defined as follows:
/2 /2
/2 /2
1
( , ) ( , )
k k
i k j k
g x y f x i y j
k k
Suppose cij representing the times of the tuple (i,j), consisting of the pixel grey-scale i and the
neighborhood average pixel grey-scale j which appear in the image, so the probability for point (i,j ) is cij
ij
P
M N
.
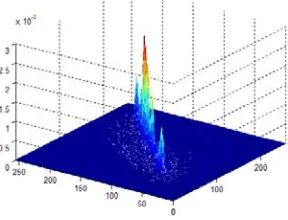
[image:2.612.234.378.166.276.2]The Lena 2D histogram in the standard library is Figure 1. For all pixel in the image ,the objective region and background region are in the proportion, which are distributed evenly, where the peak value appears in the diagonal region, away from where is similar.
Figure 1. Lena 2D Histogram.
Suppose threshold tuples (s,t) divides the 2D-histogram into four regions, one of which is corresponding to the target region, another is corresponding to the background region, the rest of two are corresponding to edge and noise. According to 2D-Renyi entropy principle which is proposed by Sahoo, the 2D-Renyi entropy of the image is defined as follows[1]:
1 1
0 0 0 1 1 0
1 1
( , ) ln ln
1- ( , ) 1- 1 ( , )
s t L L
ij ij
i j i s j t
P P
H s t
P s t P s t
α
(1)
In here, the 0
0 0
( , ) s t ij i j
P s t P
, the α is a constant.According to the 2D maximal entropy principle, when the Hα(s,t) reaches the maximum value, the
dualistic group (s,t) shows the optimal threshold, so the best threshold vector (s*,t*) is defined as follows:
* *
0 , 1
( , ) max ( , )
s t L
s t Arg H s t
Parameter Evaluation for Evenness Testing
In order to get optimized parameters, the method based on criteria of image segmentation evaluation to obtain the better parameters is presented in this paper, the uniformity measurement of which is an indicator for the image segmentation algorithm. For the area in an image, the smaller for the uniformity in one area, the more concentrated for grey-scale distribution. Assuming the threshold segmentation is applied to the point (T,S), the uniformity measurement of which is defined as follows[2]:
2 2
2 ( , ) 2
1 2
( , )
( , ) =1 [ ( , ) ] i
i
x y R
i i i
x y R i
F x y
U M F x y
C A
σ σ ,σ μ ,μ
(2)
In here, the i=1,2,R says the area i of segmentation, the F(x,y) says pixel grey-scale of the coordinates for point (x,y), the Ai says the total number of pixel in the area Ri, the C says the
normalized parameter. According to the above definitions, the optimum solution for the parameter α
is defined as follows:
*= arg max{UM( )}, 0
Adaptive Artificial Fish-Swarm Algorithm, AAFSA
AFSA is an algorithm that simulates the social behavior of fish-swarm to seek the optimum solution, which simulates the foraging, cluster and rear-ending of fish-swarm to find out the optimal solutions by local searching of every fish[3]. As a new method of optimization, AFSA has many advantages, such as nice robust, good global convergence and lacking of sensitivity for initial value, which is defined as follows:
1) The foraging behavior: It is a behavior that each fish moves towards the food source. Assuming that the current state of the fish-swarm is Ya, the state which is selected randomly within
the field of vision is Yb, which is defined as follows[4]:
b a+ .
Y Y Visual Rand (4)
In here, the function Rand() generates a random number from 0 to 1, the visual is the field of view of the fish-swarm. When the concentration of food Xa>Xb, the fish-swarm moves one step to that
direction, this process is defined as follows[5]:
1 . .
t
t t b a
a a t
b a
Y Y
Y Y Step Rand
Y Y
(5)
In here, the step is the length of moving of the fish-swarm, if the condition for moving forward is not met, the fish-swarm reselects the state Yb in their field of view. Repeat the above steps, if the
condition for moving forward is not met, the Ya randomly moves one step to achieve a new state.
2) The cluster behavior: It is an optimization behavior that each fish moves as far as possible toward the center of fish-swarm to avoid congestion. Assuming that the current state of a fish is Ya, the neighbor number is nf. When nf 1)
N δ, ( 0 δ , it shows that there is not only enough food, but also is uncrowded, then the fish moves one step to the central position Yc, and Xa>Xc, this process is
defined as follows:
1= t . .
t t c a
a a t
c a
Y Y
Y Y Step Rand
Y Y
Otherwise, perform other behaviors.
3) The rear-ending behavior: It is a behavior that a fish moves to the optimal direction in its visible range. Assuming that the current state of a fish is Yi, whose optimal neighbor is Ymax in its
neighborhood by detecting, the number of neighbor is nf. It shows that there is not only enough food, but also is uncrowded, then the fish moves one step to the position Ymax, this process is
defined as follows:
1 max
max
= . .
t
t t a
a a t
a
Y Y
Y Y Step Rand Y Y
Otherwise, perform the foraging behavior.
Calculate the 2D-Renyi Entropy Based AAFSA
Figure 1. Algorithm Flow Chart.
The main thought of this algorithm is that the AFSA is combined with 2D-Renyi entropy image segmentation algorithm to select optimized value for parameter α. The UM value of evenness tester is adopted as the object function.
The detail step of algorithm is as follows:
4) Initialize parameters for AAFSA: Initialize the parameters such as initial number of artificial fishes, initial position, sense limit, initial step-length, congestion factor, decay factor, maximum try times and iteration times.
5) Bulletin board assignment: Calculate the objective function values of each artificial fish to get optimal state of artificial fish and assign the best value to bulletin board.
6) Behavior Choice: Each artificial fish simulate the collision and cluster behavior based the comparison of objective function value. The default behavior is foraging behavior.
7) Update the bulletin boar: Each artificial fish compare itself function value with the value of bulletin board. If superior to the value of bulletin board, update the value of bulletin board.
8) Judge if exceed maximum iteration times: If exceed maximum iteration times T, go to step 6),otherwise repeat step 3)~ 5).
9) Output the optimal solution: Calculate the optimal segmentation threshold value (s,t)max of image I according to α. The output of segmentation is image I’.
Validated by many times experiment, the parameters of artificial fishes are set as following: N=20, Visual=2.5, initial step-length=0.1, decay factor r=0.95, crowding factor &=0.618 and tryNumber=6.
Simulation Experiments and Results Analysis
The system configuration of experimental environment is as follow: The dominant frequency of CPU is 3.4 GHz, memory capacity is 4GB and Matlab 7.1
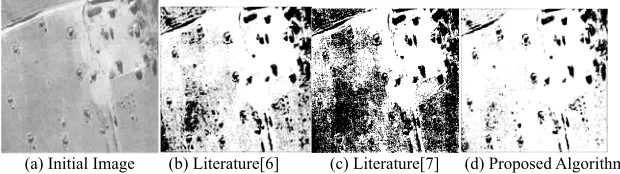
[image:4.612.140.472.514.604.2](a) Initial Image (b) Literature[6] (c) Literature[7] (d) Proposed Algorithm
Figure 2. Segmentation Result of Team Marching Figure.
(a) Initial Image (b) Literature[6] (c) Literature[7] (d) Proposed Algorithm
[image:4.612.154.464.633.720.2][image:5.612.141.479.66.159.2]
(a) Initial image (b) Literature[6] (c) Literature[7] (d) Proposed algorithm
Figure 4. Segmentation Result of Cameraman figure.
In order to verify the validity and robustness of algorithm, a lot of infrared images with different gray level distribution are selected to process the experiment. The experiment include: the proposed algorithm in this paper, the algorithm in literature [6] and literature [7]. The segmentation threshold comparison results are listed in Table 1.
Table 1. Comparison of Segmentation Threshold.
Image Literature [6] Literature [8] Proposed algorithm
Team marching figure (165,169) (164,166) (166,171)
Structures distribution figure (158,157) (158,156) (163,170)
Cameraman figure (110,115) (147,191) (101,102)
Table 2. Comparison of Riming Time of Algorithm (Units: Second).
Image Literature [6] Literature [7]
Team marching figure 6.2456e+004 6.5314
Structures distribution figure 6.4352e+004 5.4365
Cameraman 7.8324e+004 7.9524
Conclusion
After comparing other algorithms with the test ones, it seems that good segmentation effect is shown by using the algorithm proposed in this paper in both simple and complicated infrared image. After segmentation, the image contour is clear and surface is distributed. In the paper, the parameter
α is essential to segmentation effect based 2D-Renyi Entropy Threshold Selection. In the paper [6], the image segmentation based on decomposition of 2D-Renyi entropy threshold selection assigns the value is 0.7 to α to obtain good segmentation effect for some images, but which need a lot of experiments to find the appropriate parameter α for other images. In the paper [7], the image segmentation based on adaptive parameter selection of 2D-Renyi entropy threshold can solve the problem in the paper [6] which the parameter α need assign ahead, but which’s operation time is too long, and the segmentation effect is less effective than the paper [6]. The algorithms in this paper not only solves parameter selection in the paper [6], but also reduces operation time in compared with the paper [7], and, above all, segmentation effect is better than the paper [6] and the paper [7].
References
[1]Prasann Sahoo, Gurdial Arora. A Thresholding Method Based on 2D-Renyi’s Entropy [J]. Pattern Recognition, 2004, 37: 1149-1160.
[2]Nickels K., Hutchinson S. Estimating uncertainty in ssd-based feature tracking [J]. Image Vision Computer, 2002, 20(1): 47-58.
[image:5.612.122.489.364.431.2][4]Luxburg U.V. A tutorial on spectral clustering [J]. Statistics and Computing, 2007, 17(4): 395-416.
[5]Sanguinetti G., Laidler J., Lawrence N. Automatic Determination of the Number of Clusters Using Sprctral Algorithms [C]. Proc of IEEE Machine Learning for Signal Processing, 2005: 28-30. USA: IEEE, 2005.