Structured approach to measure performance in
Construction Research and Development: Performance
Measurement System Development
A
A
b
b
s
s
t
t
r
r
a
a
c
c
t
t
Research and development (R&D) activities are identified as vital to address the challenges faced by the construction industry. Despite the importance, there are number of issues that hinder the success of construction R&D activities such as lack of accountability of the R&D resources, inadequate mechanisms to evaluate the success, output not addressing the requirements of the stakeholders, lack of communication and coordination between the parties involved in the R&D process etc. These issues have resulted in producing research results with low applicability and have discouraged the investment towards construction R&D. It has been revealed that the cause of a majority of the issues in construction R&D is directly or indirectly rooted with the lack of evaluation mechanisms implying the need for performance measurement (PM). Therefore this study addresses this eminent need by exploring PM applications and by developing a structured approach to measure the performance of collaborative construction R&D during its lifecycle from initiation, conceptualising, development and launch stages and at the project management.
PMS consists of critical success factors, performance indicators and performance measures during the lifecycle of a R&D project.
Key words: Construction industry, research and development, critical success factors, performance measurement
I
I
n
n
t
t
r
r
o
o
d
d
u
u
c
c
t
t
i
i
o
o
n
n
Research and development (R&D) has been identified as a driving force for the success of the construction industry (Barrett, 2007; Fox and Skitmore, 2007). Similarly, Hampson and Brandon, (2004) view R&D as an overarching strategy for the construction industry in addressing its goals. Prioritising R&D activities, creating longer term R&D programmes and increasing investment on R&D activities are therefore recognised as vital factors for the growth of the construction industry (Hampson and Brandon, 2004; Fairclough, 2002). Dulaimi et al (2002) assert that lack of R&D within the construction industry as one of the main reasons for its underperformance. Due to the cost and resources involved for R&D activities, the notion “imposing financial constraints could negatively affect the freedom and creativity of R&D activities” (Roussel et al, 1991) has been challenged. With this challenge, much attention is given on identifying the actual contribution from R&D activities towards the development and towards the competitive advantage of the organisation (Chiesa and Frattini, 2007; Germeraad, 2003). Managers are therefore, under pressure to monitor and improve the performance of R&D activities (Kerssens-van Drongelen et al, 2000).
goals, identifies the strengths and weaknesses, decides on the future actions needed for improvements and provides data to request additional resources. PM in R&D could also identify the proper resource allocation within organisations (Bremser and Barsky, 2004; Pearson et al., 2000; Kerssen-van Drongelen and Bilderbeek, 1999) whilst improving the communication and coordination of the R&D activities (Bremser and Barsky, 2004; Loch and Tapper, 2002). Research carried out in various industries indicates that long term competitive advantage depends on commitment to ongoing R&D work and the use of PM applications to evaluate its success (Osawa and Yamasaki, 2005; Pearson et al, 2000; Kerssens-van Drongelen et al, 2000; Kerssens-van Drongelen and Bilderbeek, 1999; Werner and Souder, 1997; Tipping et al, 1995; Brown and Svenson, 1988).
non-existence of effective validation/feedback and evaluation mechanisms within construction research as a “fundamental missing link”. This was further proven by Kulatunga et al’s (2007) theoretical investigation on to current PM literature and issues within construction R&D. Even though a number of studies are carried out in R&D performance measurement in other disciplines, a paucity of literature was evident within construction R&D and its PM applications. To address this research gap the study investigates the PM applications within construction R&D and develops a performance measurement system (PMS) to evaluate the performance of construction R&D.
The paper first discusses the existing PM applications in research and development. This is followed by the research method adopted for the study. Data analysis and results are presented next. The paper presents a discussion by evaluating the strengths of the PMS developed through the empirical investigation and draws up contribution to knowledge and further research from the conclusion.
R
R
e
e
s
s
e
e
a
a
r
r
c
c
h
h
a
a
n
n
d
d
d
d
e
e
v
v
e
e
l
l
o
o
p
p
m
m
e
e
n
n
t
t
p
p
e
e
r
r
f
f
o
o
r
r
m
m
a
a
n
n
c
c
e
e
m
m
e
e
a
a
s
s
u
u
r
r
e
e
m
m
e
e
n
n
t
t
s
s
y
y
s
s
t
t
e
e
m
m
s
s
a
a
n
n
d
d
m
m
e
e
a
a
s
s
u
u
r
r
e
e
s
s
PM in R&D has undergone major changes over the last few decades. Technological advances and customer and profit-oriented markets have demanded R&D to facilitate broad areas of activities such as differentiations, time to market, value for money, service and economic production (Cooper, 1998; Smith and Reinertsen, 1998). The need to go beyond financial measures and consider customer and shareholder value, business processes, organisational learning and growth are therefore identified and emphasised (Pearson et al, 2000). Further, the use of financial measures as the only criterion of R&D PM has been challenged as they are lagging indicators and not connected with the operational activities (Loch and Tapper, 2002). As a result, multiple and integrated performance measures that combine qualitative, quantitative, objective and subjective measures are identified as more effective ways to measure the performance of R&D work. Bremser and Barsky (2004) view that for the successful attainment of management strategies and aims and objectives, integrated PMSs are required as they capture the changes in financial and non-financial aspects of organisational performance. However, Cooper and Kleinschmidt (2007) assert that having multiple performance measure on R&D activities could confuse and make the implementation of PM more complex.
out a survey and identified 14 categories of R&D performance measures. Most of the measures identified from this categorisation, are output based. Griffin and Page (1993) classify the measures into four groups: customer acceptance; financial; product level; and organisation level. The categorisation of R&D performance measures according to Kaplan and Norton’s (1992) Balanced scorecard (BSC) i.e. according to financial, customer, internal business process and learning and growth perspectives can be identified in number of instances (Yawson et al, 2006; Bremser and Barsky, 2004; Kerssens-van Drongelen et al, 2000; Kerssens-van Drongelen, 1999; Kerssens-van Drongelen and Cook, 1997). The use of BSC provides an integrated PMS to implement the strategy while comprehensively and appropriately covering the vital areas of PM in the R&D environment (Yawson et al, 2006; Bremser and Barsky, 2004; Kerssens-van Drongelen et al, 2000). Godener and Soderquist (2004) identify three more classifications to measure performance, in addition to the four perspectives used in the BSC. They are strategic (strategic goal satisfaction), technology management (generation of new competitive products) and knowledge management (return on investment in terms of knowledge creation, knowledge transfer and knowledge exploitation). Coccia (2004) measures the performance of public research institutes using five measures (training, finance, national publications, teaching, international publications). In another study, the application of the European Foundation for Quality Management (EFQM) model for a research organisation can be identified by assigning performance measures for customer, people, social and business attributes (Weggeman and Groeneveld, 2005).
R
R
e
e
s
s
e
e
a
a
r
r
c
c
h
h
m
m
e
e
t
t
h
h
o
o
d
d
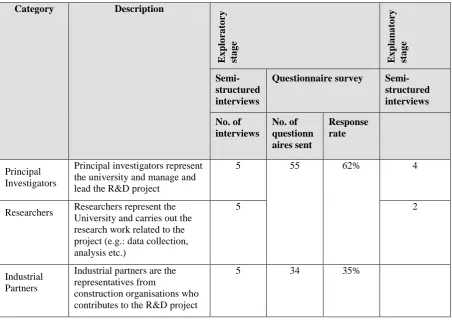
Collaborative construction R&D activities initiated by universities were selected as the unit of analysis of the study whilst data was gathered from the parties involved in the research collaboration (Principal investigators, Researchers and Industrial Partners). The study was based around the lifecycle of a R&D project from initiation, conceptualisation, development and launch stages and at the project management. The study consisted of two main phases: exploratory phase to develop the PMS and explanatory phase to refine the PMS. The details of the interviews and questionnaire survey respondents are given in Table 1.
Insert Table 1
The approach to the development of PMS was based on the concept that “implementation of the key success criteria could improve performance” (Thakkar et al, 2007). Accordingly, the study evaluated CSFs of construction R&D and derived the performance indicators and measures (component parts of performance indicators) to align with the CSFs. The following section describes data collection in detail.
Exploratory phase of the study
Step1: Establishment of the need for PM in construction R&D
Step 2: Derive critical success factors of construction R&D
The CSFs were derived by evaluating the success factors of construction R&D activities. To gather the success factors, respondents were questioned about “what they pursue as success factors in construction R&D” during initiation to launch phases and at the project management of R&D projects. This was done through a series of semi structured interviews and analysed by using content analysis.
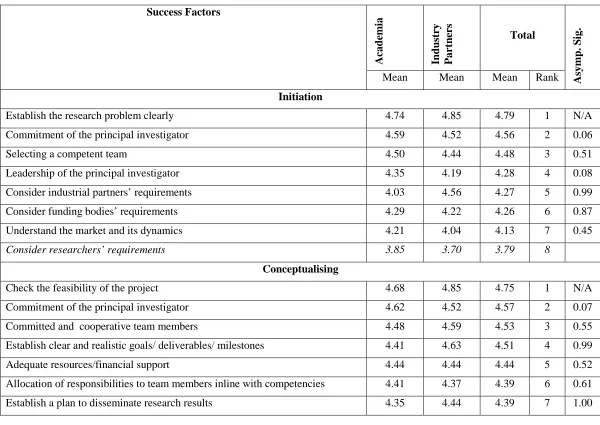
In addition, a comprehensive literature review was carried out to investigate the success factors of R&D in general and with particular reference to R&D in construction. Having identified the success factors from semi-structured interviews and literature, a questionnaire was compiled. A five-scale Likert scale was used to capture the importance of the success factors (refer to Table 2). Table 2 shows the values assigned for the Likert scale used for this study.
Insert Table 2
moderately important (value 3) based on the assigned values of the questionnaire survey analysis (refer to Table 2). Following this, during the second stage Wilcoxon signed rank test was used for the remaining success factors i.e. the factors that have an overall mean value above 4. By taking a consecutive pair of data, the Asymptotic significance was calculated. The Asymptotic significance shows an estimate of the significance of differences within attributes being tested (Pallant, 2001). Generally, Asymptotic significance less than 0.05 is considered as indicating a significant difference between the attributes being tested. Accordingly, the paired data which showed an Asymptotic significance < 0.05 was considered as responses having a significant difference regarding the importance of the success factors, hence such factors were considered as not critical for the success of construction R&D projects (Please note that in Table 3, Asymptotic significance was not calculated for the non-critical success factors).
Step 3: Derive performance indicators and measures
Having established the CSFs of construction R&D activities, the next step was to identify the performance indicators and measures related to CSFs. A section of the questionnaire survey was therefore, structured to capture the existing performance indicators and measures used by the respondents.
Step 4: Development of the PMS for construction R&D
During the final step of the exploratory phase, a PMS was drafted for construction R&D activities by using the CSFs, performance indicators and measures derived empirically and theoretically.
Step 1: Refinement of the PMS
The main intention of this stage was to identify the impact of the developed PMS on the success of construction R&D activities. However, implementing the PMS within a construction R&D project within the scope of the study was limited due to the time span of R&D projects. To overcome this limitation, the authors sought to gather the views of experts involved in research projects regarding the impact that the developed PMS could have on the success of R&D work. In addition to identifying the impact, it was also intended to refine the developed PMS during the explanatory stage.
A series of semi structured interviews were carried out during this phase (refer Table 1 for details). The respondents were questioned about the completeness of the CSFs, performance indicators and performance measures; ease of understanding of the PMS; applicability of the PMS to construction R&D and the impact of the PMS.
D
D
a
a
t
t
a
a
a
a
n
n
a
a
l
l
y
y
s
s
i
i
s
s
a
a
n
n
d
d
r
r
e
e
s
s
u
u
l
l
t
t
s
s
Current status of performance measurement applications in construction
research and development
R&D process and lack of communication of the results to the people involved in. In supporting this view similar studies carried out in construction R&D revealed that lack of communication on the performance of the R&D project has weakened the interest of funding bodies and industrial partners resulting in low level of investment and contribution (Gann, 2001; Seaden and Manseau, 2001; Print, 1999; Hodkinson, 1999; CRISP consultancy commission, 1999). Moreover, feedback on the ongoing R&D process would enable further improvements to the future process. Thus, creating appropriate feedback loops, effective communication on the progress to the involved parties and obtaining the views of the beneficiaries towards the ongoing R&D activities can be highlighted as important.
Critical success factors of construction R&D
The study derived CSFs for construction R&D under the phases of initiation, conceptualisation, development, launch and for the project management. Table 3 shows the mean values and wilcoxon signed rank text results for the CSFs. As Table 3 indicates, at initiation and conceptualising phases, establishment of a clear research problem and ensuring clarity and focus of the research work were highlighted to provide a proper foundation for the research work. Skills, commitment and motivation of the team members and having adequate resources specially the human resource were being evident as critical during the conceptualising and development phases. Effective dissemination of work for the advantage of the beneficiaries was highlighted during the launch phase. Throughout the R&D project, the importance of project coordination and resource management were emphasised.
The CSFs identified from the empirical investigation have both similarities and differences with those identified in studies carried out in other disciplines. Some of the similarities can be listed as commitment of the principal investigator (Cooper and Kleinschmidt, 2007; Lester, 1998), proper up-front work (Cooper and Kleinschmidt, 2007), committed and skilled research teams (Fairclough, 2002), need for mechanisms to monitor and control the R&D projects (Lorch, 2000; Seaden and Manseau, 2001), well established operational procedure (Cooper and Kleinschmidt, 2007). The CSFs like satisfying the requirements of funding bodies and industrial partners, establishment of a dissemination plan and the effective dissemination of work were not disclosed from the studies carried out in other disciplines.
Performance indicators and measures for construction R&D
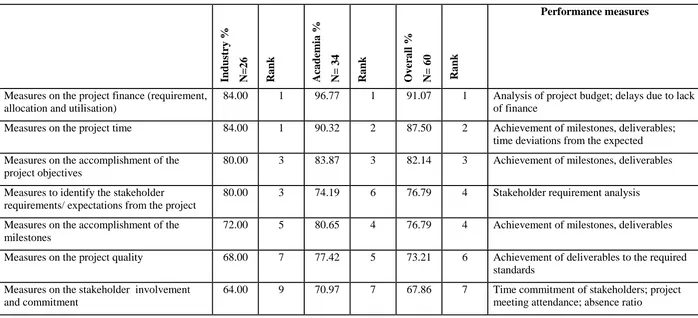
As explained in step 3 of the exploratory phase (refer research method section), the study evaluated the use of performance indicators and measures from the questionnaire survey. There were three questions on identifying the performance measures used by the researchers. When constructing the questionnaire, these questions were excluded from the industrial partners’ questionnaire due to their irrelevance to them. Table 4 shows the percentage usage of performance measures during the construction R&D project and ranked them accordingly.
It was revealed that the performance measures which are required to satisfy the stakeholder requirements (funding bodies’ and industrial partners’) are being well implemented within R&D project. More than 70% of the respondents have identified the use of measures on project finance, time, and accomplishment of objectives, milestones and quality within the R&D project. Moreover, a higher usage of performance measures on the identification of stakeholder requirements from the project was also viewed as important by both industrialist and academic members. This proves the fact that during the R&D project as it moves from initiation to launch phases, more attention was paid to identifying and satisfying the stakeholders’ (funding body and industrial partners) requirements through achieving the cost, time, quality targets and accomplishing the project objectives. This fact further coincides with the identification of CSFs of construction R&D as consideration and satisfaction of the funding bodies and industrial partners are being treated as CSFs during the R&D project (refer Table 3).
indicators identified from the study as the measures on the learning and growth of the researchers, education and training of the researchers and identification of the satisfaction of the researchers were not given much emphasis by the respondents of the study (refer Table 4).
Insert Table 4
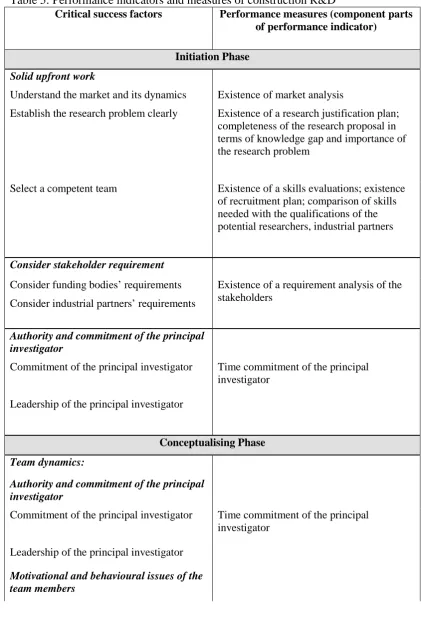
Development of PMS for construction R&D
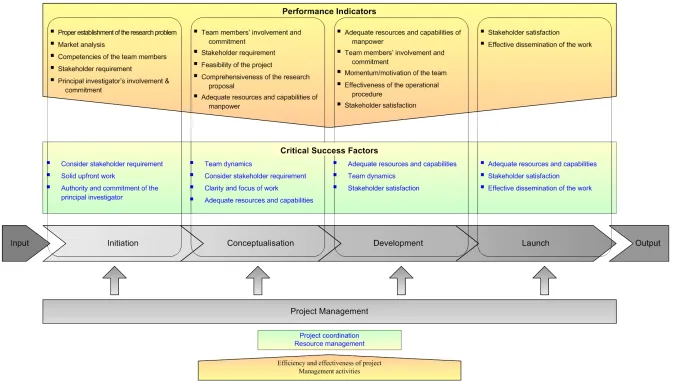
Based on the empirical investigation and literature findings on CSFs, performance indicators and performance measures, the PMS for construction R&D was drafted. The CSFs obtained from the empirical investigation (refer Table 3) were categorised into main groups when developing the PMS (refer Figure 1). The performance measures were structured under the main groups of CSFs (refer Table 5). The draft PMS was refined through a series of semi-structured expert interviews during the explanatory stage of the study. In addition to the refinement of the PMS, the impact it could make towards the success of construction R&D project was assessed through the experience of the respondents.
The refined PMS, and the table representing performance measures are presented in Figure 1 and Table 5.
Insert Figure 1
Insert Table 5
D
D
i
i
s
s
c
c
u
u
s
s
s
s
i
i
o
o
n
n
Strengths of the performance measurement system
The PMS has incorporated multiple performance indicators to identify the factors that influence the performance. Further, it presents a combination of leading (e.g.: resource allocation and utilisation, time commitment of the team members and absence ratio) and lagging indicators (e.g.: achievement of deliverables and milestones). The lagging indicators of the PMS demonstrate the impact or status that the performance has been achieved. Therefore, presence of lagging indicators inform the success of the activities carried out, initiatives taken and modifications made for the R&D project. Conversely, leading indicators demonstrate the performance of the team, processes and direction of resources thus, they help in taking corrective actions before the overall performance is affected. Therefore, having leading indicators within the R&D PMS would help taking initiatives and making modifications to keep the overall R&D project within the expected goals. Accordingly, the use of leading and lagging indicators within the PMS ensures the proper flow of R&D activities.
input measures (e.g.: resource requirement analysis), process measures (e.g.: comparison of allocation of duties and responsibilities with their achievement), output measures (e.g.: achievement of deliverables, milestones) and outcome measures (e.g.: number of subsequent projects acquired) as similar to Brown’s (1996) framework.
Advantageous of the performance measurement system
Through the integration of CSFs, performance indicators and measures in the PMS a typical construction R&D project could achieve the following benefits:
precise understanding of the targets and the work involved within each phase of the R&D project guides the team members in identifying their contributions in terms of achieving the overall goals of the research project. Further, allocation of roles and responsibilities to the correct personnel will ensure the right people are doing the right job thus enhancing the quality of work;
one of the shortcoming of the construction R&D activities was evident as outcome not addressing the requirements of the stakeholders/ beneficiaries (Flanagan and Jewel, 2006; Barrett and Barrett, 2003; Print, 1999; Hodkinson, 1999). The developed PMS incorporates performance indicators and measures relates to satisfaction of the requirements of the stakeholders/beneficiaries thus this will provide benefits such as continuous funding, continuous engagement of work etc.;
carrying out market analysis to establish the research problem clearly will increase the value of the research outcome. Furthermore, feasibility studies will identify any pitfalls the research could encounter, thus helping to determine the best research option from the beginning of the R&D project;
addresses the shortcoming of lack of reporting mechanisms on funds utilisation of construction R&D (Cripps et al, 2004; Seaden and Manseau, 2001; Hodkinson, 1999), unaware of the progress of R&D work (Lorch, 2000).
awareness of the motivation and behavioural issues of the team members and being, receptive to their contribution throughout the project ensures the smooth flow of work;
being realistic about the entire research process and helping to identify alternative approaches if the activities deviate from the original plans;
as identified by Print (1999) and Hodkinson (1999), lack of accountability of the utilisation of resources have negatively impact for funds generation within construction R&D. The presence of performance indicators on resources management of the developed PMS increases the accountability of resource utilisation.
the presence of leading performance indicators to identify lagging areas which need attention before they impair the outcome of the R&D activities.
C
C
o
o
n
n
c
c
l
l
u
u
s
s
i
i
o
o
n
n
developed a PMS to evaluate the performance of construction R&D projects. The comprehensiveness and suitability of the PMS was further evaluated and refined with expert interviews.
The PMS was developed on the basis of implementation of the CSFs via performance measures. Accordingly, the first element of the PMS is the CSFs of construction R&D during its lifecycle. They include at the initiation: consider stakeholder satisfaction, solid upfront work, authority and commitment of the principal investigator; at the conceptualisation, team dynamics, consider stakeholder requirement, clarity and focus of work, adequate resources and capabilities; at the development, adequate resources and capabilities, team dynamics, stakeholder satisfaction; at the launch, adequate resources and capabilities, stakeholder satisfaction, effective dissemination of work and at the project management, project coordination and resource management. The second element of the PMS: performance indicators related to the aforementioned CSFs are also detailed out in the PMS whilst the performance measures (the component parts of performance indicators) are provided in the tabulated format. The PMS also shows the overarching role of project management during the lifecycle of R&D activities and highlights the importance of continuous reviews, feedback and feed-forward for effective monitoring and controlling.
The PMS developed and subsequent research carried out provides research areas that can be further investigated. For this study, the unit of analysis was fixed at the collaborative construction R&D projects, and gathered the data from the stakeholders involved in. However, future studies can be carried out by fixing the unit of analysis on the organisations that carry out R&D work such as universities, construction organisations. Further, this study focused on collaborative construction R&D activities lead by the universities. In contrast, future studies can be carried out for collaborative research work lead by the construction organisations.
R
R
e
e
f
f
e
e
r
r
e
e
n
n
c
c
e
e
s
s
Barrett, P. 2007, Revaluing Construction: a holistic model, Building Research and Information, Vol. 35(3), pp. 268–286
Barrett, S. P., and Barrett, L. C. 2003, Research as a kaleidoscope on practice, Construction management and economics, Vol. 21(7), pp. 755-766
Bremser W. G., and Brasky, N. P. 2004, Utilising the balanced score card, R&D management, Vol. 34(3), pp. 229-238
Brown, M. G. 1996, Keeping score: Using the right metrics to drive world class performance, Quality resources, New York
Brown, M. G., and Svenson, R. A. 1988, Measuring R&D productivity, Research Technology management, Vol. 41(6), pp. 30–35
Coccia, M. 2004, New models for measuring the R&D performance and identifying the productivity of public research institute, R&D management, Vol. 34(3), pp. 267-278 Cooper, R. G. 1998, Product leadership: Creating and launching superior new products, Reading, MA
Cripps, A., Fidler, J., Lorch, R., and McCaffer, R. 2004, A research strategy for the construction industry, Construction research and innovation strategy panel, (accessed 25th December, 2005), available from:
CRISP consultancy commission, 1999, Linking construction research and innovation to research and innovation in other sectors, Construction research and innovation strategy panel (accessed 15th December 2005), available from:
Department for Business, Enterprise & Regulatory Reform, 2007, Draft Strategy for
Sustainable Construction, A consultation paper, (accessed: Feb 2008),
Department of Trade and industry (DTI), 2004, Construction Research Programme Annual Report 2003/4, DTI, (accessed 11th June 2005), available from:
Department of trade and industry, 2005, The R&D scoreboard 2005, DTI, UK Department of trade and industry, 2006, The R&D scoreboard 2006, DTI, UK
Fairclough, J., 2002, Rethinking construction innovation and research: A review of government R and D policies and practices, Department of Trade and Industry, London Flanagan, R., and Jewel, C. 2006, Understanding the construction sector- profitability and profit pools, International conference on building education and research, 10th -13th April, Hong Kong
Fox, P., and Skitmore, M. 2007, Factors facilitating construction industry development,
Building Research and Information, Vol. 35(2), pp. 178–188
Gann, D. M. 2001, Putting academic ideas into practice: technological progress and the absorptive capacity of construction organisations, Construction management and economics, Vol. 19(3), pp. 321-330
Germeraad, P. 2003, Measuring R&D in 2003, Research Technology Management, Vol. 46(6), pp. 47–56
Gilkinson, N., and Barrett, P. 2004, The unanticipated impacts of research on practice, CIB world congress, 2nd – 7th May, Canada
Godener, A., and Soderquist, K. E. 2004, Use and impact of performance measurement results in R&D and NPD: an exploratory study, R&D management, Vol. 34(2), pp. 191- 219 Griffin, A., and Page, A. L. 1993, An interim report on measuring product development success and failure, Journal of product innovation management, Vol. 10(4), pp. 291-308 Guerrera, F., and Waters, R. 2006, R&D spending frenzy may be a waste of money, Financial times, (accessed 10th January 2007), available from:
Hampson, K., and Brandon, P. 2004, Construction 2020: A vision for Australia’s property and construction industry, CRC Construction innovation, Australia
Hill, T., and Lewicki, P. 2007, STATISTICS Methods and Applications, StatSoft, Tulsa,
Hodkinson, R. 1999, Innovative ways of funding construction Research: an ideas paper, Construction research and innovation strategy panel, (accessed 21st June 2005), available
from:
Institute of Civil Engineers, 2006, Infrastructure research priority, (accessed: March 2007), available from:
Kaplan, R. S., and Norton, D. P. 1992, The balanced scorecard- Measures that drive performance, Harvard business review, Vol. 70(1), pp. 71-79
Karlsson, M., Trygg, L., and Elfstrom, B. 2004, Measuring R&D productivity:
complementing the picture by focusing on research activities, Technovation, Vol. 24(3), pp. 179-186
Keller, R. T., and Holland, W. E. 1982, The measurement of performance among research and development professional employees: a longitudinal analysis, IEEE transactions on engineering management, Vol. 29(2), pp. 54-58
Kerssens-van Drongelen, I. C. 1999, Systematic design of R&D performance measurement systems, The University of Twene, Netherlands
Kerssens-van Drongelen, I. C., and Bilderbeek, J. 1999, R&D performance measurement: more than choosing a set of metrics, R&D Management, Vol. 29(1), pp. 35–46
Kerssens-van Drongelen, I. C., and Cook, A. 1997, Design principles for the development of measuring systems for research and development process, R&D management, Vol. 27(4), pp. 345-357
Kulatunga, U, Amaratunga, D, and Haigh, R 2007, Performance measurement in construction research and development, International Journal of Productivity & Performance
Management, Vol. 56(8), pp. 673 – 688
Laing, M. 2001, Yesterday, today and tomorrow - lessons from the past we can take forward into the future, Reading construction forum, Oxford
Lester, D. H. 1998, Critical success factors for new product development, Research Technology Management, Vol. 41(1), pp. 16-21
Lim, J. N., and Ofori, G. 2007, Classification of innovation for strategic decision making in construction businesses, Construction Management and Economics, Vol. 25(9), pp. 963 - 978 Loch, C. H., and Tapper, U. A. S. 2002, Implementing a strategy driven performance
measurement system for an applied research group, The journal of product innovation management, Vol. 19(3), pp. 185-198
Lorch, R. 2000, Improving the communication of academic research to the construction industry, Construction research and innovation strategy panel, (accessed 20th February 2006),
available online fro
Moser, M. R. 1985, Measuring performance in R&D settings, Research Technology Management, Vol. 28(5), pp. 31-33
Osawa, Y., and Yamasaki, Y. 2005, Proposal of industrial research and development performance indices, R&D management, Vol. 35(4), pp. 455-461
Pallant, J. 2001, SPSS survival manual: A step by step guide to data analysis using SPSS for windows (Version 10-11), Open University Press, Buckingham
Parker, C. 2000, Performance Measurement, Work study, Vol. 49(2), pp. 63-66
Pearson, A. W., Nixon, W. A., and Kerssens-van Drongelen, I. C. 2000, R& D as a business – what are the implications for performance measurement?, R&D Management, Vol. 30(4), pp. 355–366
Print, M, 1999, Funding Construction Industry Research and Innovation - time for a change?, (accessed 15th June 2005), Constructions research and innovation strategy panel,
UK, available for
Robert, S. 1994, Measuring R&D effectiveness I, Research technology management, Vol. 37(2), pp. 15-23
Roussel, P. A., Saad, K. N., and Erickson, T. J., 1991, Third Generation R&D: Managing the Link to Corporate Strategy, Harvard Business School Press, Boston, MA
Seaden, G., and Manseau, A. 2001, Public policy and construction innovation, Building research and information, Vol. 29(3), pp. 182-196
Smith, P. G., and Reinertsen, D. G. 1998, Developing products in half the time: new rules, new tools, VanNostrand Reinhold, New York
Thakkar, J., Deshmukh, S.G., Gupta, A.D., and Shankar, R. 2007, Development of a balanced scorecard: an integrated approach of interpretative structural modelling (ISM) and analytic network (ANP), International Journal of Productivity and Performance Management, Vol. 56(1), pp. 25-59
Tipping, J.W., Zeffren, E., and Fusfeld, A.R. 1995, Assessing the value of your technology,
Research Technology Management, Vol. 38(5), pp. 22–39
Weggeman, M. P., and Groeneveld, M. J. 2005, Applying the business excellence model to a research organisation, Research technology management, Vol. 48(4), pp. 9-13
Werner, B. M., and Souder, W. E. 1997, Measuring R& D performance: state of the art,
Table 1: Details of the respondents
Category Description
E xp lor at or y st age E xp lan at or y st age Semi-structured interviews
Questionnaire survey Semi-structured interviews No. of interviews No. of questionn aires sent Response rate Principal Investigators
Principal investigators represent the university and manage and lead the R&D project
5 55 62% 4
Researchers Researchers represent the
University and carries out the research work related to the project (e.g.: data collection, analysis etc.)
5 2
Industrial Partners
Industrial partners are the representatives from
construction organisations who contributes to the R&D project
5 34 35%
Table 2: Values assigned for the Likert scale
Scale Unimportant Of the little
important
Moderately important
Important Very
important No opinion/ N/A
[image:26.595.64.482.478.568.2]Table 3: Critical success factors of construction R&D
Success Factors
A
ca
d
em
ia
Indus
tr
y
Pa
rt
ne
rs Total
A
sym
p
. S
ig.
Mean Mean Mean Rank
Initiation
Establish the research problem clearly 4.74 4.85 4.79 1 N/A
Commitment of the principal investigator 4.59 4.52 4.56 2 0.06
Selecting a competent team 4.50 4.44 4.48 3 0.51
Leadership of the principal investigator 4.35 4.19 4.28 4 0.08
Consider industrial partners’ requirements 4.03 4.56 4.27 5 0.99
Consider funding bodies’ requirements 4.29 4.22 4.26 6 0.87
Understand the market and its dynamics 4.21 4.04 4.13 7 0.45
Consider researchers’ requirements 3.85 3.70 3.79 8
Conceptualising
Check the feasibility of the project 4.68 4.85 4.75 1 N/A
Commitment of the principal investigator 4.62 4.52 4.57 2 0.07
Committed and cooperative team members 4.48 4.59 4.53 3 0.55
Establish clear and realistic goals/ deliverables/ milestones 4.41 4.63 4.51 4 0.99
Adequate resources/financial support 4.44 4.44 4.44 5 0.52
Allocation of responsibilities to team members inline with competencies 4.41 4.37 4.39 6 0.61
Leadership of the principal investigator 4.26 4.37 4.31 8 0.58
Having a skilled team 4.38 4.19 4.30 9 0.76
Establish clear method to measure success 4.18 4.44 4.30 10 1.00
Consider industrial partners’ requirements 4.35 4.22 4.30 11 0.95
Consider funding bodies’ requirement 4.35 4.19 4.28 12 0.97
Absence of lengthy bureaucracy 3.91 4.11 4.00 13 0.03
Early involvement of industrial partners 3.76 4.30 4.00 14
Comprehensive briefing process 3.88 4.11 3.98 15
Recognition for team members 3.88 3.96 3.92 16
Consider researchers’ requirements 3.91 3.74 3.84 17
Fast decision making process 3.59 3.88 3.72 18
Development
Committed and cooperative team members 4.62 4.56 4.59 1 N/A
Commitment of the principal investigator 4.56 4.59 4.57 2 0.83
Adequate resources/financial support 4.53 4.59 4.56 3 0.91
Having a skilled team 4.53 4.48 4.51 4 0.55
Meet funding bodies’ requirements 4.53 4.48 4.51 5 0.99
Share a common understanding about the work 4.38 4.44 4.41 6 0.29
Having a well establish operational procedure 4.50 4.26 4.39 7 0.91
Meet industrial partners’ requirements 4.24 4.59 4.39 8 0.98
Secure momentum/ motivation of the team 4.41 4.33 4.38 9 0.91
Flexibility and responsiveness to change 4.38 4.37 4.38 10 1.00
Absence of lengthy bureaucracy 4.03 4.22 4.11 12 0.02
Meet researchers’ requirements 4.09 4.07 4.08 13
Recognition for team members 4.00 4.04 4.02 14
Fast decision making process 3.82 4.11 3.95 15
Having a risk mitigation strategy 3.85 4.08 3.95 16
Testing the market 3.79 4.07 3.92 17
Launch
Effective dissemination of the results 4.56 4.48 4.52 1 N/A
Meet funding bodies’ requirements 4.65 4.30 4.49 2 0.73
Having a well established dissemination/ marketing plan 4.47 4.48 4.48 3 0.88
Meet industrial partners’ requirements 4.21 4.63 4.40 4 0.46
Launch the output within the planned time frame 4.35 4.37 4.36 5 0.93
Comprehensive project review and feedback 3.91 4.22 4.05 6 0.03
Meet researchers’ requirements 3.74 4.07 3.89 7
Refinement of the output after launch 3.94 3.70 3.84 8
Project Management
Effective communication 4.68 4.74 4.70 1 N/A
Effective collaboration 4.62 4.63 4.62 2 0.28
Effective planning, controlling, and organising of activities 4.41 4.67 4.52 3 0.29
Continuous reviews 4.35 4.63 4.48 4 0.53
Effective resource management 4.26 4.44 4.34 5 0.19
Having an external person to do reviews 3.97 4.00 3.98 7
Evaluating post delivery success 3.82 4.11 3.95 8
[image:30.842.71.769.190.508.2]Having a separate project administrator 3.41 3.44 3.43 9
Table 4: Use of performance measures by the respondents
Indus tr y % N=2 6 Ra n k A cad em ia % N= 3 4 Ra n k O ve ral l % N= 6 0 Ra n k Performance measures
Measures on the project finance (requirement, allocation and utilisation)
84.00 1 96.77 1 91.07 1 Analysis of project budget; delays due to lack
of finance
Measures on the project time 84.00 1 90.32 2 87.50 2 Achievement of milestones, deliverables;
time deviations from the expected
Measures on the accomplishment of the project objectives
80.00 3 83.87 3 82.14 3 Achievement of milestones, deliverables
Measures to identify the stakeholder requirements/ expectations from the project
80.00 3 74.19 6 76.79 4 Stakeholder requirement analysis
Measures on the accomplishment of the milestones
72.00 5 80.65 4 76.79 4 Achievement of milestones, deliverables
Measures on the project quality 68.00 7 77.42 5 73.21 6 Achievement of deliverables to the required
standards
Measures on the stakeholder involvement and commitment
64.00 9 70.97 7 67.86 7 Time commitment of stakeholders; project
Indus tr y % N=2 6 Ra n k A cad em ia % N= 3 4 Ra n k O ve ral l % N= 6 0 Ra n k Performance measures
Measures on the feasibility of the project 52.00 12 70.97 7 62.50 8 Measures on cost and benefits analysis;
achievement of project goals against the potential risks
Measures on the project team performance 68.00 7 58.06 9 62.50 8 Number of publications made by the team
members; number of awards won; presentation at workshops/ conferences
Measures on identifying the satisfaction of the stakeholders
72.00 5 54.84 11 62.50 8 Achievement of milestones, deliverables;
scores on the stakeholder satisfaction surveys
Measures to identify the market needs 64.00 9 58.06 9 60.71 11 Market analysis
Measures on the other resources (human, equipment etc)
64.00 9 48.39 12 55.36 12 Resource requirement and utilisation
analysis; delays of work due to lack of resources
Measures on the post delivery success 44.00 13 48.39 12 46.43 13 Response from the industry on the utilisation
of the research results
Measures to identify the researchers’ requirements/ expectations from the project
- 45.16 15 45.16 14 Researchers’ requirement analysis
Measures on the education and training of researchers
- 41.94 17 41.94 15 Qualifications and experience of the
researchers; training activities provided
Measures on the comprehensiveness of the research proposal
32.00 14 45.16 15 39.29 16 A research justification plan
Measures on the development of new research directions
Indus tr y % N=2 6 Ra n k A cad em ia % N= 3 4 Ra n k O ve ral l % N= 6 0 Ra n k Performance measures
Measures on the learning and growth of the stakeholders and researchers (knowledge gains/ knowledge creation, transfer and exploitation)
32.00 14 38.71 18 35.71 18 Completion of postgraduate degrees (PhDs);
Number of publications by the team members; presentations at conferences
Measures on identifying the satisfaction of the researchers
- 35.48 19 35.48 19 Time commitment of researchers; project
meeting attendance; absence ratio
Measures on the retention of the stakeholders 28.00 16 16.13 20 21.43 20 Follow on funding; continuous engagement/
partnership of stakeholders
Measures on the acquisition of new business relationships
28.00 16 16.13 20 21.43 20 Number of subsequent projects acquired and
Table 5: Performance indicators and measures of construction R&D
Critical success factors Performance measures (component parts
of performance indicator)
Initiation Phase
Solid upfront work
Understand the market and its dynamics
Establish the research problem clearly
Existence of market analysis
Existence of a research justification plan; completeness of the research proposal in terms of knowledge gap and importance of the research problem
Select a competent team Existence of a skills evaluations; existence
of recruitment plan; comparison of skills needed with the qualifications of the potential researchers, industrial partners
Consider stakeholder requirement
Consider funding bodies’ requirements
Consider industrial partners’ requirements
Existence of a requirement analysis of the stakeholders
Authority and commitment of the principal investigator
Commitment of the principal investigator
Leadership of the principal investigator
Time commitment of the principal investigator
Conceptualising Phase
Team dynamics:
Authority and commitment of the principal investigator
Commitment of the principal investigator
Leadership of the principal investigator
Time commitment of the principal investigator
Committed and cooperative team members Existence of performance evaluation methods of team members; comparison of allocation of duties and responsibilities against their achievement; project meeting attendance; time commitment of the team members; absence ratio
Consider stakeholder requirement
Consider funding bodies’ requirement
Consider industrial partners’ requirements
Existence of a requirement analysis of the stakeholders
Clarity and focus of work
Check the feasibility of the project Existence of a feasibility analysis; measures
on cost, benefits analysis, achievement of project goals against the potential risks
Establish clear and realistic goals/ deliverables/ milestones
Comparing project expectation with available resources
Establish clear method to measure success Existence of a procedure to establish project evaluation methods (e.g.: identification of time targets to evaluate
performance/reporting, reporting mechanisms and reporting structure of project performance, identifications of people responsible to do the
evaluations/reporting; timing of reporting)
Allocation of responsibilities to team members inline with competencies
Comparing the responsibilities with the competencies of the team members
Establish a plan to disseminate research results
Existence of a procedure to develop a project dissemination plan (e.g.:
identification of the mode of dissemination of work, the target group/ beneficiaries, allocation of sufficient funds and personnel for launch events/ dissemination, identifying the timeframe for launch events/
dissemination)
Having a skilled team Number of publications and citations of the team members, generation of new ideas and findings, number of awards won,
presentation at workshops/ conferences; number of training activities provided; evaluation of the skill level of the team members (e.g.: educational qualifications, experience)
Adequate resources/financial support Existence of resource requirement analysis
Development Phase
Adequate resources and capabilities
Having a skilled team Number of publications and citations of the
team members, generation of new ideas and findings, number of awards won,
presentation at workshops/ conferences; number of training activities provided; evaluation of the skill level of the team members (e.g.: educational qualifications, experience)
Adequate resources and financial support Existence of resource requirement analysis
Having a well established operational procedure
Existence of a method to evaluate the operational procedure of the project (e.g.: identification of alternative approaches at cost, time, budget deviations)
Motivation and behaviour of the team members
Committed and cooperative team members Existence of performance evaluations of
team members; comparison of allocation of duties and responsibilities against their achievement; project meeting attendance; time commitment of the team members; absence ratio
Secure momentum/ motivation of the team Employee turnover
Share a common understanding about the work
Frequency of project meetings and comprehensiveness of the project briefing
Authority and commitment of the principal investigator
Commitment of the principal investigator
Leadership of the principal investigator
Time commitment of the principal investigator
Stakeholder satisfaction
Meet industrial partners’ requirements
Meet funding bodies’ requirements
Existence of stakeholder satisfaction analysis; achievement of milestones, deliverables; scores on the stakeholder satisfaction surveys; number of subsequent projects acquired and new opportunities derived from the project; follow on funding or spin off effects; number of new
stakeholders/contacts acquired; % of time, cost, quality deviation from planned
Launch Phase
Adequate resources and capabilities
Having a well established dissemination/ marketing plan
Existence of a dissemination of plan (e.g.: identification of project results and output reaching the target audience, beneficiaries; dissemination of the outcome within the planned time frame, obtaining feedback from the stakeholders)
Stakeholder satisfaction
Meet funding bodies’ requirements
Meet industrial partners' requirements
Existence of stakeholder satisfaction analysis; achievement of milestones, deliverables; scores on the stakeholder satisfaction surveys; number of subsequent projects acquired and new opportunities derived from the project; follow on funding or spin off effects; number of new
stakeholders/contacts acquired; % of time, cost, quality deviation from planned
Dissemination of work
Launch the output within the planned time frame
% deviation from proposed timeframe
Effective dissemination of the results Response rate from the industry on the
utilisation of research results
Project Management
Continuous reviews
Effective collaboration
Effective communication
Effective planning, controlling, and organising of activities
Frequency of project reviews/ meetings; number of cancellation of meetings; existence of communication and
coordination plans (e.g. : identification of communication mode, ); efficiency of communication, coordination; effectiveness of the communication of project deviations, achievement of milestones, deliverables to team members; effectiveness of the feedback (e.g. : getting the feedback from the required personnel, integrating the feedback within the system, taking correct actions based on the feedback received); evaluation of the project management procedure (e.g. : identification of
communication channels, structure_ who should communicate with whom)
Resource management
Effective resource management
Effective management of the people