2018 International Conference on Physics, Computing and Mathematical Modeling (PCMM 2018) ISBN: 978-1-60595-549-0
The Establishment of Decision Model Based on Fuzzy Regression and
the Application of Chemical Solid Adsorption Quantity
Hao KANG, You-yi CHEN and Ting AI
Armored Forces Engineering institute of Army, No.1, Huayuan Road, Changchun, 130117, China
*Corresponding author
Keywords: Least square method, Air molecules, Liquid molecules, Solid adsorption quantity.
Abstract. This text puts forward a regression analysis method based on fuzzy expectation and fuzzy
variance as theory foundation and builds up a fuzzy decision model. At the same time, using the model to calculate the chemical solid adsorption quantity, it would raise the rationality and accuracy of calculation result.
Fuzzy Expectation and Fuzzy Variance
Mathematical Expectation and Variance of Random Variable
Mathematical expectation is an important characteristic of random variable, its definition comes from common average concept, embodied to random variable’s the size of taking the value on the average. Suppose the x is a discrete random variable, its value maybe x1,x2,..., its probability distribution is P x{ xk}pk , k=1,2, ..., so called
k k k
x p
as mathematics expectation of random variable x, namely:
k k kp
x x E( )
(1) The variance is another important numeral characteristic of random variable. For the Anterior random variable, if E(X E(X))2 exists, then we call this expectation as the variance of x , record
for D(x)orx2, can also be represented as:
k k k
p X E x x
D( ) ( ( ))2
(2)
Fuzzy Expectation
Mathematical expectation described the important characteristic of random variable, it can be used to estimate the value of random variable. But, among the actual application, it is almost impossible to can obtain to accurate probability value because of the discontinuity and finite of data sample points. So it became to a mathematical model of ideal. Because we don't know the probability value, assume that all the probability value of random variable is equal, so formula (1) became:
k k
x n x E( ) 1
(3) Formula (2) became:
k
k EX
x n x
D( ) 1 ( ( ))2
k k k k k
u x u x
EF( )
(5)
at (5), uk is a membership function of the fuzzy set, which corresponds to value of random
variable. uk is open domain in the fuzzy set, namely uk (0,1). But, among the actual application,
its value can take 0 or 1, became:
) ( 1
) (
F x E x
n x E
k k
(6) Accordingly, when membership value takes 1, fuzzy expectation also becomes average of random variable, which became mathematics expectation of equal probability events.
Fuzzy Variance
Define fuzzy variance based on fuzzy expectation [1,2]:
k k k
k k
u x FE x u x D
2
F
)) ( ( ) (
(7)
At the same, when uk =1, EF(x) E(x), the formula before became:
) ( )) ( (
1
)) ( (
1 ) (
2
2 F
x D x
E x n
x FE x n x D
k k
k k
(8) So, fuzzy variance became a variance of equal probability events.
The Establishment of Fuzzy Regression Model
Regression Analysis
The relation can be divided into two types: namely, function relation and related relation [3]. The function relation refers to the deterministic dependency exists between the variables. When a variable takes a value, accordingly, another variable must have a definite value corresponding with it. The related relation refers to an uncertain relationship between variables .When a variable takes a value, accordingly another variable has a lot of values corresponding with it. All the majority of phenomena performance is expressed for related relation in the realistic world [3]. After passing a great deal of observation, the related relation can be abstract to function relation, then describe their fluctuation relations with the model, Which can help us to make analysis and decision. This is the basic idea of regression analysis.
Regression analysis is a commonly used statistical analysis model. It can conjecture a value of certain random through a variable or a set of variables. This method can help us to make analysis and judgment to the future thing and get more reasonable decision result. This method applies widely in the actual problem.
Fuzzy Regression Analysis
model. We call it fuzzy regression analysis. Fuzzy regression analysis can make the bad information to minimize the interference, improving the accuracy of results.
Establishment of Fuzzy Regression Model
The establishment of model based on typical regression model. Specific process is as follows:
Make Sure Independent Variable and Dependent Variable. If a variable y has linear
correlation with others k variables x1,x2,,xk, so, the regression model between them can be
expressed as :
k kx b x b x b b
yˆ 0 1 1 2 2 (9)
Among them, b0,b1,b2,,bk are k 1 regression parameters that treat to settle. If we would
make sure these parameters through physically prognosticate values, then the regression model can
also be made sure, then we can predict the y through x1,x2,…xk. In order to distinguish
between, the yˆ means an predictive value, the y means observed value. Here, x1,x2,…,xk are called independent variable, y is called dependent variable[4].
Certain Fuzzy Set and Membership Function. The standards that certain regression parameter
is attaining minimum of quadratic sum of the gap between y and yˆ. The method of use is least square method. That is:
n i i i y y 1 2 min ) ˆ ( (10) Being regression coefficients, the regression model builds up first step. For existing any set of
prognosticate values xi1,xi2,,xik, there will be yi and yˆi correspondent. We defined fuzzy set based on this. Its discourse domain is all the data points. The fuzzy concept described by it is deviate degree of all the data points and fitting equation. Specific definition is as follows:
2 ) ˆ ( 1 ) ( i i y y e i
u
n
i1,2,... (11)
Certain Regression Coefficient by Least Square Method. Adding fuzzy domain for least
square method, weakens discrete point data’s influence to fitting result, at the same time, strengthening concentrated point data’s influence to fitting result. At this time, we call it fuzzy least square method. Represented as:
min ) ˆ ( 1 2 n i i i
i y y
u
(12)
When ui takes 1, formula (12) became least square method. We get an equation set for solving coefficient: ky k kk k k y k k y k k s b s b s b s s b s b s b s s b s b s b s 2 2 1 1 2 2 2 22 1 21 1 1 2 12 1 11 (13) Among them: k j i uy ux y ux u s ux ux x ux u s i i iy j i j i ij , , 2 , 1 , (14)
u ux b u
ux b u ux b u uy
b0 1 1 2 2 k k
(15) To this, we have completed the fuzzy regression for the first time, namely the first-time iteration. Return to the second step, we certain fuzzy set and membership function again based on new coefficient, and immediately carry on the third step, we can complete the second-time iteration again. After a few times, the amount class of regression coefficient has already very differs minuteness. We use this as the final regression model.
Use the Model to Calculate the Chemical Solid Adsorption Quantity
The Chemical Solid Adsorption Phenomenon
We know, the solid surface exists to adsorb phenomenon in the chemical. It means when gas molecules or liquid molecules move to solid surface, because of air molecules or liquid molecules and solid surface’s interaction, these molecules would stay around solid superficial. So, the density of solid surface would continuously enlarge. The phenomenon that solid surface can adsorb to the air and the liquid has already been discovered by people very early. In the middle of producing and practicing, whether in the past or now, this kind of phenomenon has very important meaning to our daily life, especially in the agriculture and industry and science technique[5].
The Application of Fuzzy Regression Model
We can use fuzzy regression model to calculate solid adsorption quantity, it would be obtain good effect.
In the actual application, we can use the method of the statistics to build up this model, which is more commonly used. Its advantage lies that the sbhuyang of an equation set that we get has explicit physical meaning and we can more profoundly understand adsorb status. We think that adsorbed gas can flow on the surface of solid, and the surface of adsorbing is uniform. In this kind of adsorb model, on the surface of the solid adsorption quantity is proportional to the gas pressure balance. Among the solid space, if the temperature heats up and adsorb quantity become bigger, on the contrary, if the temperature lowers and adsorb quantity become smaller. We found by experiment, under the indoor temperature and under the atmospheric pressure of 101kpa, adsorption quantity of a lot of material is linear relation or approaching linear. In this case, we can describe it with the regression model and predict to adsorption quantity through some certain sample data points. Using fuzzy regression model can make the bad data points to minimize the impact of the results and make the results more close to reality.
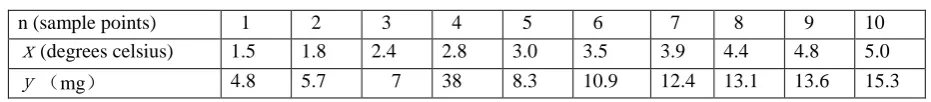
[image:4.595.64.530.560.611.2]As follows for experiment data, it means a kind of the quality that the material adsorbs another material under different temperature. We get ten sample points as shown in table 1:
Table 1. Sample points.
n (sample points) 1 2 3 4 5 6 7 8 9 10
x(degrees celsius) 1.5 1.8 2.4 2.8 3.0 3.5 3.9 4.4 4.8 5.0
y(mg) 4.8 5.7 7 38 8.3 10.9 12.4 13.1 13.6 15.3
Above, x is independent variable, y is dependent variable. We confirm regress coefficient by these observed values and build up regression model. At the same time, typical regression is called zero regressions. Observing the data first, we found that the fourth sample point is abnormal, it is bad data. We observed the result of each time through computation of the model.
result of the zeroth regression: yˆ=.83489+1.8054x result of the first fuzzy regression: yˆ=1.38081+2.77573x result of the second fuzzy regression: yˆ=0.337542+2.96655
x
result of the third fuzzy regression: yˆ=0.244437+2.9664x
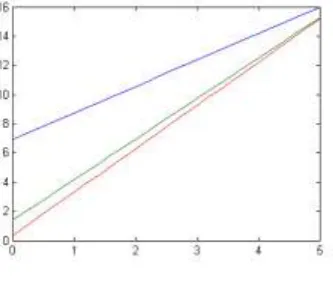
calculation and the fourth calculation. We use this as the end of regression model. Drawing the first three times regression line to the same rectangular coordinate system (Figure 1), from up to bottom is the zeroth regression, the first fuzzy regression and the second fuzzy regression. If we continue to draw, present regression line and last time regression line almost is heavy match. We know passing the diagram below, our regression line incline to a stability gradually through a few fuzzy regression computation. After it is steady to settle down, we can select it as the end result.
Figure 1. Regression lines.
Pass this example, we can discover that the decision is a very complicated and trivial process. This process would be subjected by conditional influence or many or little. But, the condition has an irresistible factor. Therefore, each decision has certain risk.
Conclusion
In recent years, the knowledge of fuzzy mathematics apply to decision and analysis, making the fuzzy sets participate in decision making, establishing corresponding fuzzy decision model, it would make computer decision support level improved, and gradually formed a complete and comprehensive system fuzzy decision theory system. The fuzzy regression model can help us to consciously calculate the chemical solid adsorption quantity through existing information, it makes human factors lead to the uncertainty of the minimum and enhances the decision-making accuracy and credibility of the calculation results.
References
[1]T. Bag, S.K. Samanta. Fix point theorems on fuzzy normed linear space[J]. Information Sciences, 2014, 176:2910-2931.
[2]T. Bag, S.K. Samanta. Some fixed point theorems in fuzzy nomed linear space[J]. Information Sciences, 2010, 177:3271-3289.
[3]Wang Songgui. An introduction to linear model [M]. Science publisher, 2014, 79-85.
[4]Wei Bocheng. Parametric statistics tutorial [M]. Higher education publisher, 2016, 276-283.