Optimize Process Parameter in Resistance Spot Welding for Unequal
Thickness Sheet using Taguchi Method & Grey Relational Analysis
Mr.Bhushan Subhashrao Deshmukh
1Prof. Poonam S. Talmale
21
PG Scholar
2Assistant Professor
1,2
Department of Mechanical Engineering
1,2
K.C.T’s Late G. N. Sapkal COE, Nashik, India
Abstract— The optimization of parameters considering multiple performance characteristics to minimize power consumption in Resistance spot welding (RSW) process for GI sheet using the Grey relational analysis (GRA) is presented. Performance characteristics including Cu rrent, Weld time, Electrode force and Thickness are chosen to evaluate the machining effects. This all the process parameters are closely correlated with the selected performance characteristics in this study are the hold time, squeeze time, and electrode tip diameter. Experiments based on the appropriate L27 OA are conducted first. The coefficient and grades according to GRA are evaluated using normalized experimental results of the performance characteristics. The Analyses Of Variance (ANOVA) are conducted to identify the most significant factor affecting the spot welding performance. Process parameters after optimization are simultaneously leading to maximum tensile-strength and minimum Nugget diameter will be then verified by confirmation experiment.
Key words: Resistance Spot Welding (RSW), Optimization, Grey Relational Analysis (GRA), Analysis of Variance (ANOVA)
I. INT RODUCT ION
in the car body, Body-in-White (BIW) is pointed out as one of the most important parts of a transport vehicle, it impacts on performance such that speed, fuel consumption, safety and handling of vehicle. A typical BIW described approximately 300 sheet metal parts which is joined by around 4000-6000 weld spots. BIWs are pre-assembled into under-body, body side’s panels and body closures are separated before assemble into a complete BIW.
In welding area Spot welding is an advance technique to join two or more parts in the producing a vehicle Spot welding is used in an automotive industry[1]. The main use of using resistance spot welding process is the machine is applicable to robot arm so that, process will be done at earlier than other welding process. In this two or three sheets overlapped are welded together because of the heat created due to electrical resistance. Spot welding may be performed by worker, using electronic robot or using welding machine which takes only seconds[1].
Spot welds are discrete weld locations on the assembled components which look like small round. They are not linear welds. Low volumes of components are usually done by manually and mass volumes can be done the best by using robots. There are number of variables involved in resistance spot welding such as current, pressure, time, human element, type of condition of welder. Some of the weld parameters are difficult to control and may cause weld quality. Some of them are easy to control such as the current, time and electrode pressure. Achieving
good weld quality necessity to start with good process parameter design that minimizes the variables during welding.
1010 steel using the Taguchi method investigated that increasing welding current and electrode force are most influencing factors controlling the weld strength. He conclude that Taguchi method can be effectively u sed for optimization of spot welding parameters.A.S. Panchakshari et.al (2013) has studied the Non-Linear method like Genetic Algorithm to optimize the machining parameters of Resistance Spot Welding that is cycle time (Weld, Hold, and Squeeze) and current which are responsible for Nugget Diameter & Strength of weld. Low carbon cold rolled EDD grade material has been consider for response [3]. Corresponding mathematical model based on factorial regression & ANOVA developed which expresses generalized relation between responses and variable input process parameters. Aravinthan Arumugam et.al (2015) have studied the use of Grey Based Taguchi Method to optimize the welding schedule for welding steels with dissimilar thicknesses and types using Taguchi L9 orthogonal array optimization technique.S. Aslanlar et.al (2012) has studied the effects of drilling parameters on surface roughness and roundness error in drilling of AI6061 alloy with HSS twist drills. In addition, optimal control factors for the hole quality were determined by using Taguchi - Gray relational analysis. feed rate, Cutting speed, drill diameter, point angle and cutting fluid mixture ratio were considered as control factors, and L18 orthogonal array was determined for experimental trials. Gray relational analysis was used to minimize the surface roughness and roundness error achieved via experimental design.
II. GREY RELAT IONAL ANALYSIS
A. Data Preprocessing
In Grey relational analysis, data pre-processing is required as the range and unit in one data sequence may different from the others. The experimental results are limited in range between zero to one. There are various methods of data pre-processing available. The procedure is given below. Identify the performance characteristics and process
parameters to be evaluated.
Determine the number of levels for the process parameters.
Select the appropriate OA and assign the process parameters to the OA.
Experiments based on the arrangement of the OA. Normalize results of MRR, TWR and OC.
Perform the GR generating and calculate the grey relational coefficient.
Results using the GR grade and ANOVA. Optimal levels of process parameters.
Optimize process parameters through the confirmation tests.
Data process converts the original sequence to a comparable sequence. Several methods of preprocessing data can be used in Grey relation analysis If the target value of the original sequence is “the-larger-the-better”, then the original sequence is normalized as follows[7]
)
) ) )
) ) (1)
If the purpose is “the-smaller-the-better”, then the original sequence is normalized as follows
) ) ) )
) ) (2) However, if there is “a specific target value”, then the original sequence is normalized using,
) |
) ) |
{ ) )} (3) Where, OB is the target value.
Alternatively, the original sequence can be normalized using the simplest methodology that is the values of the original sequence can be divided by the first value of the sequence,
)
) ) )
) ) (4)
Where, ) ) is the original sequence, )the sequence after the data preprocessing, max. ) )the largest value of ) ), min . ) ): the smallest value of ) )
B. Grey Relational Coefficients & Grey Relational Grades
Following the data preprocessing, a Grey relational coefficient can be calculated using the preprocessed sequences. The Grey relational coefficient is defined as follows.
( ) ))
) (5)
) ))
Where, ) is the deviation sequence of reference sequence ) and comparability sequence (k),
namely,
) | ) )|,
| ) )|,
| ) )|,
A Grey relational grade is a weighted sum of the Grey relational coefficients, and is defined as fallows.
) ∑
) ))
∑
III. EXPERIMENT AL PROCEDURES & T EST RESULT S
A. Materials
The materials used in experiment were commercially available galvanized CRC D2 steel sheet, widely used in car fabrication. Its composition is C-0.065%, Si-0.095, Cr-0.017,
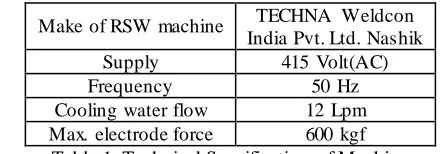
Make of RSW machine TECHNA Weldcon
India Pvt. Ltd. Nashik
Supply 415 Volt(AC)
Frequency 50 Hz
Cooling water flow 12 Lpm
Max. electrode force 600 kgf Table 1: Technical Specification of Machine Ni-0.032, Cu-0.053, Mn-0.404, S-0.017, P-0.018 and Fe-balance. The thickness of it is 1.2 mm and galvanized layer is 8 µ. Specimens were prepared by the hydraulic cutting process[9]. The sizes of tests specimen are 100*30*0.8.
Level of Experimental
Experimental control Factors
Current (A)
Weld time
(B)
Electrode Force (C)
Thickness (D)
1 8 9 210 1.2
2 8.5 9.5 300 1.5
3 9 10 400 2
Table 2: Experimental Factors & Factor Levels
B. Method
A current and timer controlled electrical resistance spot welding machine was used in experimental works. It has 120 kVA capacity and pneumatic application mechanism. Part were welded by electrical resistance spot welding by changing electrode force, welding current, cycle time and fixing electrode diameter having 15 mm sphere, cooling water flow rate during experiments[12].
1) Spot welding parameters and heat generation
The three main parameters in spot welding are current, contact resistance and weld time. In order to produce good quality weld the above parameters must be controlled properly. The amount of heat generated in this process is governed by the formula,
(6)
Where, Q= heat generated, Joules I= current, Amperes
R= resistance of the work piece, Ohms T= time of current flow, second
C. Experimental Parameters & Design
The effects of process parameters on the response of resistance spot welding[10] have been studied by Ugur Esme (2009), A.G Thakuret. al. (2010), Pouranvari(2009), Nachimani Charde(2010) and so on. In this study, further optimum process parameter for the unequal thickness sheet is investigated. Furthermore,the experimentis conducted withfour controllable 3-level factors and two response variables. Twenty seven experimental runs based on the orthogonal array L27 are required. Table 1 presents four controlled factors of the current (i.e., C(KA)), the weld time (i.e., WT(cycle)), the electrode force (i.e., F (KN)), and the
Table 4 shows the Twenty seven experimental runs according to the selected orthogonal table. After spot welding, two quality objectives of the workpieces are chosen, including the tensile strength (i.e., TS (KN)) and nugget diameter (i.e., (mm)). Typically, maximum values of the tensile strength and minimum for nugget diameter are desirable for the resistance spot welding.
Fig. 1: Samples after Tensile Testing
D. Measuring Apparatus
The tensile strength of the spot welded sheet were measured by a Ultimate testing machine (UTM) and nugget diameter were measured by microscopic scale.
1 Manufacturers Vertex Engineers Airoli New Mumbai
2 Capacity Upto 20 Ton
3 Test Speed 500 mm/min.
4 Dimensions of UTM
4.1 Width Preferably in the range of
1000-1200 mm
4.2 Depth Preferably in the range of
500-600 mm
4.3 Height Preferably in the range of
1600-2000 mm
5
Mechanical test to be carried on
UTM
Tensile Test, Compressive Test, Adhesion Test,Ductility Test, Fatigue/Cyclic Test, Bending,
Shear/ Torsion Test Table 3: Technical Specification of Machine
IV. RESULT S & DISCUSSION
A. Test Performance
The experimentally obtained values of Tensile strength(TS), and Nugget diameter(ND) are also presented in Table 4 In this section, the use of the OA with the GRA for determining the optimal process parameters is reported step by step. The optimal process parameters with consideration of the multiple performance characteristics are obtained and verified.
Ex. No Levels of parameters TS (KN) ND(mm)
A B C D
1 8 9 210 1.2 5375 5
2 8 9 300 1.5 5375 5.2
3 8 9 400 2 5250 5.9
4 8 9.5 210 1.5 5750 5.75
5 8 9.5 300 2 5375 5.3
6 8 9.5 400 1.2 5750 5.7
[image:3.596.52.272.145.222.2] [image:3.596.316.542.151.271.2]8 8 10 300 1.2 5500 6.5
9 8 10 400 1.5 5375 5.6
10 8.5 9 210 1.2 5625 5.9
11 8.5 9 300 1.5 6000 6.1
12 8.5 9 400 2 5500 6.5
13 8.5 9.5 210 1.5 5750 5.85
14 8.5 9.5 300 2 5875 6.1
15 8.5 9.5 400 1.2 5755 6.3
16 8.5 10 210 2 5875 6.25
17 8.5 10 300 1.2 6000 5.95
18 8.5 10 400 1.5 5750 6
19 9 9 210 1.2 6000 6.1
20 9 9 300 1.5 5800 6.6
21 9 9 400 2 5750 5.75
22 9 9.5 210 1.5 6250 6.5
23 9 9.5 300 2 5875 5.75
24 9 9.5 400 1.2 5775 5.95
25 9 10 210 2 5875 6.35
26 9 10 300 1.2 5750 6.6
[image:4.596.49.562.53.764.2]27 9 10 400 1.5 5875 5.9
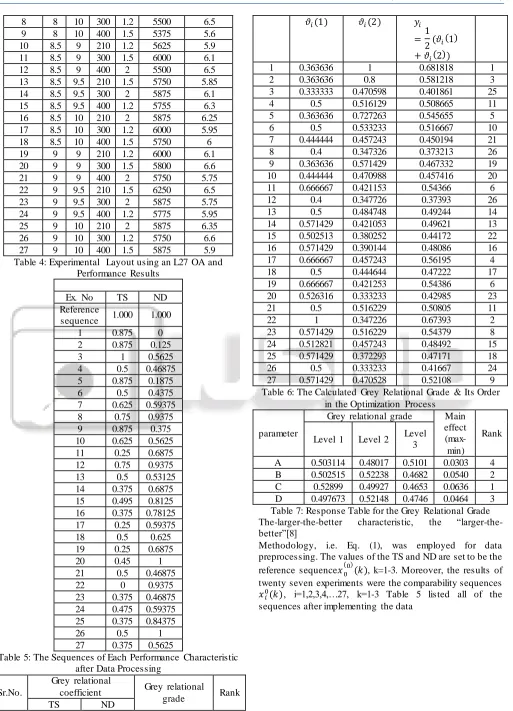
Table 4: Experimental Layout using an L27 OA and Performance Results
Ex. No TS ND
Reference
sequence 1.000 1.000
1 0.875 0
2 0.875 0.125
3 1 0.5625
4 0.5 0.46875
5 0.875 0.1875
6 0.5 0.4375
7 0.625 0.59375
8 0.75 0.9375
9 0.875 0.375
10 0.625 0.5625
11 0.25 0.6875
12 0.75 0.9375
13 0.5 0.53125
14 0.375 0.6875
15 0.495 0.8125
16 0.375 0.78125
17 0.25 0.59375
18 0.5 0.625
19 0.25 0.6875
20 0.45 1
21 0.5 0.46875
22 0 0.9375
23 0.375 0.46875
24 0.475 0.59375
25 0.375 0.84375
26 0.5 1
27 0.375 0.5625
Table 5: The Sequences of Each Performance Characteristic after Data Processing
Sr.No.
Grey relational
coefficient Grey relational
grade Rank
TS ND
) )
)
))
1 0.363636 1 0.681818 1
2 0.363636 0.8 0.581218 3
3 0.333333 0.470598 0.401861 25
4 0.5 0.516129 0.508665 11
5 0.363636 0.727263 0.545655 5
6 0.5 0.533233 0.516667 10
7 0.444444 0.457243 0.450194 21
8 0.4 0.347326 0.373213 26
9 0.363636 0.571429 0.467332 19
10 0.444444 0.470988 0.457416 20
11 0.666667 0.421153 0.54366 6
12 0.4 0.347726 0.37393 26
13 0.5 0.484748 0.49244 14
14 0.571429 0.421053 0.49621 13
15 0.502513 0.380252 0.44172 22
16 0.571429 0.390144 0.48086 16
17 0.666667 0.457243 0.56195 4
18 0.5 0.444644 0.47222 17
19 0.666667 0.421253 0.54386 6
20 0.526316 0.333233 0.42985 23
21 0.5 0.516229 0.50805 11
22 1 0.347226 0.67393 2
23 0.571429 0.516229 0.54379 8
24 0.512821 0.457243 0.48492 15
25 0.571429 0.372293 0.47171 18
26 0.5 0.333233 0.41667 24
27 0.571429 0.470528 0.52108 9
Table 6: The Calculated Grey Relational Grade & Its Order in the Optimization Process
parameter
Grey relational grade Main effect
(max-min)
Rank Level 1 Level 2 Level
3
A 0.503114 0.48017 0.5101 0.0303 4
B 0.502515 0.52238 0.4682 0.0540 2
C 0.52899 0.49927 0.4653 0.0636 1
D 0.497673 0.52148 0.4746 0.0464 3
Table 7: Response Table for the Grey Relational Grade The-larger-the-better characteristic, the “larger-the-better”[8]
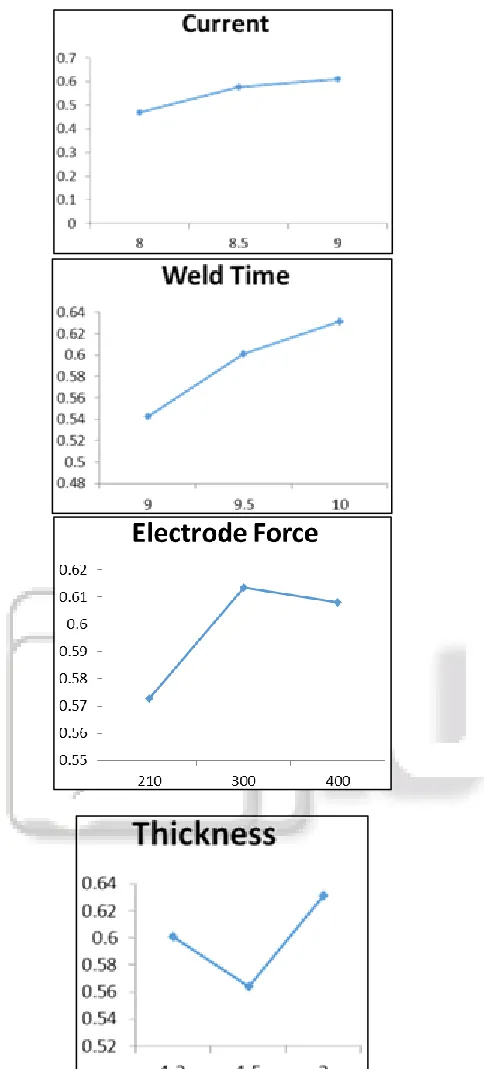
Fig. 2: Effect of RSW Parameters on the Multi-Performance Characteristics
Furthermore, ANOVA has been performed on grey relational grade to obtain contribution of each process parameter affecting the two process characteristics jointly and is discussed in the forthcoming section
Paramete r
DO F
Sum of Square
s
Mean squares
F ratio
% Contributio
n
A 2 0.0045
1
0.0022 5
0.091
6 6
B 2 0.0134
4
0.0067 2
0.272
8 18
C 2 0.0182
6
0.0091
3 0.370 24
D 2 0.0097
0
0.0048 5
0.196
8 13
Error 18 0.0302
6
0.0016
8 40
Total 26 0.0761
8
0.0246
4 100
Table 8: ANOVA of Grey Relational Grade
Additionally, Table 8 gives the results of the analysis of variance (ANOVA) for the TS and the ND using the calculated values from the Grey relational grade of Table 6 and the response table of Table 5. According to Table 8, the factor C, the Electrode force with 24% of contribution, is the most significant controlled parameters for the resistance spot welding operation; the weld time is with 18% contribution, the thickness with 13%, and the current with 6% of contribution if the maximization of the tensile strength and nugget diameter are simultaneously considered.
B. Confirmation Test
After identifying the most influential parameters, the finalphase is to verify the TS and ND by conducting the confirmation experiments. The A3B2C1D2 is an optimal parameter combination of the resistance spot welding process via the Grey relational analysis. Therefore, the condition A3B2C1D2 of the optimal parameter combination of the RSW process was treated as a confirmation test. If the optimal setting with a current of 9 kA, a weld time of 9.5 cycle, a electrode force of 9.5 KN , and thickness of 1.5 mm is used, the final workpiece gives the tensile strength (i.e., TS) of 5250 KN, the nugget diameter (i.e., ND) of 5.5mm. In summary, the result of the confirmation testis better than the experiments in Table 4
V. CONCLUSIONS
The GRA based on the Taguchi method’s response table has been proposed as a way of studying the optimization of RSW process parameters for GI, CRC D2 Sheet. The optimal machining parameters have been determined by the grey relational grade and Genetic Algorithm for multi performance characteristics that is Tensile Strength and Nugget Diameter. Twenty seven experimental runs based on OA’s have been performed. The following conclusions can be drawn from this study.
The work has successfully calculated the feasibility of Tensile strength in Resistance spot weld of unequal thickness of CRC D2 sheet.
From the response table of the average grey relational grade, it is found that the largest value of grey relational grade for current, weld time electrode force and thickness are 8 KA, 9 cycle, 210 KN and 1.2mm, respectively. These are the recommended levels of controllable process factors when better Tensile strength, lesser Nugget Diameter is simultaneously obtained.
[image:5.596.56.298.64.599.2]Microstructure of weld, it is evident that when current and electrode force is increased the TS increased. Based on test, the improvement in TS and ND is 5375
KN, and 5 mm from 5250 KN and 5.5 mm respectively. It is shown that the performance characteristics of the Resistance spot weld process such as TS and ND are improved together with reducing power consumption using the method proposed by this study. The effectiveness of this approach has been successfully established by validation experiment.
REFERENCES
[1] AMBROZIAK, M. KORZENIOWSKI, “Using
resistance spot welding for joiningaluminum elements in automotive industry”, ARCHIVES OF CIVIL AND MECHANICAL ENGINEERING, Vol. X, 2010. [2] M. Pouranvari, and S.P.H Marashi,“Factors Affecting
Mechanical Properties of Resistance Spot Welds,” Materials Science and Technology, vol. 26, no. 1, 2010, pp. 1137-1144
[3] M. Balasubramaniam, and V. Subramanian, “Effect of Process Parameters on SPRC35 Spot Welded Automotive Panels,”ActaMetallurgicaSinica, vol. 23, no. 3,2010, pp. 185-190
[4] S. Aslanlar, et.al “Effect of welding current on mechanical properties of galvanized chromided steel sheets in electrical resistance spot welding” Materials and Design, 28 (2007), 2–7
[5] AMBROZIAK, M. KORZENIOWSKI, “Using
resistance spot welding for joiningaluminum elements in automotive industry”, ARCHIVES OF CIVIL AND MECHANICAL ENGINEERING, Vol. X, 2010. [6] M. Pouranvari, and S.P.H Marashi,“Factors Affecting
Mechanical Properties of Resistance Spot Welds,” Materials Science and Technology, vol. 26, no. 1, 2010, pp. 1137-1144
[7] M. Balasubramaniam, and V. Subramanian, “Effect of Process Parameters on SPRC35 Spot Welded Automotive Panels,”ActaMetallurgicaSinica, vol. 23, no. 3,2010, pp. 185-190
[8] S. Aslanlar, et.al “Effect of welding current on mechanical properties of galvanized chromided steel sheets in electrical resistance spot welding” Materials and Design, 28 (2007), 2–7
[9] M. Salem, et.al “Improved Consistency Of Resistance Spot Welding With Tip Voltage Control” IEEE CCECE, 2011
[10]NachimanCharde, “An Experimental Investigation on Spot Weld Growth on Dissimilar Joints of 304L Austenitic Stainless Steel and Medium Carbon Steel,” International Journal of Advances in Applied Sciences (IJAAS) Vol. 2, No. 1, March 2013, pp. 25~32 ISSN: 2252-8814
[11]Ogur, U. Ozsarac, and E. lhan, “Effect Of Welding Current On Mechanical Properties Of Galvanized Chromate Steel Sheets In Electrical Resistance Spot Welding,” Materials and Design, vol. 28, 2007, pp. 2-7 [12]A.G Thakur, T.E. Rao, M.S. Mukhedkar, and V.M.
Nandedkar, “Application of Taguchi Method for Resistance Spot Welding of Galvanized Steel,” ARPN