BearWorks
BearWorks
MSU Graduate Theses
Fall 2018
Relative Contribution of Physical Interference and Allelopathy to
Relative Contribution of Physical Interference and Allelopathy to
Weed Suppression by Winter Annual Cover Crop Mixtures
Weed Suppression by Winter Annual Cover Crop Mixtures
Alyssa D. Travlos
Missouri State University, [email protected]
As with any intellectual project, the content and views expressed in this thesis may be considered objectionable by some readers. However, this student-scholar’s work has been judged to have academic value by the student’s thesis committee members trained in the discipline. The content and views expressed in this thesis are those of the student-scholar and are not endorsed by Missouri State University, its Graduate College, or its employees.
Follow this and additional works at: https://bearworks.missouristate.edu/theses
Part of the Agriculture Commons, Agronomy and Crop Sciences Commons, and the Weed Science Commons
Recommended Citation Recommended Citation
Travlos, Alyssa D., "Relative Contribution of Physical Interference and Allelopathy to Weed Suppression by Winter Annual Cover Crop Mixtures" (2018). MSU Graduate Theses. 3318.
https://bearworks.missouristate.edu/theses/3318
This article or document was made available through BearWorks, the institutional repository of Missouri State University. The work contained in it may be protected by copyright and require permission of the copyright holder
RELATIVE CONTRIBUTION OF PHYSICAL INTERFERENCE AND ALLELOPATHY TO WEED SUPPRESSION BY WINTER ANNUAL COVER
CROP MIXTURES
A Masters Thesis Presented to The Graduate College of Missouri State University
TEMPLATE
In Partial Fulfillment
Of the Requirements for the Degree Master of Science
By
Alyssa D. Travlos December 2018
RELATIVE CONTRIBUTION OF PHYSICAL INTERFERENCE AND
ALLELOPATHY TO WEED SUPPRESSION BY WINTER ANNUAL COVER CROP MIXTURES
Agriculture
Missouri State University, December 2018 Master of Science
Alyssa D Travlos ABSTRACT
Cover cropping systems are widely used in crop production systems to prevent erosion, improve soil health, and suppress weeds. Common cover cropping systems include combinations of cereal rye (Secale cereale L.), Brassica species, legumes, and other winter annual species. Three cover crop mixtures (cereal rye alone, cereal rye plus winter pea, and cereal rye plus winter pea plus radish) were applied using three methods (fresh residue, dried leached residue, and leachate) to common waterhemp (Amaranthus tuberculatus var. rudis) and large crabgrass [Digitaria sanguinalis (L.) Scop.]. The experiment was conducted once in a greenhouse and once in a
growth chamber Significant interactions (α=0.05) were observed in the greenhouse study
between treatment and days after planting (DAP) for emergence, height, and leaf count for common waterhemp. In addition, fresh cover crop residues suppressed common waterhemp emergence relative to dried leached residue. The interaction of treatment and DAP was also significant for large crabgrass emergence. In the growth chamber study, common waterhemp data were inclusive due to poor emergence. No significance was observed with the large crabgrass, but trends suggest that fresh residue was more effective than other applications. In conclusion, the results of this study suggest that cover crop mixtures did not influence weed response, but data suggest that allelopathy had an important contribution in both environments. KEYWORDS: cover crop, cover crop mixtures, herbicide resistance, allelopathy, common waterhemp, large crabgrass
RELATIVE CONTRIBUTION OF PHYSICAL INTERFERENCE AND ALLELOPATHY TO WEED SUPPRESSION BY WINTER ANNUAL COVER
CROP MIXTURES
By
Alyssa D. Travlos
A Masters Thesis
Submitted to the Graduate College Of Missouri State University In Partial Fulfillment of the Requirements
For the Degree of Master of Science
December 2018 Approved:
Sarah Lancaster, PhD Thesis Committee Chair Michael Burton, PhD Committee Member Michael Goerndt, PhD Committee Member
Julie Masterson, Ph.D., Dean of the Graduate College
In the interest of academic freedom and the principle of free speech, approval of this thesis indicates the format is acceptable and meets the academic criteria for the discipline as
determined by the faculty that constitute the thesis committee. The content and views expressed in this thesis are those of the student-scholar and are not endorsed by Missouri State University, its Graduate College, or its employees.
ACKNOWLEDGEMENTS
My time at Missouri State University has been extremely enjoyable and some of the best years of my life. I wouldn’t take back a single moment of my time here for it has helped me grow and develop into the person I am today. Achieving this Master’s degree wouldn’t be possible without the never ending support of many people.
I would like to thank Dr. Sarah Lancaster for appointing me as one of her graduate students. She was always willing to help and listen to my crazy ideas from the moment I first sat down and spoke with her. I would also like to thank the rest of my committee; Dr. Mike Burton and Dr. Mike Goerndt. They were always willing to lend a helping hand or listening ear without hesitation. I would also like to think the rest of the faculty and staff within the Darr College of Agriculture. Without their support through my undergrad and Master’s education I wouldn’t be where or who I am today.
Finally, I would like to thank all of my family and friends for the endless love and support through this process. Their encouragement and devotion helped to make this dream a possibility and I couldn’t have done it without them. I want to thank my amazing husband, Benjamin for his never ending faith in me and for always being my rock. Without everybody’s support during this time, obtaining this degree wouldn’t have been possible.
I dedicate this thesis to my parents Mark and Dana Hultgren and brothers Chase and Blake. They have always supported me and pushed me to better myself. Chase and Blake, I want you to always remember you can do anything you set your heart. Thank you for always believing in me.
TABLE OF CONTENTS Introduction ...1 Literature Review...2 Importance of Soybeans ...2 Weeds ...2 Common Waterhemp ...3 Large Crabgrass ...3 Herbicide Resistance ...4
Integrated Pest Management ...5
Cover Crops ...5
Cover Crops and Weed Management ...6
Commonly Used Species and Their Allelochemicals ...7
Objectives ...9
Materials and Methods ...10
Methods Common for Both Studies ...10
Preparation Common for Both Studies ...10
Greenhouse Studies ...11
Growth Chamber Studies ...12
Harvest Measurements ...13
Results ...14
Greenhouse Studies ...14
Common Waterhemp ...14
Large Crabgrass ...16
Growth Chamber Studies ...17
Common Waterhemp ...17
Large Crabgrass ...17
Discussion ...18
LIST OF TABLES
Table 1. Treatment applications for studies ...25
Table 2. Cover crop mixtures and their composition ...25
Table 3. Greenhouse common waterhemp ANOVA-repeated measures ...25
Table 4. Greenhouse common waterhemp orthogonal contrasts ...26
Table 5. Greenhouse common waterhemp and large crabgrass ANOVA-harvest measurements 26 Table 6. Greenhouse large crabgrass ANOVA-repeated measures ...27
Table 7. Greenhouse large crabgrass orthogonal contrasts ...27
Table 8. Growth chamber common waterhemp and large crabgrass ANOVA-harvest measurements ...28
LIST OF FIGURES
Figure 1. Greenhouse common waterhemp emergence during study ...29
Figure 2. Greenhouse common waterhemp height during study ...30
Figure 3. Greenhouse common waterhemp leaf count during study ...31
Figure 4. Greenhouse common waterhemp emergence based on applications ...32
Figure 5. Greenhouse common waterhemp height based on applications ...33
Figure 6. Greenhouse common waterhemp leaf counts based on applications ...34
Figure 7. Greenhouse common waterhemp emergence-harvest measurements ...35
Figure 8. Greenhouse common waterhemp height-harvest measurements ...36
Figure 9. Greenhouse common waterhemp LAI-harvest measurements ...37
Figure 10. Greenhouse common waterhemp SPAD-harvest measurements ...38
Figure 11. Greenhouse common waterhemp dry weight- harvest measurements ...39
Figure 12. Greenhouse large crabgrass emergence during study ...40
Figure 13. Greenhouse large crabgrass height during study ...41
Figure 14. Greenhouse large crabgrass leaf count during study ...42
Figure 15. Greenhouse large crabgrass leaf counts based on applications ...43
Figure 16. Greenhouse large crabgrass emergence based on applications ...45
Figure 17. Greenhouse large crabgrass height based on applications ...46
Figure 18. Greenhouse large crabgrass emergence- harvest measurements ...47
Figure 19. Greenhouse large crabgrass height- harvest measurements ...48
Figure 20. Greenhouse large crabgrass LAI-harvest measurements ...49
Figure 21. Greenhouse large crabgrass SPAD-harvest measurements ...50
Figure 23. Growth chamber large crabgrass emergence-harvest measurements ...52
Figure 24. Growth chamber large crabgrass height-harvest measurements ...53
Figure 25. Growth chamber large crabgrass LAI-harvest measurements ...54
INTRODUCTION
Populations of herbicide resistant weeds are increasing, making row crop production more difficult for producers. There are a total of 495 unique cases of herbicide resistant weeds globally. There are currently 26 sites of action with evolved resistance to 23 of them (HRAC 2018). This increase in resistance and lack of new chemical technology is making it imperative for producers to have other methods to help manage weed populations that are present in the production system. Cover crops are planted for the protection and enrichment of the soil and not for a harvestable product. Cover crops have many benefits upon implementation to ranging from soil health to weed control. Cover crops are able to physically modify seed germination by altering the growing environment. This could be by reducing light availability or by changing the soil temperature and moisture (Creamer et al. 1996). Some cover crops also have the ability to suppress weeds with allelopathy (Zimdahl 2013).
LITERATURE REVIEW
Importance of Soybean Production
Soybeans [Glycine max (L.) Merr] are a crucial product in multiple industries outside of and including agriculture. An individual soybean plant generally produces between sixty and eighty pods with each pod containing two to four pea-sized beans. In the United States, soybeans were originally grown as a forage crop. They were first planted as a row crop during the 1940s, but it wasn’t till the 1980s that an increase in planted acreage was observed (Missouri Crop Resource Guide 2018). In 2016, the United States produced 4.31 billion bushels of soybeans from 83 million acres. Nearly half of the 2016 crop, 2.03 billion bushels, were exported,
representing 47% of world export production for the year. Soybean is the top-ranked agricultural commodity in Missouri, followed by corn (USDA NASS 2017). Missouri currently ranks sixth in United States soybean production with a five-year average of 5.3 million acres harvested
yielding 40.4 bushels per acre (Missouri Crop Resource Guide 2018). According to the 2012 agriculture census for the state of Missouri, 148,826,538 bushels were harvested off of 5,250,275 acres (USDA Ag Census 2012).
Weeds
Weeds are something that agricultural producers have struggled against since the
beginning of farming. Weed management is an important aspect of crop production because they compete with crops for nutrients, light, and water. This competition can result in decreased crop yield and quality (Zimdahl 2013). Some weed species are harder to manage than others. Some of
[Amaranthus tuberculatus (Moq.) J. D. Sauer] and large crabgrass [Digitaria sanguinalis (L.) Scop.].
Common Waterhemp. Common waterhemp is a summer annual commonly found throughout the central and eastern parts of the United States that can reduce soybean yield by as much as 44% (Steckel and Spraque 2004). Common waterhemp is a dioecious species with complex terminal inflorescences (Crespo 2012). Common waterhemp seeds measure between 0.8 mm to 1 mm in diameter. Seed production can be as much as 1.5 times more than that of other pigweeds. Each plant generally produces 250,000 seeds but can produce as much as 1 million or more in optimal conditions. Research shows that 12% of seeds remain viable in the soil seedbank after 4 years (Buhler and Hartzler 2001). Common waterhemp emerges throughout the growing season, with a greater percentage of plants emerging later than most summer annuals, which is related to the presence of a C4 photosynthetic pathway (Crespo 2012). Hartzler (1999) found that in the upper Midwest, most plants emerged in late June to early July. Later emergence allows plants to avoid PRE applications of herbicides and POST applications of nonresidual herbicides (Crespo 2012).
Large Crabgrass. Large crabgrass is a summer annual that can be found across the United States. This species is more commonly found in agronomic crops, horticultural crops, and in turf/landscapes in nearly all soil types (Uva et al 1997). Large crabgrass reproduces by seed and spreads via tillering. A single plant can produce 150-700 tillers and up to 150,000 seeds (University of Massachusetts Extension 2011). Once the seeds shatter, they remain dormant for a period of time before germinating. When the soil temperature has been 11°C for four consecutive days they will begin to germinate (University of Massachusetts Extension 2011). Once
a C4 plant. Large crabgrass continues vegetative growth through midsummer and then begins reproductive growth. Seed heads will continue to form until the first killing frost (University of Massachusetts Extension 2011).
Herbicide Resistance. Populations of herbicide resistant weed biotypes are a growing problem in crop management. Herbicide resistant weeds were first discovered in the United States in the late 1960s in a nursery that repeatedly sprayed simazine, a triazine herbicide, to control common groundsel (Senecio vulgaris L.; Holt 1992). However, the first confirmed case of an herbicide resistant weed in Missouri wasn’t until 1992 when common cocklebur (Xanthium strumarium L.) resistant to ALS-inhibiting (Group 2) herbicides was reported (Heap 2018). Two years later, in 1994, Missouri had three more confirmed cases of herbicide resistant weeds. Those weeds were waterhemp resistant to ALS inhibitors and photosystem II inhibitors (Group 5) and barnyardgrass [Echinochloa crus-galli (L.) P. Beauv] resistant to ALS inhibitors (Heap 2018).
Weed populations typically become resistant to herbicides after repeated use of an herbicide for many years in a row. When weeds become resistant to an herbicide, the population changes in favor of members with differences at the biochemical site of action. Herbicide site of action is the site in the plant that the herbicide disrupts to interfere with plant growth and
development (Peterson et al. 2015). According to the International Survey of Herbicide Resistant Weeds, there are a total of 26 sites of action and weed biotypes resistant to 23 sites of action have been described. Currently, the site of action with the most resistant weed species is ALS inhibitors with 160 resistant species. Following ALS inhibitors, photosystem II inhibitors, ACCase inhibitors, EPSPS inhibitors, and T1R1 auxin receptors have the most resistant species
photosystem II inhibitors, PPO inhibitors, EPSPS inhibitors, T1R1 auxin receptors, and HPPD inhibitors. Large crabgrass has reported resistance to ACCase inhibitors, ALS inhibitors, and photosystem II inhibitors (Heap 2018). Some herbicide resistant weed biotypes have multiple pathways of resistance while some possess just a single pathway.
Integrated Pest Management
Development of an integrated pest management program to manage herbicide resistant weed populations is crucial. An integrated pest management program is an ecological approach for the management of multiple pests with a variety of tactics (Flint 2012). In addition to chemical control, producers also use mechanical and cultural management. Mechanical management methods, such as tillage, mowing, hand weeding, or mulching, have the longest history and are commonly used developing countries. Cultural management techniques are based on the plant growth environment. Cultural management methods include planting date, planting population, and cover cropping. While these methods are unlikely to control weeds on their own, when used in conjunction with other methods, they can be very effective (University of
California IPM 2016).
Cover Crops
Cover crops are planted for the protection and enrichment of the soil, not for production of a harvestable product. Cover crops have many benefits to offer, from erosion control to improved soil health. These benefits not only increase cash crop production but protect the environment as well. According to Hartwig et al. (2002) the primary benefit of cover cropping is the reduction of water runoff and soil erosion, which increases soil productivity. Hall et al.
(1984) found that when corn was planted in birdsfoot trefoil or crown vetch living mulch on a 14% slope, water runoff, soil loss, and pesticide loss were reduced 95% to 99% when compared with conventional tillage. Cover crops can also increase soil organic matter, which also improves soil structure and tilth. Danso et al. (1991) reported that cover crops improve the soil structure, tilth, and water-holding capacity, which results in reduced risk of the environmental pollution by nitrogen fertilizers.
Cover crops and Weed Management. Cover crops also serve as a barrier to weed emergence or as competitors with weeds that might occur in a field. They serve as a physical barrier by smothering the weeds, suppressing seed germination and growth, or by lowering soil temperatures. Recent increased interest in cover crops gives rise to the question as to what benefits might be obtained from planting mixtures instead of monocultures. Research conducted in 2012 by the University of Nebraska-Lincoln showed that on an equivalent land basis area, cover crop mixtures were more productive than monocultures, but they didn’t result in an increase in cash crop productivity or establishment of the cover crop (Wortman et al. 2012).
A second method by which cover crops contribute to weed control is allelopathy. Allelopathy is a form of plant interference that occurs when one plant inhibits with growth of another through a chemical inhibitor (Zimdahl 2013). The production of allelochemicals varies with the environment and the accompanying stresses of the environment. Einhellig (1996) found that environmental conditions can modify the rate of allelochemical production, meaning
environmental stress could enhance the relative biological activity of an allelochemical so that a lower concentration may inhibit growth of other plants. Allelochemicals enter the environment in many ways, primarily through root exudation, movement through the soil via leaching, or
volatilization (Zimdahl 2013). The mode and time at which the chemical enters can alter the effects that take place.
Commonly Used Species and Their Allelochemicals. While there is an array of plant species that can be used for cover cropping, some species are more commonly used than others. In Missouri, some commonly used species include cereal rye (Secale cereal L.), brassica species such as radish (Raphanus sativus L.), and legume species such as winter pea (Pisum sativum L.). All of these species are known to produce allelochemicals and each has unique advantages and disadvantages for use.
Cereal rye can be seeded later in the fall than most cover crops and still produce sufficient biomass. Rye outperforms most other cover crops when planted on land that is infertile, sandy, acidic, or poorly prepared. Rye overseeds readily into many agronomic crops and resumes growth quickly in the spring. This allows for a timely killing by either rolling, mowing, or herbicide application (SARE 2012). Rye is easy to establish with the ability to become established in many different soil types and environments. For use as a winter annual cover crop, seeding in late summer to midfall is recommended for optimal growth. In the spring, rye matures and grows quickly. Rye can immobilize nitrogen, depending on its maturity at termination. An early kill of rye has the possibility of reducing nitrogen immobilization and conserving soil moisture. However, a late kill of rye can deplete soil moisture and produce more residue (Clark et al. 1997). This increase is residue could be difficult for a tillage system to handle due to an increase in above ground biomass (SARE 2012).
The common allelochemicals found cereal rye are DIBOA
(2,4-Dihydroxy-1,4_benzoxazin-3-one), and its metabolite, BOA (2-benzoxazonlinone; Kelton 2012). DIBOA exists as a nontoxic, stable glucoside that is released through enzymatic hydrolysis. This process
is activated upon wounding or tissue death. At elevated temperatures, DIBOA spontaneously degrades to BOA which is a less toxic and more stable metabolite (Barnes 1987).
Brassica species are commonly known for rapid growth in the fall, high biomass
production and nutrient foraging ability. Brassicas are normally used as a cover crop in vegetable and specialty crop production but are gaining popularity in row crop production. This is
primarily due to their ability for capturing nutrients, trapping nematodes, and for their
biofumigation activity. Brassicas act as biofumigants with the release of chemical compounds that can be toxic to soil borne pathogens and pests. For establishment of brassicas, it is best to plant them 4 weeks before the average of the first freeze with the maximum soil temperature of
85degrees Fahrenheit and the minimum 45 (SARE 2012). The allelochemical found in brassica
species are gluconsinolates (Kelton et al. 2012). Gluconsinolates are secondary metabolites that contain sulfur and nitrogen. They are enzymatically hydrolyzed by myrosinase in the presence of water to form isothiocyanates (Haramoto et al. 2005).
Winter peas exhibit rapid growth in cool, moist weather. They can withstand
temperatures as low as -12°C. However, they don’t consistently grow well in areas colder than moderate hardiness zone 6. For optimal performance, pea should be established in soils that are well-drained with a neutral pH and moderate fertility. Winter pea excels at fixing nitrogen and produces abundant amounts of vining forage. This helps contribute to short-term soil
conditioning. Termination can be accomplished easily with herbicides or by disking and mowing after full bloom (SARE 2012). The allelochemicals found in winter pea are coumarins (Kelton, 2016). These are compounds that can also be found in the Apiaceae and Asteraceae families (Razavi 2011).
A producer can realize many benefits by implementing cover crops into their integrated pest management program. Managing populations of herbicide resistant weeds requires
additional, nonchemical control options such as cover crops. The implementation of cover crops will not only improve weed management, but it will also improve the overall land management. The main goal of producers is to help feed the world, but it is also to help preserve the land and leave it better off than when they found it. Cover cropping systems have the capability to aid producers in all of these aspects of their operation.
Objectives
The overall objective of this study was to evaluate control of common and troublesome weeds found in Missouri cropping systems using cover crops. Specifically, this study sought to identify effective cover crop mixtures and evaluate the relative contribution of allelopathy and physical suppression of selected weed species. The weed species for the present study were chosen because they are commonly found in Missouri fields, grow rapidly, are prolific seed producers, and have the potential to be difficult to control. Cover crop species were chosen due to being popular for use with producers and for their allelopathic capabilities.
MATERIALS AND METHODS
Methods Common to Both Experiments
Greenhouse and growth chamber studies were conducted in Greene County, Missouri during the summer of 2018 to evaluate the relative contribution of physical interference and allelopathy to weed suppression by winter annual cover crop mixtures. This study evaluated the effects on two weed species, large crabgrass and common waterhemp. The experiment had a factorial treatment arrangement plus a non-treated control. There were three cover crop mixtures, a cereal rye monoculture, a cereal rye plus winter pea mixture, and a cereal rye plus winter pea plus radish mixture. There were also three methods of application, a fresh biomass, dried leached biomass, and leachate (Table 1). Treatment applications were assigned using a random number generator resulting in a randomized complete block design. There were four replications for each species, with ten pots per replication.
Preparation Common to Both Studies
Cover crops were grown in a greenhouse located on the Missouri State University
campus located at 37.19905°N, -93.27618°E. Cereal rye (45 g area-1, Beck’s. Atlanta, IN),
Austrian winter pea (20 g area-1, Green Seed Inc. Springfield, MO), and radish (25 g area-1,
Beck’s. Atlanta, IN) were seeded into greenhouse flats on April 22, 2018. Seed was planted into Promix BX with mycorrhizae (Pro Mix®, Quakertown, PA). These planting rates were used to simulate those similar to what producers would plant in the field (Nathan and Reinbott, 2011). Three-week old shoots were harvested on May 13, 2018 and combined into mixtures. Mixtures
and cereal rye, Austrian winter pea, and radish (4.8 g of each; Table 2). Mixtures were dried for 48 hours at 50°C in a forced-air dryer (Cascade Tek®, Cornelius, OR). Oven-dried material was cut into 1-2 cm pieces and placed in 200 mL of distilled water at a pH of 6. Cover crop mixtures were then shaken for 24 hours at room temperature at a speed of 350 rotations per minute
(VWR® Incubating Mini Shaker, Radnor, PA). After 24 hours, mixtures were vacuum-extracted through 4 layers of cheesecloth until no additional leachate was removed. Original residue was resuspended in distilled water (pH 6) and re-extracted after an additional 48 hours on shaker. The same vacuum-extraction procedure was performed. Extracts (250 mL) were centrifuged
(Beckman® J2-HS, Indianapolis, IN) at 4,000xg for 10 minutes. Leachate was stored in the dark at 7°C for four days until applied. The leached residues were re-dried at 50°C for 48 hours and stored at room temperature until treatments were applied (Burgos et al. 1999). Fresh residues were maintained in a greenhouse until study initiation and applied immediately after harvest. All cover crop treatments were applied immediately after planting.
Greenhouse Studies
Common waterhemp and large crabgrass were planted on May 26, 2018 in 15-cm plastic
azalea pots containing 49.5cm3 of growing medium (Promix BX with mycorrhizae, Pro Mix®,
Quakertown, PA). Each pot contained 20 seeds of each species.
Fresh cover crop residue was applied at a rate of 1.2 g of residue per pot to designated pots. The leached residue application was 0.07 g per pot for the cereal rye monoculture, 0.09 g per pot of the cereal rye and winter pea mixture, and 0.06 g per pot of the cereal rye, winter pea, and radish mixture. There is a difference between biomass weights for dried leached residue because application weight was based on remaining biomass after extraction and drying process.
All mixtures started with the same fresh biomass weight. For all applications of leachate, 50 mL were applied. Plants grew for 42 days (harvested July 7,2018) and pots were evaluated daily. During the study, the average maximum temperature in the greenhouse was 37.1°C and the average minimum temperature was 19.2°C. The average photoperiod was 14 hours and 44 minutes.
Growth Chamber Studies
Common waterhemp and large crabgrass were planted in 0.9-mL Styrofoam cups. Seed was planted into a 100% sand mixture. Each pot contained 10 seeds of the designated plant. Treatments were applied similarly to the greenhouse study, except for the mass of fresh and dried residue. Fresh residue was applied at a rate of 2.1g, 0.13g, and 0.1g of the one-, two-, and three-way mixtures, respectively. Variation in rates were seen to help make it comparable to the dried leached residue applications. Leached residue was applied at 0.13g per pot for the cereal rye monoculture, 0.1g per pot for the cereal rye and winter pea mixture, and 0.09g per pot for the cereal rye, winter pea, and radish mixture. There is a difference between biomass weights for dried leached residue because application weight was based on remaining biomass after extraction and drying down process. All mixtures started with the same fresh biomass weight. For leachate applications, 50mL was applied. Plants grew for 28 days and cups were evaluated daily and watered as needed. The growth chamber settings were programmed to simulate day and night time with different light settings and temperatures. Day time was set from 10am to 6pm with the temperature at 27°C. Night time was set from 7pm to 9am with temperature at 15°C. The growth chamber used was a Low Temperature Diurnal Illumination Incubator (2015
Harvest Measurements
Plants were harvested 42 days after planting (DAP) in the greenhouse and 29 DAP in the growth chamber. Throughout the duration of the greenhouse study, emergence counts, height measurements, and leaf counts were recorded. Height and leaf counts were measured on the tallest plant in each pot. Upon harvest, final emergence counts, final height, fresh biomass, leaf area index (LAI), and SPAD meter readings were taken. Emergence counts, height
measurements, and leaf counts were not taken throughout the growth chamber study as a result of slow emergence. SPAD meter measurements were not taken in the growth chamber study due to the small leaf size. Dry biomass was weighed after being dried at 50°C for 48 hours. For the growth chamber study emergence counts, height, fresh biomass, and leaf area index were recorded at harvest. Dry biomass was weighed after being dried at 50°C for 48 hours.
Data were analyzed using mixed model analysis in SAS (SAS 9.4, SAS® Institute Inc. Cary, NC). Replicate was considered a random effect, while treatment was a fixed effect. Models appropriate for repeated measures were used to analyze data that was collected over time. After initial ANOVA, orthogonal contrasts were used to compare effects of factors. To determine significance, alpha was set at 0.05.
RESULTS
Greenhouse Studies
Common Waterhemp. The interaction of treatment and DAP was significant for common waterhemp emergence, height and leaf counts (Table 3). Mean number of plants emerged ranged from 1.5 to 5.5 at 11 DAP to 3.75 to 10 at 42 DAP. Generally, treatments of leachate of the cereal rye and winter pea had the least emergence throughout the study.
Treatments of the dried leached residue of the cereal rye monoculture had the most emergence (Figure 1). Pots that were treated with dried leached residue of the cereal rye and winter pea mixture resulted in the least amount of plants emerged while the most plants emerged were in pots treated with dried leached residue of the cereal rye monoculture at 42 DAP (Figure 1). Common waterhemp height responded similarly in that the shortest plants were in pots treated with dried leached residue of the cereal rye and winter pea mixture. However, the tallest plants were in pots treated with the leachate from the cereal rye, winter pea, and radish mixture (Figure 2). Similarly, leaf counts were least following applications of dried leached residue of the cereal rye and winter pea mixture. The most leaves were seen after applications of leachate of the cereal rye, winter pea, and radish mixture (Figure 3).
Results of orthogonal contrast are listed in Table 4. No differences were observed among cover crop mixtures; however, differences in emergence were observed among residue types. Emergence following applications of dried residue was greater than emergence following fresh residue. Emergence following leachate application was intermediate and similar to emergence following application of both types of residue. Orthogonal contrasts did not identify differences
methods, the greatest number of common waterhemp plants emerged in pots treated with
applications of dried residue (Figure 4). This suggests that the allelochemicals contained in cover crop mixtures contributed to weed control more than physical mechanism of weed suppression. It is possible that a difference wasn’t seen between the leachate and dried residue applications because all the allelochemicals weren’t extracted during the extraction process. While there wasn’t a statistical difference among the application methods for plant height and leaf counts, similar trends were observed. In regard to height, the tallest plants grew in pots treated with dried leached residue while the shortest plants were in pots treated with fresh residue (Figure 5). The same was true for the leaf counts as well (Figure 6).
Analysis of variance indicated no differences among common waterhemp harvest
measurements (Table 5), but trends were observed. The greatest reduction in emergence occurred following applications of the cereal rye and winter pea mixtures, while the least reduction came from the cereal rye, winter pea, and radish mixture applications (Figure 7). The shortest plants were found in pots treated with applications of fresh residue of the cereal rye and winter pea mixtures, while the tallest plants were treated with dried leached residue of cereal rye, winter pea, and radish (Figure 8). Common waterhemp LAI was least in pots treated with cereal rye and winter pea mixtures and greatest in pots treated with cereal rye monoculture, across all
application methods (Figure 9). Similarly, the smallest SPAD readings within each application method were recorded in pots treated with the cereal rye and winter pea mixture, while the largest readings came from pots treated with the cereal rye, winter pea, and radish mixture (Figure 10). Lastly, the smallest dry weights were observed in pots that had been treated with the cereal rye and winter pea mixture with the largest in the control (Figure 11).
Large Crabgrass. The interaction of treatment and DAP was significant for large crabgrass emergence but not for height and leaf count (Table 6). The mean number of plants emerged ranged from 5.5 to 9.75 at 11 DAP and 6.5 to 10.5 42 DAP. Generally, application of leachate of the cereal rye monoculture resulted in the least emergence while treatments of dried leached residue for the cereal rye monoculture had the most (Figure 12). Despite lack of
significance, trends in height and leaf counts were observed throughout the study. The shortest plants were in pots treated with leachate of cereal rye and winter pea while the tallest were treated with leachate of the cereal rye monoculture (Figure 13). In regard to leaf counts, little variation is seen among treatments throughout the study (Figure 14).
Results of orthogonal contrasts are listed in Table 7. No differences were observed among cover crop mixtures, but differences were observed in leaf counts among residue types. More leaves were seen on plants treated with applications of leachate than dried residue and fresh residue (Figure 15). While orthogonal contrasts did not indicate any differences between applications for emergence or height, trends were observed. Pots with the greatest emergence were treated with dried leached residue while the least emergence was in pots treated with leachate (Figure 16). At 42 DAP, all applications resulted in similar height measurements for all plants (Figure 17). A decrease in height and leaf count was observed around 23 DAP, likely due to insect damage in the greenhouse.
Analysis of variance showed there was not a treatment effect for harvest measurements (Table 5); however, trends were observed. The greatest emergence was seen in pots treated with dried leached residue from the cereal rye monoculture with the least amount of emergence in pots treated with the leachate from the cereal rye monoculture (Figure 18). Trends for height
pea, and radish mixture with the shortest plants being treated with the dried leached residue of the cereal rye monoculture (Figure 19). LAI was greatest in pots treated with applications of fresh residue of the cereal rye and winter pea while it was least in the non-treated pots (Figure 20). SPAD meter readings were least in pots treated with applications of fresh residue of the cereal rye and winter pea while the greatest readings were in pots treated with leachate of the cereal rye monoculture (Figure 21). The lowest dry weights were in pots treated with
applications of fresh residue of the cereal rye monoculture and the plants with the highest dry weights being treated with leachate of the cereal rye monoculture (Figure 22).
Growth Chamber Studies
Common Waterhemp. Analysis of variance of common waterhemp measurements at yielded no significance differences. No treatment means were different than zero (Tables 8 and 9). This a result of poor emergence during the study.
Large Crabgrass. Analysis of variance shows that there was no treatment effect for harvest measurements (Table 8). Similar to the greenhouse studies, trends were observed among application methods. Overall, the least emergence was seen in pots treated with cereal rye monoculture and the greatest emergence was observed in pots treated with the cereal rye, winter pea, and radish mixture (Figure 23). Final height trends suggest that the shortest plants were treated with leachate of the cereal rye and winter pea and tallest were treated with fresh residue of the cereal rye (Figure 24). LAI trends were similar to height trends (Figure 25). Lastly, dry weight trends show that a majority of the applications yielded similar dry weights with the control having the heaviest plants (Figure 26).
DISCUSSION
Differences between the greenhouse and growth chamber results are likely the result of differences in study conditions. The greenhouse experiment allowed the plants to experience more natural growth tendencies with natural lighting and temperatures that were similar to that of the current growing season. This is also similar to the season in which cover crops would be terminated for soybean production. They were also planted into bigger pots, allowing for more surface that needed to be covered by applications. Cover crops have the ability to impact weed populations due to their proximity of residue to the site of germination at the soil surface (Teasdale et al. 1991). These remaining residues on the surface have the ability to alter the growing environment by changing light availability, soil moisture, and soil temperature (Creamer et al. 1996). Amount of ground cover in a field setting is variable, depending on the density the producer plants at, making both situations applicable. Growing medium in the greenhouse was a potting medium commonly used by horticulture producers. It is possible that the chemical and microbial compositions interacted with the allelochemicals, altering their degradation. Allelochemicals have varying half-lives as they degrade into their metabolites (Macías et al. 2005). The length of half-life can be impacted by many soil characteristics
including soil pH and microbial activity (Cipollini et al. 2012, Woodward et al. 1978, Fomsgaard et al. 2012). Pots used in the greenhouse had openings in the bottom while the growth chamber pots were solid bottoms. Openings in the bottoms of pots in the greenhouse allowed for leaching of solution while the closed bottoms in the growth chamber prevented this.
pots, decreasing the surface area and depth of the pot. The growing medium used in the growth chamber was 100% sand. This was picked to decrease the potential for allelochemicals to become sorbed. The use of straight sand as a growing medium resulted in the need to use fertilizer more frequently to make sure seeds had the appropriate nutrients for growth (Landis et al. 2014).
When comparing the two weed species, common waterhemp had slower emergence and growth in both studies. This resulted in seed being exposed to the allelochemicals for a longer period, which could have had a greater effect on the plants. Small amounts of common
waterhemp emergence in the growth chamber also suggests that it is possible the seed had decreased in viability since initial germination tests conducted or that conditions were not ideal for germination. Leon et al. (2004) found that common waterhemp needed a minimum of 10°C to achieve 50% germination. In future studies common waterhemp emergence should be greater with a higher night temperature set around 20°C and new seed. Large crabgrass had more rapid growth, resulting in development of unaffected new tissue, possibly allowing it to grow out of the effects that the allelochemicals had on development. In the growth chamber, the environment was one more suitable for the growth of the large crabgrass.
The mixture consisting of cereal rye, winter pea, and radish resulted in the worst weed control, based on trends. The cereal rye monoculture had varying effects based on the
measurement. The greatest effect was seen in the common waterhemp measurements in the greenhouse. This suggests that the growing environment was more suitable than the growth chamber for the common waterhemp. The applications of dried leached residue were least effective. This suggests that weed control by cover crops is more than a result of physical interference and is enhanced by allelochemicals. This in turn means that cover crops give
producers multiple means of control to incorporate into their integrated weed management program.
While this study did not fully identify the best cover crop mixture for weed control, modifications to this study and more replications would be beneficial. Future replications of this study could be modified as discussed previously to yield better results. Complementary field studies evaluating the effects of planting into an early terminated cover crop versus planting into a living cover crop could be conducted to verify the likelihood that our controlled-environment studies could be replicated in field conditions.
LITERATURE CITED
Barnes JP, Putnam AR (1987) Role of benzoxazinones in allelopathy by rye (Secale cereale L.). Journal of Chemical Ecology 13:889-906
Buhler, DD and Hartzler RG (2001) Emergence and persistence of seed of velvetleaf, common waterhemp, woolly cupgrass, and giant foxtail. Weed Science. 49:230-235
Burgos N, Talbert RE, Mattice JD (1999) Cultivar and age differences in the production of allelochemicals by Secale cereale. Weed Science. 47:481-485
Cipollini D, Rigsby CM, Barto EK (2012) Microbes as targets and mediators of allelopathy in plants. J Chem Ecol. 38:714-727
Clark AJ, Decker AM, Meisinger JJ, McIntosh MS (1997) Kill date of vetch, rye, and a vetch-rye mixture: I. Cover crop and corn nitgrogen. Agronomy Journal. 89:427-434
Creamer NG, Bennett MA, Stinner BR, Cardina J, Regnier EE (1996) Mechanisms of weed suppression in cover crop-based production systems. Hort Science. 31(3):410-413 Crespo R (2012) Understanding the biology, inheritance, and mechanism of resistance of 2,4-D
resistant waterhemp (Amaranthus tuberculatus)- research proposal. Thesis. Lincoln, NE: University of Nebraska
Danso SK, Labandera C, Pastorini D, and Curbelo S (1991) Herbage yield and nitrogen fixation in a triple species mixed sward of white clover, lotus and fescue. Soil Biol. Biochem. 23:6
Einhellig FA (1996) Interactions involving allelopathy in cropping systems. Agronomy Journal. 88:886-892
Flint ML (2012) IPM in Practice. 2nd ed. Richmond, CA: University of California Agriculture and Natural Sciences Communication Services. Pp 35
Fomsgaard IS, Mortensen AG, Idinger J, Coja T, Blümel (2006) Transformation of
benzoxazinones and derivatives and microbial activity in the test environment of soil ecotoxicological tests on Poecilus cupreus and Folsomia candida. J. Agric. Food Chem. 54:1086-1092
Hall JK, Hartwig NL, Hoffman LD (1984) Cynanazine losses in runoff from no-tillage corn in “living mulch” and dead mulches vs. unmulched conventional tillage. J. Environ. Qual. 13:105-110
Haramoto ER, Gallandt ER (2005) Brassica cover cropping: I. Effects on weed and crop establishment. Weed Science. 53:695-701
Hartwig NL, Ammon HU (2002) Cover crops and living mulches. Weed Science. 50:688-699 Hartzler RG, Buhler DD, Stoltenberg DE (1999) Emergence characteristics of four annual weed
species. Weed Science. 47:578-584
Heap I (2018) The international survey of herbicide resistant weeds. http://weedscience.org.
Accessed September 13, 2018
Holt JS (1992) History of identification of herbicide-resistant weeds. Weed Technology. 6:615-620
Kelton J, Price AJ, Mosjidis J (2012) Allelopathic weed suppression through the use of cover crops Pages 115-130 in Price AJ, ed. Weed Control. London: IntechOpen Limited Landis TD, Jacobs DF, Wilkinson KM, Luna T (2014) Tropical nursery Manual: A guide to
Leon RG, Knapp AD, Owen MDK (2004) Effect of temperature on the germination of common waterhemp (Amaranthus tuberculatus), giant foxtail (Setaria faberi), and velvetleaf (Abutilon theophrasti). Weed Science. 56:67-73
Macías FA, Oliveros-Bastidas A, Marín D, Castellano D, Simonet AM, Molinillo JM (2005)
Degradation studies on benzoxazinoids. Soil degradation dynamics of (2R)-2-O-β-D
Glucopyranosyl-4-hydroxy-(2H)-1,4-benzoxazin-3(4H)-one (DIBOA-Glc) and its degradation products, phytotoxic allelochemicals from Gramineae. J. Agric. Food Chem. 53:554-561
Nathan M and Reinbott T (2011) Cover crops and green manure crops.
https://ipm.missouri.edu/MEG/2011/8/Cover-Crops-and-Green-Manure-Crops. Accessed November 6, 2018
Peterson DE, Shoup DE, Thompson CR, Jugulam M (2015) Herbicide mode of action. Kansas State University
Razavi SM (2011) Plant coumarins as allelopathic agents. International Journal of Biological Chemistry 5:86-90
Steckel, LE and Sprague CL (2004) Late-season common waterhemp (Amaranthus rudis) interference in narrow- and wide-row soybean. Weed Technol. 18:947-952
Sustainable Agriculture Research and Education program- SARE (2012) Managing cover crops
profitability. 3rd ed. Pp 98-105
Sustainable Agriculture Research and Education program- SARE (2012) Managing cover crops
profitability. 3rd ed. Pp 81-89, Pp 98-105, Pp 135-141
Teasdale JR, Beste CE, Potts WE (1991) Response of weeds to tillage and cover crop residue. Weed Science. 39:195-199
University of California Agriculture and Natural Resources (2016) Statewide integrated pest
management Program.http://ipm.ucanr.edu/GENERAL/whatisipmurban.html. Accessed:
September 20, 2018
University of Massachusetts-Amherst (2011) Biology and management of crabgrass, Center for
Agriculture. https://ag.umass.edu/turf/fact-sheets/biology-management-of-crabgrass.
Accessed May 9, 2018
University of Missouri (2018) Missouri Crop Resource Guide.
http://crops.missouri.edu/audit/soybean.htm. Accessed April 29, 2018
University of Missouri Weed Science (2018) Common waterhemp, Division of Plant Sciences.
https://weedid.missouri.edu/weedinfo.cfm?weed_id=319. Accessed May 5, 2018
USDA Agricultural Census (2012) Table 1. Historical highlights: 2012 and Earlier Census Years
https://www.agcensus.usda.gov/Publications/2012/Full_Report/Volume_1,_Chapter_1_St ate_Level/Missouri/st29_1_001_001.pdf. Accessed: August 29, 2018
USDA NASS (2017) 2017 State Agriculture overview
https://www.nass.usda.gov/Quick_Stats/Ag_Overview/stateOverview.php?state=MISSO
URI. Accessed April 29, 2018
Uva RH, Neal JC, DiTomaso JM (1997) Weeds of the northeast. Cornell University. Pp 46 Wortman SE, Francis Charles, Lindquist JL (2012). Cover crop mixtures for the western corn
belt: opportunities for increased productivity and stability. Agronomy and Horticulture Faculty Publications
Zimdahl Robert (2013) Fundamentals of weed science. 4th ed. London: Elseveir. Pp 231-245238
TABLES
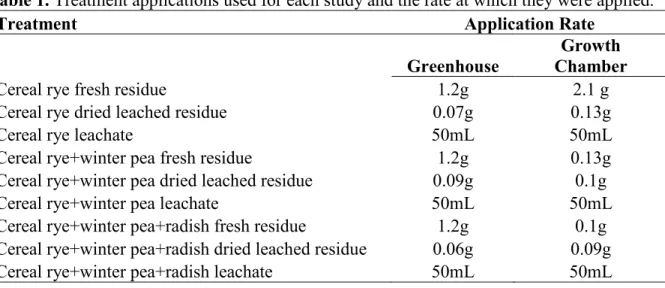
Table 1. Treatment applications used for each study and the rate at which they were applied.
Treatment Application Rate
Greenhouse Chamber Growth
Cereal rye fresh residue 1.2g 2.1 g
Cereal rye dried leached residue 0.07g 0.13g
Cereal rye leachate 50mL 50mL
Cereal rye+winter pea fresh residue 1.2g 0.13g
Cereal rye+winter pea dried leached residue 0.09g 0.1g
Cereal rye+winter pea leachate 50mL 50mL
Cereal rye+winter pea+radish fresh residue 1.2g 0.1g
Cereal rye+winter pea+radish dried leached residue 0.06g 0.09g
Cereal rye+winter pea+radish leachate 50mL 50mL
Table 2. Cover crop mixtures used and the composition of each mixture.
Cover Crop Mixtures Biomass weight (g) % Composition
Cereal rye monoculture 14.4 g 100%
Cereal rye+winter pea 14.4 g 50% per species
Cereal rye+winter pea+radish 14.4 33% per species
Emergence Height Leaves
Effecta F Value Pr > F F Value Pr > F F Value Pr > F
DAP 17.71 <.0001 53.94 <0.0001 79.4 <0.0001
tmt 2.08 0.0312 1.19 0.2983 1.65 0.1012
DAP*tmt 1.81 0.0002 1.35 0.0411 1.67 0.0022
aDAP = days after planting; tmt = treatment.
Table 4. Orthogonal contrasts of emergence, leaf counts, and height for common waterhemp
EMERGENCE LEAF COUNT HEIGHT Comparison estimate p value estimate p value estimate p value Rye monoculture vs
mixtures 4.3192 0.4034 1.2361 0.8258 1.9952 0.7892
Rye vs rye+pea 0.8971 0.7611 3.0326 0.3431 3.3222 0.4343
Rye vs rye+pea+rad 3.4221 0.2466 -1.7964 0.574 -1.327 0.7544
Cover crop vs nontreated -12.4082 0.2624 -3.0878 0.7946 -12.2478 0.4361
Rye monoculture vs
nontreated -1.7645 0.2838 1.0227 0.5617 -0.2869 0.9022
Fresh residue vs dried,
leached residue -6.675 0.0197 -3.3846 0.2678 -6.4167 0.1133
Fresh residue vs leachate 2.9029 0.3255 -1.0604 0.74 -3.0097 0.4787
Dried,leached residue vs
leachate 2.525 0.3757 -4.829 0.1143 -4.6492 0.2507
Table 5. Analysis of variance for measurements taken at harvest in the greenhouse study for common waterhemp and large crabgrass.
Emergence Height SPAD LAI Dry Weight
Common Waterhemp
Effect Value F Pr > F Value F Pr > F Value F Pr > F Value F Pr > F Value F Pr > F tmta 1.77 0.120 1.13 0.377 0.49 0.866 1.61 0.162 0.86 0.568
Large Crabgrass
Effect Value F Pr > F ValueF Pr > F ValueF Pr > F ValueF Pr > F ValueF Pr > F tmta 0.49 0.869 0.26 0.979 0.83 0.598 0.83 0.594 0.42 0.915
Emergence Height Leaves Effecta F Value Pr > F F Value Pr > F F Value Pr > F
DAP 2.77 0.004 192.04 <0.0001 107.23 <0.0001
tmt 0.35 0.9578 0.59 0.801 1.1 0.3641
DAP*tmt 2.57 0.0038 1.26 0.0878 1.24 0.113
aDAP = days after planting; tmt = treatment.
Table 7. Orthogonal contrasts of emergence, height, and leaf count for large crabgrass during
greenhouse study (α=0.05)
Emergence Height Leaves
Contrast estimate p value estimate p value estimate p value
Rye monoculture vs mixtures -5.6245 0.454 4.1865 0.6052 2.25 0.1859
Rye vs rye+pea -4.175 0.3247 1.9695 0.6664 1.0833 0.2586
Rye vs rye+pea+rad -1.4495 0.7322 2.217 0.6275 1.1667 0.2238
Cover crop vs nontreated -7.0505 0.6444 9.942 0.5462 4.25 0.2191
Rye monoculture vs nontreated -1.625 0.4731 -0.84 0.7308 0.2222 0.6643
Fresh residue vs dried, leached
residue 1.6505 0.6739 -4.27 0.3245 -0.5556 0.5311
Fresh residue vs leachate 1.95 0.6453 -6.732 0.1413 -2.1944 0.0226
All residue vs leachate 2.2495 0.7645 -9.294 0.2516 -3.8333 0.0247
Dried, leached resiude vs
leachate 2.7255 0.4872 0.2475 0.9533 0.08333 0.9251
Table 8. Analysis of variance for measurements taken at harvest in the growth chamber study for common waterhemp and large crabgrass.
Common Waterhemp
Effect Value F Pr > F Value F Pr > F Value F Pr > F Value F Pr > F Value F Pr > F tmta 1.14 0.3699 1.24 0.3084 0.99 0.468 0.85 0.5802 1.14 0.369
Large Crabgrass
Effect Value F Pr > F ValueF Pr > F ValueF Pr > F ValueF Pr > F ValueF Pr > F tmta 2.12 0.0607 2.21 0.0513 1.52 0.188 0.85 0.5797 2.12 0.061
atmt = treatment
Table 9. Least square means for at harvest measurements of common waterhemp plants in the growth chamber.
Emergence Height Dry Weight LAI
tmt LSM SE LSM SE LSM SE LSM SE 1 -0.3114 0.3138 -0.7315 0.7068 -0.00294 0.007529 -0.0088 0.01191 2 0.1886 0.3138 0.5185 0.7068 -0.00294 0.007529 0.006702 0.01191 3 -0.3114 0.3138 -0.7315 0.7068 -0.00294 0.007529 -0.0088 0.01191 4 0.4386 0.3138 1.0185 0.7068 0.002056 0.007529 0.01145 0.01191 5 0.1886 0.3138 0.3935 0.7068 0.01206 0.007529 0.0182 0.01191 6 -0.06142 0.3138 -0.3565 0.7068 0.01206 0.007529 -0.00355 0.01191 7 -0.3114 0.3138 -0.7315 0.7068 -0.00294 0.007529 -0.0088 0.01191 8 -0.3114 0.3138 -0.7315 0.7068 -0.00294 0.007529 -0.0088 0.01191 9 -0.3114 0.3138 -0.7315 0.7068 -0.00294 0.007529 -0.0088 0.01191 10 -0.3114 0.3138 -0.7315 0.7068 -0.00294 0.007529 -0.0088 0.01191
Figure 1. Emergence of common waterhemp plants throughout the greenhouse study based on treatment. Abbreviations: r+wp= rye + winter pea, r+wp+ra= rye+winter pea+radish, con= control 0 2 4 6 8 10 12 11 13 16 18 20 23 25 30 37 42 Nu mb er o f P lan ts Eme rg ed
Days After Planting
Common Waterhemp Emergence
fresh rye leached rye leachate rye fresh r+wp leached r+wp leachate r+wp fresh r+wp+ra leached r+wp+ra leachate r+wp+ra con
Figure 2. Height of common waterhemp plants throughout the greenhouse study based on treatment. Abbreviations: r+wp= rye + winter pea, r+wp+ra= rye+winter pea+radish, con= control 0 5 10 15 20 25 30 35 40 45 50 11 13 16 18 20 23 25 30 37 42 He ig ht (cm )
Days After Planting
Common Waterhemp Height
fresh rye leached rye leachate rye fresh r+wp leached r+wp leachate r+wp fresh r+wp+ra leached r+wp+ra leachate r+wp+ra con
Figure 3. Leaf counts of common waterhemp plants throughout the greenhouse study based on treatment. Abbreviations: r+wp= rye + winter pea, r+wp+ra= rye+winter pea+radish, con= control 0 5 10 15 20 25 11 13 16 18 20 23 25 30 37 Num be r o f l ea ve s
Days After Planting
Common Waterhemp Leaf Counts
fresh rye leached rye leachate rye fresh r+wp leached r+wp leachate r+wp fresh r+wp+ra leached r+wp+ra leachate r+wp+ra con
Figure 4. Emergence of common waterhemp throughout the greenhouse study based on applications of fresh residue, dried residue, and leachate.
0 2 4 6 8 10 12 11 13 16 18 20 23 25 30 37 42 Nu mb er o f P lan ts E me rg ed
Days After Planting
Common Waterhemp Emergence
Figure 5. Height of common waterhemp throughout the greenhouse study based on applications of fresh residue, dried residue, and leachate.
0 5 10 15 20 25 30 35 40 11 13 16 18 20 23 25 30 37 42 He igh t ( cm )
Days After Planting
Common Waterhemp Height
Figure 6. Leaf counts of common waterhemp throughout the greenhouse study based on applications of fresh residue, dried residue, and leachate.
0 2 4 6 8 10 12 14 16 18 20 11 13 16 18 20 23 25 30 37 Nu mb er o f L ea ves
Days After Planting
Common Waterhemp Leaf Counts
Figure 7. Total emergence at harvest of common waterhemp in the greenhouse based on treatment. Abbreviations: r+wp= rye + winter pea, r+wp+ra= rye+winter pea+radish, con= control 0 2 4 6 8 10 12 14 16
fresh rye leached
rye Leachaterye freshr+wp leachedr+wp leachater+wp r+wp+rafresh r+wp+raleached leachater+wp+ra con
Num be r o f P la nts Treatment
Figure 8. Final height at harvest of common waterhemp plants in the greenhouse based on treatment. Abbreviations: r+wp= rye + winter pea, r+wp+ra= rye+winter pea+radish, con= control 0 5 10 15 20 25 30 35 40 45 50
fresh rye leached
rye Leachaterye freshr+wp leachedr+wp leachater+wp r+wp+rafresh r+wp+raleached leachater+wp+ra con
He ig ht (cm ) Treatment
Figure 9. Leaf area index at harvest of common waterhemp plants in the greenhouse based on treatment. Abbreviations: r+wp= rye + winter pea, r+wp+ra= rye+winter pea+radish, con= control 0 1 2 3 4 5 6 7 8
fresh rye leached
rye Leachaterye freshr+wp leachedr+wp leachater+wp r+wp+rafresh r+wp+raleached leachater+wp+ra con
Le af Ar ea ( cm3 ) Treatment
Figure 10. SPAD meter readings at harvest of common waterhemp plants in the greenhouse based on treatment. Abbreviations: r+wp= rye + winter pea, r+wp+ra= rye+winter pea+radish, con= control 0 5 10 15 20 25 30 35 40 45
fresh rye leached
rye Leachaterye freshr+wp leachedr+wp leachater+wp r+wp+rafresh r+wp+raleached leachater+wp+ra con
SP AD re ad in g Treatment
Figure 11. Dry weight 48 hours after harvest of common waterhemp plants in the greenhouse based on treatment. Abbreviations: r+wp= rye + winter pea, r+wp+ra= rye+winter pea+radish, con= control 0 0.5 1 1.5 2 2.5 3 3.5 4
fresh rye leached
rye Leachaterye freshr+wp leachedr+wp leachater+wp r+wp+rafresh r+wp+raleached leachater+wp+ra con
W ei gh t ( g) Treatment
Figure 12. Emergence of large crabgrass plants throughout the greenhouse study based on treatment. Abbreviations: r+wp= rye + winter pea, r+wp+ra= rye+winter pea+radish, con= control 0 2 4 6 8 10 12 14 16 11 13 16 18 20 23 25 30 37 42 Nu mb er o f P lan ts G ermin at ed
Days After Planting
Large Crabgrass Emergence
fresh rye leached rye leachate rye fresh r+wp leached r+wp leachate r+wp fresh r+wp+ra leached r+wp+ra leachate r+wp+ra con
Figure 13. Height of large crabgrass plants throughout the greenhouse study based on treatment. Abbreviations: r+wp= rye + winter pea, r+wp+ra= rye+winter pea+radish, con= control
0 5 10 15 20 25 30 35 40 45 11 13 16 18 20 23 25 30 37 42 He ig ht (cm )
Days After Planting
Large Crabgrass Height
fresh rye leached rye leachate rye fresh r+wp leached r+wp leachate r+wp fresh r+wp+ra leached r+wp+ra leachate r+wp+ra con
Figure 14. Leaf count of large crabgrass plants throughout the greenhouse study based on treatment. Abbreviations: r+wp= rye + winter pea, r+wp+ra= rye+winter pea+radish, con= control 0 2 4 6 8 10 12 11 13 16 18 20 23 25 30 37 Num be r o f L ea ve s
Days After Planting
Large Crabgass Leaf Counts
fresh rye leached rye leachate rye fresh r+wp leached r+wp leachate r+wp fresh r+wp+ra leached r+wp+ra leachate r+wp+ra con
Figure 15. Leaf counts of large crabgrass throughout the greenhouse study based on applications of fresh residue, dried residue, and leachate.
0 1 2 3 4 5 6 7 8 9 11 13 16 18 20 23 25 30 37 Num be r o f L ea ve s
Days After Planting
Large Crabgrass Leaf Counts
Figure 16. Emergence of large crabgrass throughout the greenhouse study based on applications of fresh residue, dried residue, and leachate.
0 2 4 6 8 10 12 11 13 16 18 20 23 25 30 37 42 Nu mb er o f P lan ts G ermin at ed
Days After Planting
Large Crabgrass Emergence
Figure 17. Height of large crabgrass throughout the greenhouse study based on applications of fresh residue, dried residue, and leachate.
0 5 10 15 20 25 30 35 40 45 11 13 16 18 20 23 25 30 37 42 He ig ht (cm )
Days After Planting
Large Crabgrass Height
Figure 18. Total emergence at harvest of large crabgrass plants in the greenhouse based on treatment. Abbreviations: r+wp= rye + winter pea, r+wp+ra= rye+winter pea+radish, con= control 0 2 4 6 8 10 12
fresh rye leached
rye Leachaterye freshr+wp leachedr+wp leachater+wp r+wp+rafresh r+wp+raleached leachater+wp+ra con
Num be r o f P la tns Treatment
Figure 19. Final height at harvest of large crabgrass plants in the greenhouse based on treatment. Abbreviations: r+wp= rye + winter pea, r+wp+ra= rye+winter pea+radish, con= control
0 5 10 15 20 25 30 35 40 45 50
fresh rye leached
rye Leachaterye freshr+wp leachedr+wp leachater+wp r+wp+rafresh r+wp+raleached leachater+wp+ra con
He ig ht (cm ) Treatment
Figure 20. Leaf area index at harvest of large crabgrass plants in the greenhouse based on treatment. Abbreviations: r+wp= rye + winter pea, r+wp+ra= rye+winter pea+radish, con= control 0 2 4 6 8 10 12
fresh rye leached
rye Leachaterye freshr+wp leachedr+wp leachater+wp r+wp+rafresh r+wp+raleached leachater+wp+ra con
Le af Ar ea ( cm3 ) Treatment
Figure 21. SPAD meter readings at harvest of large crabgrass in the greenhouse plants based on treatment. Abbreviations: r+wp= rye + winter pea, r+wp+ra= rye+winter pea+radish, con= control 0 5 10 15 20 25 30 35 40
fresh rye leached
rye Leachaterye freshr+wp leachedr+wp leachater+wp r+wp+rafresh r+wp+raleached leachater+wp+ra con
SP AD re ad in g Treatment
Figure 22. Dry weight 48 hours after harvest of large crabgrass plants in the greenhouse based on treatment. Abbreviations: r+wp= rye + winter pea, r+wp+ra= rye+winter pea+radish, con= control 0 0.5 1 1.5 2 2.5 3
fresh rye leached
rye Leachaterye freshr+wp leachedr+wp leachater+wp r+wp+rafresh r+wp+raleached leachater+wp+ra con
W ei gh t ( g) Treatment
Figure 23. Total emergence at harvest of large crabgrass plants in the growth chamber based on treatment. Abbreviations: r+wp= rye + winter pea, r+wp+ra= rye+winter pea+radish, con= control 0 1 2 3 4 5 6 7
fresh rye leached
rye Leachaterye freshr+wp leachedr+wp leachater+wp r+wp+rafresh r+wp+raleached leachater+wp+ra con
Num be r o f P la nts Treatment
Figure 24. Final height at harvest of large crabgrass plants in the growth chamber based on treatment. Abbreviations: r+wp= rye + winter pea, r+wp+ra= rye+winter pea+radish, con= control 0 1 2 3 4 5 6 7 8
fresh rye leached
rye Leachaterye freshr+wp leachedr+wp leachater+wp r+wp+rafresh r+wp+raleached leachater+wp+ra con
He ig ht (cm ) Treatment
Figure 25. Leaf area index at harvest of large crabgrass plants in the growth chamber based on treatment. Abbreviations: r+wp= rye + winter pea, r+wp+ra= rye+winter pea+radish, con= control 0 0.1 0.2 0.3 0.4 0.5 0.6 0.7 0.8 0.9
fresh rye leached
rye Leachaterye freshr+wp leachedr+wp leachater+wp r+wp+rafresh r+wp+raleached leachater+wp+ra con
Le af A re a Treatment
Figure 26. Dry weight 48 hours after harvest of large crabgrass plants in the growth chamber based on treatment. Abbreviations: r+wp= rye + winter pea, r+wp+ra= rye+winter pea+radish, con= control 0 0.001 0.002 0.003 0.004 0.005 0.006 0.007 0.008 0.009
fresh rye leached
rye Leachaterye freshr+wp leachedr+wp leachater+wp r+wp+rafresh r+wp+raleached leachater+wp+ra con
W ei gh t ( g) Treatment