External Debt, Servicing and Debt Relief Transmissions In
Nigeria
Ekperiware Moses C1* Oladeji Sunday I2
1. RCC Department, National Centre for Technology Management (NACETEM), Obafemi Awolowo
University (OAU), PO box 102, Ile-Ife, Nigeria
2. Economics Department, Obafemi Awolowo University (OAU), PO box 102, Ile-Ife, Nigeria.
* E-mail of the corresponding author: [email protected]
Abstract
The study examined the trend of external debt, debt servicing and debt relief transmissions in the Nigerian economy. The huge for external debt to argument domestic saving to boost investment in developing countries is obvious but more crucial to these variables is tracing out their effects on economic development. Indebted countries as observed even in some case find it difficult to service such debt leading to international concerns to writing off such debts to ameliorate the plight of the citizens. The study used structural VAR to trace out the structural effect of these variables in the Nigerian economy. Also examined was the 2005 external debt relief to Nigeria by the London Paris club through descriptive techniques to illustrate how the relief was channeled down to other macroeconomic variables in the economy.
The descriptive analysis showed that soon after the debt relief, government expenditure on health and education improved. Also the position of the nation foreign exchange appreciated which cumulated to higher economic growth rate in Nigeria. Queuing from the descriptive analysis, the structural VAR result showed a decomposed shock to exchange rate were absorbed by external debt and external debt service after itself. This shows that external debt and debt servicing affects the country’s exchange rate. Decomposed shock from health and education outputs were strongly influenced by external debt servicing. Economic output in Nigeria, apart from itself were largely influenced by EXR (24 percent) followed by HLTH and EXD respectively.
The study concludes that external debt is a crucial variable to developing countries and the trickle-down effect of its components are felt in the Nigerian economy. The study therefore recommends good policies to effectively transmit the gains from external borrowing to boost critical infrastructural deficit in the country.
Keywords: external debt, debt servicing, education, health, exchange rate, debt relief and economic growth.
1. Introduction
Nigeria like other developing countries had faced domestic financial constraint. This constraint has made external borrowing an essential complement to domestic resources for promoting sustainable economic growth among these developing countries. This is possible if the economic benefits from such projects are larger than the interest paid on the debt (Patillo et. al., 2002 and Obadan, 2004). However, excessive external debt more often than not impedes economic growth. The burden of debt on indebted countries has resulted in channeling of funds to debt servicing, instead of allocating resources to crucial developmental projects (Iyoha, 1999 and Amakon, 2003).
Huge debt of less developed countries has led to debt constituting impeding factor to economic development of these countries. They resort to debt restructuring of various kind. Debt restructuring is a process that allows a private or public company – or a sovereign entity – facing cash flow problems and financial distress, to reduce and renegotiate unsustainable debts in order to improve or restore liquidity and rehabilitate so that it can continue its operations.
External debt relief to countries previously servicing their debt is believed to remove the debt overhang problem of indebted countries and create fiscal space in investment for economic growth. This is the tenet of debt relief for highly indebted countries to get back on track in the development process. Creditor nations introduced debt relief/cancellation in 1996 and 1999 to Heavily Indebted Poor Countries (HIPC) as a way of removing the impeding effect of debt burden on economic growth, such as debt overhang. Debt overhang occurs when the stock of external debt in a country exceeds her repayment ability. Here, debt services come in the form of implicit tax, hence discouraging investment and stifling economic growth. This makes it virtually impossible for highly indebted countries to escape poverty (Clements et al. 2005). Thus, external debt forgiveness will encourage investment, economic growth and improve foreign exchange rate in indebted countries (Dobdinga,
However, external debt relief contributing to economic growth is possible if such countries are able to engage in viable economic projects with their new external debt status without falling back to debt crisis. In essence, external debt relief is not automatic but domestic government stimulus is crucial in making such relief to boost economic growth (Dobdinga, 2009; Audu, 2004).
Nigeria’s foreign debt started in 1958 when the nation borrowed $28 million for the construction of railway. In 1987, the financially stressed government borrowed $672 million (N100.8 billion) to further augment available resources. In addition, in 1999, the external debt figure increased to $17 billion (N2.6 trillion), 73.2 percent of which was from the Paris Club. External debt has indeed impeded economic growth and poverty reduction in Nigeria (Iyoha, 1999). As a reaction to this, since 1999, Nigeria began clamoring for external debt relief from the Paris Club (Adesola, 2009; CBN, 2008.
External debt is belief to have a chain effect on macroeconomic performance (Loganathan et al., 2010). And Nigeria achieved the long sought external debt relief from the Paris club in 2005 that agreed to cancel 60% (18 billion US dollar) of the US$30.85 billion owed to its club members. The deal of external debt relief took effect after Nigeria paid 40% (12 billion US dollar) of the debt in July 2005. This debt relief eventually spared the country from the yearly US$2.3 billion (N345 billion) debt service burden. This is potent enough to affect economic growth as government allocation to education and health were mere N82 billion and N56 billion respectively in 2005. The deduction of 30 billion US dollar (N4.5 trillion) from Nigerian external debt profile is expected to induce economic growth.
In 2004, Nigeria’s total external debt stock was at its peak: N4.9 trillion ($32.6 billion). This debt stock has been on the increase above the World Bank debt stock to GDP 40 percent ratio established level before the external debt relief. Nigeria's Debt Management Office (DMO, 2011) reported that Nigeria's external debt rose from N428 billion to N543 billion (US$3.62 billion) and then to N690 billion in 2007, 2009 and 2010 respectively. This is a pointer that the external debt is trending upward (Everest 2011; Xclusivenigeria, 2009; CBN, 2008; Pattillo et al, 2002) (See appendix for table).
The expectation of economic recovery as a result of debt relief cannot be automatic or can even induce further external borrowing if disciplined economic policy action is lacking. This is at the insight that debt relief does not necessarily provide additional resources to recipient countries. When debt cancelation concerns debts not serviced as in most cases, it does not free resources for such debt relief leading to economic growth. Even when debt service payments actually decrease, debt relief has a minimal impact on HIPCs' net resource transfers (Presbitero, 2009). An econometric instrument that can show the channels of economic action like external debt relief and debt servicing on economic variables would be useful in showing the impact of the Nigeria external debt relief of 2005 on economic growth. This study keenly examines the transmission channels of external debt, debt servicing and the external debt relief in Nigeria. This study will proffer an informed advice concerning external debt issues in the country. It will be useful in debt literature, including the technique used in the study.
Table 1: Eligibility for Original (1996) HIPC and the Enhanced (1999) HIPC Initiative
Criteria Ratio 1996 Requirement 1999 Requirement
NPV Debt to Exports 200-250% 150%
NPV Debt to Revenue 280% 250%
Export to GDP 40% 30%
Revenue to GDP 20% 15%
Source: The World Bank Group & Aguirre and Connolly (2005).
HIPC II would provide a large amount of debt relief. In terms of the “debt overhang”, it promised reduction of the “present value” (PV) of HIPCs’ debt by $31 billion for 28 countries. When debt relief is delivered to all 34 countries that are currently believed to be eligible for the initiative, pre-HIPC debt overhang will be reduced by 40 percent. The total amount of debt relief will be $39.4 billion in PV terms. The table below summarizes the 1996 and 1999 criteria for eligibility (Aguirre and Connolly, 2005).
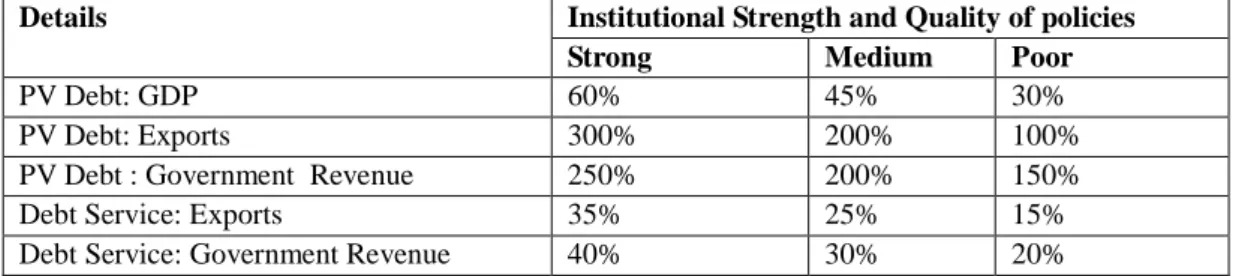
Table 2: Kappagoda and Alexander debt distress thresholds
Details Institutional Strength and Quality of policies
Strong Medium Poor
PV Debt: GDP 60% 45% 30%
PV Debt: Exports 300% 200% 100%
PV Debt : Government Revenue 250% 200% 150%
Debt Service: Exports 35% 25% 15%
Debt Service: Government Revenue 40% 30% 20%
Source: Kappagoda and Alexander (2004)
Based on the joint Bank-IMF low-income country debt sustainability analysis (DSA), Nigeria remained at a low risk of debt distress as at 2012 (IMF, 2013). The threshold for the countries in Nigerian peer group in
International standard in terms of debt to GDP ratio (as at December ending 2013 is about 19.4 per cent) has been changed from 40 to 56 per cent. But Nigeria limits her threshold to using 30 as its own threshold, not that it must reach 30 instead of using 40.
According to Faraji and Makame (2013), Some general thresholds have been considered in the empirical literature for debt ratios under the enhanced HIPC Initiative beyond which a country’s debt might be considered unsustainable. These include NPV Debt-to -Export ≥ 150 per cent, Export-to- GDP ≥ 30 per cent, and Government Revenue-to-GDP ≥15, NPV Debt – to- Government Revenue ≥ 250 per cent, Debt Service-to-Export ≥ 15 per cent and Debt Service-to- Revenue ≥ 25 per cent.
2. LITERATURE REVIEW
The crux of the interest in past studies here is to show how external debt has been relating with economic variables especially output in less developed countries. Abubakar (2012) empirically investigated how external debt relates to economic development of Nigeria from 2000 to 2009. Regression and causality techniques were used in to establish the nature and degree of the relationship between the variables. Life expectancy rate at birth and population of the populace below the poverty line were perceived to improve with external debt borrowing; while unemployment rate was found to reduce from his study, though not significantly. Also, output per capita and literacy rate reduced during external debt overhang.
A possible structural break test of how external debt and external debt servicing relating to economic growth in Nigeria by Ekperiware and Oladeji (2012) revealed that the 2005 external debt relief did cause structural break and reduced the debt burden effect of external borrowing in the economy. Bamidele and Joseph (2013) examined the effect of financial crisis and external debt management on the economic growth of Nigeria. They modeled economic growth as a function of FDI, external debt, external reserve, inflation, and exchange rate as exogenous variables from 1980 to 2010 using CBN data. The econometric techniques of Ordinary Least Square (OLS) and the Granger Causality test were used. The result showed that positive relationships exist between FDI and Economic Growth while inverse relationships exist between External Debt and Economic growth. The findings from the granger causality test show that causality runs from GDP to FDI and external debt engender economic growth in the Nigerian economy
Ogunmuyiwa (2011) asked if external debt promote economic growth in Nigeria using time series from 1970-2007 fitted into a regression equation. He found that causality does not exist between external debt and economic growth as causation between debt and growth was also found to be weak and insignificant in Nigeria. Another study by Osuji and Ozurumba (2013) looked at external debt financing on economic growth in Nigeria using data collected from CBN statistical bulletin 2012 covering 1969-2011. The VEC model estimated showed that London debt financing possessed positive impact on economic growth while Paris debt, Multilateral and Promissory note were inversely related to economic growth in Nigeria.
Michael (2005) examined the impact of the HIPC debt initiative on macroeconomic variables like; openness, exchange rate, terms of trade, real government expenditure, bank credit growth and foreign exchange inflow of Uganda. The empirical analysis revealed that the financial resources made available as a result of the debt relief increased government expenditure and foreign inflows by one percent saw the real exchange rate appreciate by 0.24 and 0.2 percent respectively. Also, 1% appreciation of real exchange rate led to deterioration of non-coffee export performance by 4 percent.
Fosu (2007) examine the impact of a binding external debt-service constraint transmission on sectorial composition of some government expenditures in African economies including Nigeria. He used Seemingly Unrelated Regression (SUR) econometric technique on (1975-94) five-year panel data for 35 countries. Implied debt service burden adversely affects the share of public spending in the social sector, education, health and public investment.
Faraji and Makame (2013) investigated the impact of external debt on economic growth in Tanzania for the period of 1990-2010. The study used time series data on external debt and economic performance and assumed that external debt helps developing countries augment savings in meeting developing needs. The study revealed that there is significant impact of the external debt and debt service on GDP growth. The total external debt stock has a positive effect of about 0.37 and debt service payment has a negative effect of about 28.52. They also found that there was no long-run relationship of the external debt and GDP from the co-integration test.
Other previous studies were of different conclusions. Easterly (1999) and Ben (2010) asserted that new external debts to HIPCs were twice as large as the amount of nominal initial debt relief. Pro external debt relief studies such as Van den Berg (2003), Matthew (2004), Ferede (2005), Addison (2006), Ndangwa (2009), Dobdinga (2009), Bakare (2010) and Dijkstra (2011) found in their studies that external debt relief contributes to development while some other authors like Gianniand Annalisa (2009), Johansson (2008), Victor et al. (2009), Presbitero (2009), Panizza et al. (2009), Panizza et al. (2010) and Omotola and Saliub (2011) found debt relief not to be a sure way to development. This non conclusive trend of impact of external debt, debt servicing,
3. Research Methodology
An empirical illustration to validate how the variables relate empirically is inevitable. Descriptive statistics was used to present the sources and trend of external debt and other economic variables in the economy, while Structural Vector Autoregressive (SVAR) was used to vividly show their transmission relationships in the Nigerian economy.
3.1 Structural Vector Autoregressive (SVAR) Model
To provide answer for the transmissions, SVAR model was used to investigate shock transmission of external debt among variables in the model and provide information on impulse response functions (IRF) and forecast error variance decomposition (FEVD) (Adebiyi, 2009 and Adrangi & Allender 1998). Structural VAR is an extension of the traditional (unstructured) VAR analysis that attempts to identify a set of independent disturbances by means of restrictions provided by economic theory rather than the atheoretic restriction used in traditional VAR (McCoy, 1997). The major strength of this technique over other modeling techniques lies in its ability to capture feedback, shock transmission and speaks economics among variables in an economy concerned or under study (Udoh, 2009).
We consider how external debt (EXD) and external debt service (EXS) and its reduction could transmit through exchange rate (EXR), education (EDU), and health (HLTH) to affect economic growth (GDP) in Nigeria. So, we are looking at six (6) endogenous economic time series and p lags . The endogenous linear equations can be explicitly specified as follows:
……….….(3.1)
where = [EXR, HLTH, EDU, EXS, EXD, GDP]’ is an nx1 dimensional vector of endogenous variables. This
ordering of variables is based on Gottschalk (2001 p. 24) and Bagliano & Favero (1998 p. 1074). The lighter endogenous variables are considered first to freely estimate transmission variables. Ordering and restriction were based on economic correlation and causality test (Hoover, 2004). From equation (3.1), is the deterministic
variable constant and dummy variable. are the parameter matrices of the order n x n dimension,
it represents contemporaneous relations between the components of called coefficient matrix. , called white
noise, is nx1 dimensional vector of structural shocks or innovation in policy and non-policy variables (0, ) with
variance-covariance identity matrix (E I) also presented as in Ogun and Akinlo (2006)
study where is the variance-covariance of . Under the condition that the inverse of the matrix exists, the
can be expressed in a Reduced-Form VAR representation of the as
…………..………..…….(3.2)
where , b= = . Assuming and the covariance of
is, cov( ) represented as Var( )= Var( ) and Σ .
Notice that when a basic VAR model is estimated (equation 3.1), the information about contemporaneous causal dependence is incorporated exclusively in the residuals (being not modeled among the variables). Once the contemporaneous causal structure is identified and recovered, the estimation of the lagged autoregressive coefficients permits us to identify the SVAR model by placing the necessary restriction (Pfaff and Taunus, 2008).
Nesting both the recursive and non-recursive schemes for proper model specification using the traditional Cholesky identification ordering and the alternative to the Cholesky’s (non-recursive scheme) are presented below of equation 3.1 and 3.2 variables in a general equation. Here, all the endogenous and exogenous variables per equation in the system were all nested in the VAR model (Alessio et al 2011).
………(3.3)
The idea of equation (3.3) is to nest both the endogenous and exogenous variables in the system. The A’s and B’s are n x n coefficient matrices and C is the coefficient matrix associated with the possible deterministic terms Dt (Bates and Hachicha, 2009).
Yt = (y1t …ynt)’ is the vector of dependent variables captured as n observable in the model. Xt =
(x1t…xnt)’ is the vector of independent variables as n observable in the model, Dt is the vector of deterministic
variables and captures the disturbance white noise process (0, In).
From equation 3.3, the reduced-form model can be deduced since the inverse of A exists. ………(3.4)
The relationship between the reduced-form VAR residual and the SVAR residual ( ) is called the AB-model and presented below.
=A-1B or can be alternatively written as A = . The variance-covariance matrix can now be
expressed as Σ given that and that (Pfaff and Taunus, 2008).
From the above, the identification problem is solved by imposing restrictions on the A and B matrices
assumed to be nonsingular. When B = In, we have A model as the required restrictions can now be imposed on
the contemporaneous residual of matrix A in the AB-model in the Jmulti software statistic package. A proper
presentation of the contemporaneous residual relationship of the variables (Yt = [EXR, HLTH, EDU, EXS, EXD,
GDP]’ is germane; EXR= .(3.5) HLTH= (3.6) EDU = ..(3.7) EXS= (3.8) EXD= (3.9) GDP= .(3.10)
Presenting the structural equations above in a vector thus
…. (3.11)
The εit are uncorrelated white noise disturbances and their individual coefficients are expressed as hij(k).
Equation (3.13) can be expressed compactly as
………..(3.12)
For instance, represent the impulse response of economic growth shock on external debt if freely
estimated in the SVAR model
Where: Yt = f(EXR, HLTH, EDU, EXS, EXD, GDP ………(3.13)
And = [ ]………. (3.14)
shock are normalized, as thus
( ... (3.15)
4. Presentation of Results and Analysis
4.1. Description of variables
The details of the variables, their description and measurement will be found in section 3.4 of this study. Since the external debt relief of 2005, the Nigerian economy has witnessed though small, but increased external debt. The effect of the relief until 2009 using debt-correlated variables is the arena of this study. The variables of concern in this study include; economic performance proxied as gross domestic products (GDP), exchange rate, Nigeria external debt outstanding, external debt service and human capital output in the form of education and health output in the country.
4.2.Estimation Technique
The methods of analysis used in this study to achieve the broad objective were descriptive and econometric. The methods were sequenced according to the specific objectives. The objective one of examining the trend of external debt in Nigeria was achieved using descriptive statistic methodology. Objective two: to appraise the transmission mechanism between external debt relief and economic growth in Nigeria was achieved through SVAR method. The system bellow is identified with n(n – 1)/2 zero restrictions on A0. An innovation to the
restrictions is that the lower triangular matrix freely estimation was not followed as in the recursive case. This is to allow us to impose restrictions only on relationships which we economically infer a theoretical relation.
………...……(3.20)
The non-recursive restriction above is just identified as the restrictions were based on the stated theoretical understanding of how the variables relate from the literature. The zero (0) elements are restrictions, but the elements marked asterisks (*) are freely estimated elements in the matrix. The economic theoretical understanding in model A is that GDP variable is correlated with all other variables as observed. For instance, there exist both correlation and causality between human capital and GDP (Ogujiuba and Adeniyi, 2006).
4.3.Presentation of Results
The sources and trends of variables would be presented first and analysed to show the direction of these variables in the economy. The SVAR results would be further presented and analysed to reveal the structural transmission of variables in the economy.
4.4.Sources of External Debt in Nigeria.
External debt in Nigeria is obtained from two major sources, namely private external debts and official external debts according to Ekperiware and Oladeji (2012). Private external debt is mostly non-concessional borrowing. On the other hand, the official debts (concessional borrowing) comprise the Paris Club and the multilateral debts owed to regional and international financial institutions such as: the IMF, ADE, EIB and the World Bank etc. Table 3 presents the sources of external debts in Nigeria:
Table 3: Sources of Nigeria External Debt as at 2010 (Creditors)
S/N Official Creditors Official International Multinational Creditors in the Bilateral League
Private Creditors
1 International Fund for Agricultural
Development (IFAD)
Paris Club Creditors Promissory Note
Holders
2 African Development Fund (ADF) Non-Paris Club Creditors London Club Group
3 European Development Fund (EDF)
4 International Bank for Reconstruction and
Development (IBRD)
5 African Development Bank (ADB)
6 Economic Community of West African
State (ECOWAS) Fund
7 European Investment Bank (EIB)
8 Arab Bank for Economic Development
(ABED)
Source: Ekperiware and Oladeji (2012)
Different sources of external debt are believed to have different implications for the borrowing economy and the ability to service these debts in terms of maturity, grace periods and restructuring strategies. For example, the Paris Club external debt relief was only possible because it is a concessional debt.
Figure 1: Trend of Nigeria Concessional and Non-concessional External Debt (%)
Source: Data from CBN, 2010 and computed by author
borrowing. From 1984 to 1997, Nigeria’s external debt from Paris club rose from 43 percent to 70.1 percent. It further increased from 81.9 percent to 85.8 percent between 2002 and 2004. By 2004, the Creditor composition of Nigeria’s external debt with the Paris Club alone was N4.2 trillion or 85.8 percent of total external debt. The strict debt management policy toward concessional borrowing by Debt Management Office (DMO) must be credited for this.
The 2010 DMO annual report and statement of account showed the structure of Nigeria’s external debt in terms of concessional and non-concessional.
Table 4: Concessional/Non-Concessional External Debt (Dec, 2010 in US$ million)
S/N FUNDING SOURCES Amount
Outstanding
Amount Outstanding (% of Total External Debt)
Concessional Creditor Categories
1 International Development Association (IDA) 3,589.81 78.40
2 European Development Fund (EDF) 59.75 1.30
3 European Development Fund (EDF) 116.90 2.55
4 African Development Fund (ADF) 312.08 6.82
5 Islamic Development Bank (IDB) 3.21 0.07
6 Non-Paris Club Bilateral: e.g
Nigerian-Communications-Satellite (NIGCOMSAT) Locomotive Engine (Korea)
163.20 3.56
7 Sub-Total 4,244.96 92.71
Non-Concessional Creditor Categories
1 International Bank for Reconstruction and
Development (IBRD)
35.52 0.78
2 African Development Bank (ADB) 100.48 2.19
3 Non-Paris Commercial: 197.81 4.32
Sub-Total 333.81 7.29
7 Grand Total 4,578.77 100
Source: Ekperiware and Oladeji (2012)
From table 4, leading sources of Nigeria external debt were the International Development Association (IDA), the African Development Fund (ADF) and the Non-Paris Commercial etc. Also, State Governments of Nigeria have over the past engaged in borrowing in developing their states. These are presented below;
Figure 2: Trend of International Financial Inflow to Nigeria
Source: Ekperiware and Oladeji (2012)
As shown in figure 4.2, the value of external debt rose significantly above the value of financial aids from abroad. Before the external debt relief, aids from abroad increased between 2004 and 2005 but soon after the debt relief, the value of aids decreased significantly. More disturbing to the gains from the Paris Club debt relief was that the value of aid from the UK dropped sharply to the zero line. If debt relief would improve economic growth, aid inflow must not drop, but if not, debt relief would just be an accounting exercise Powel (2003).
Figure 3: Trend of Nigeria Debt Service (2005-2012)
Source: Debt Management Office (DMO), 2014
From 2005, the external debt relief caused a significant reduction in external debt servicing in the country.
Figure 4: Debt Sustainability Ratio of Nigeria (2005-2012)
Source: DMO (2014)
Figure 5: Trend of Nigeria Exchange Rate (1982:1-2009:3)
Source: Data from CBN 2010 and computed by author
Nigeria has been experiencing increasing exchange rate fluctuation from 1999 to 2009 except for between 2005 and 2008 when the exchange rate appreciated from N132.15$1 to N118.57 $1. This appreciation of exchange rate is correlated with the external debt relief granted to Nigeria in 2005 and eventually reduced the amount of naira converted to dollar in servicing external debt. This means that the gain from external debt relief to exchange rate was evident only in the short-run.
Figure 6: Nigeria Health and Education Outputs (1981-2009) million Naira.
Source: Ekperiware and Oladeji (2012)
Figure 4.6 shows resource allocation to education and the health sectors before and after the external debt relief. The graph shows that the education output was more robust than the health output and the external debt relief freed resources for education and health sectors. First, the relief created an immediate increase in the health sector and a fall in education but both sectors witnessed an upward trend thereafter.
Figure 7: Nigeria External Debt and External Debt Service (1980-2009) in Naira
Source: Ekperiware and Oladeji (2012)
Especially from the 1990s, external debt significantly trend upward but the debt relief reduced the external debt from about N4.5 trillion to N500 billion in 2005. The fall in external debt and external debt service from 2005 is because of the debt relief.
Figure 8: Trend of Nigeria GDP Growth Rate (1982-2009)
Source: Ekperiware and Oladeji (2012)
From figure 8, the Nigeria growth rate declined further from 1982 to 1984 but increased (though short lived) from 1985 to 1986 which can be attributed to the Structural Adjustment Program (SAP). The collapse of the SAP led to fall in economic growth from 1986 to 1987. However, the economy sprang up since then to positive trend except for in 1994, 1999 and 2002 before the 2005 external debt relief granted to the country. However,
graph showed a stable and small increase during the debt relief in the Nigerian economy. Though, it is too early to pass judgment based on the graph, economic growth increased during the external debt relief period. This means that the external debt relief brought stability and small increase in the growth rate of economic growth in the country.
4.5. Unit Root Rest
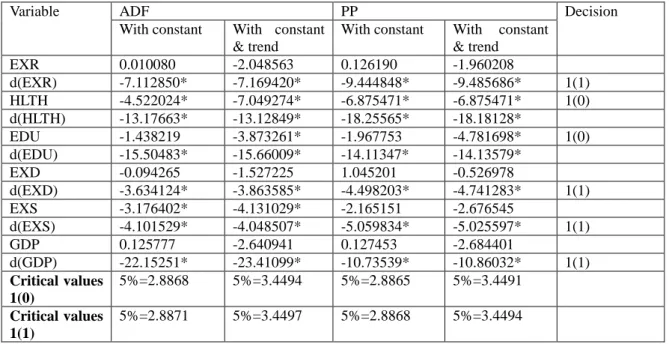
The Augmented Dickey Fuller (ADF) and the Philip Pheron (PP) tests were used to determine the order of integration of the time series used. Table 4.5 illustrates the unit root results and decision on the order of integral.
Table 6:Results of Unit Root Tests
Variable ADF PP Decision
With constant With constant
& trend
With constant With constant
& trend EXR 0.010080 -2.048563 0.126190 -1.960208 d(EXR) -7.112850* -7.169420* -9.444848* -9.485686* 1(1) HLTH -4.522024* -7.049274* -6.875471* -6.875471* 1(0) d(HLTH) -13.17663* -13.12849* -18.25565* -18.18128* EDU -1.438219 -3.873261* -1.967753 -4.781698* 1(0) d(EDU) -15.50483* -15.66009* -14.11347* -14.13579* EXD -0.094265 -1.527225 1.045201 -0.526978 d(EXD) -3.634124* -3.863585* -4.498203* -4.741283* 1(1) EXS -3.176402* -4.131029* -2.165151 -2.676545 d(EXS) -4.101529* -4.048507* -5.059834* -5.025597* 1(1) GDP 0.125777 -2.640941 0.127453 -2.684401 d(GDP) -22.15251* -23.41099* -10.73539* -10.86032* 1(1) Critical values 1(0) 5%=2.8868 5%=3.4494 5%=2.8865 5%=3.4491 Critical values 1(1) 5%=2.8871 5%=3.4497 5%=2.8868 5%=3.4494
Source: Author’s Computation (d is first difference operator, * significant level at 5%).
In table 6, both the Augmented-Dickey-Fuller (ADF) and the Philip-Peron Statistics were used. It was found out that HLTH and EDU were stationary at levels (similar to the descriptive result in table 4.4). EXS was stationary at levels with constant and trend while EXD and GDP were stationary after first difference. The statistical implication of the behaviour of the variables was that most of them were not stationary but have unit root and were made stationary after first differencing them. An innovation to this study was the introduction of bootstrapping. The variables’ residuals were bootstrapped to generate a more normally distributed inference of confidence interval directly constructed from real data sets replicates, using a simple computer algorithm instead of first differencing (Efron and Tibshirani, 1998).
4.6.Identification and Appraisal of Transmission Channels
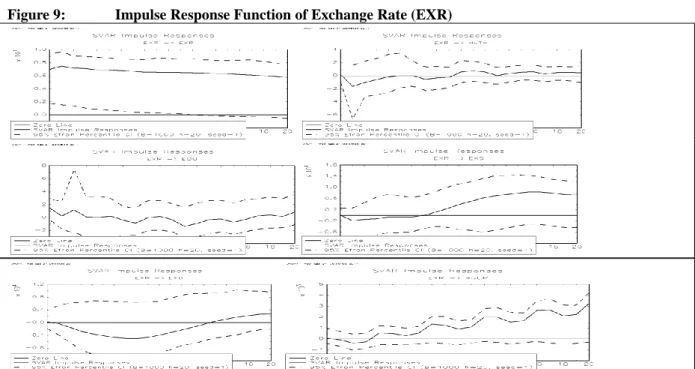
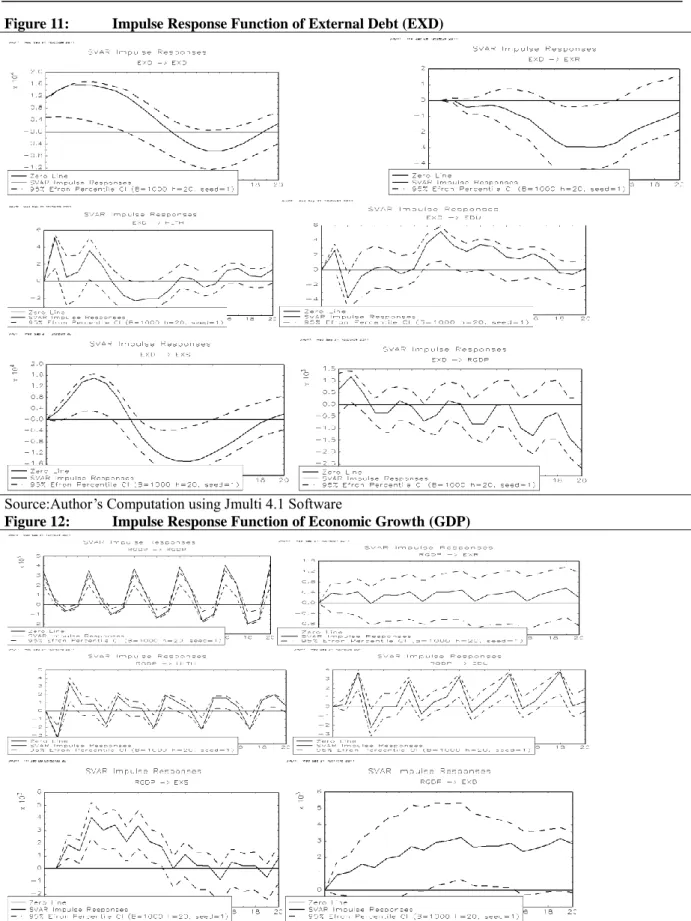
As specified in chapter three 3, innovation to the structural VAR model was used to acquire the impulse response function (IRF) and the forecast error variance decomposition (FEVD) was employed to identify and appraise the channels external debt and debt relief transmission to economic growth in Nigeria. Variables considered in this section are; external debt (EXD), economic growth (GDP), education (EDU), external debt service (EXS) and health (HLTH). For each figure below, the horizontal axis of the IRF showed the number of quarters or point estimates that have passed after the impulse. On the other hand, the vertical axis measured the response of relevant variables.
Figure 9: Impulse Response Function of Exchange Rate (EXR)
Source:Author’s Computation using Jmulti 4.1 Software
Figure 10: Impulse on External Debt Service (EXS)
Figure 11: Impulse Response Function of External Debt (EXD)
Source:Author’s Computation using Jmulti 4.1 Software
Figure 12: Impulse Response Function of Economic Growth (GDP)
Source:Author’s Computation using Jmulti 4.1 Software
4.7.Variance Decomposition Analysis
Forecast error variance decomposition (FEVD) identifies the share of different variables explaining a fluctuation in a given variable in a period of time. The forecast error variance analysis shared light on how much
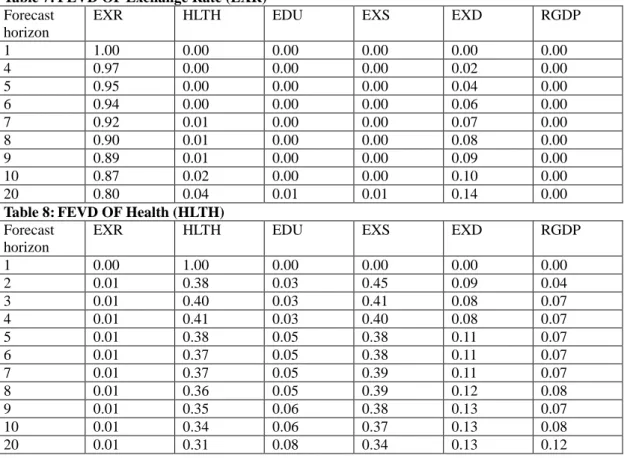
the studied variables contributed in determining or influencing a decomposed variable in the study (Bruce, 2011). The variability of EXR in the short run and long run from table 7 was associated mainly with its own shock (between 100 in the first point estimate to 80 percent). EXD was identified as the second dominant influence in explaining exchange rate variability in the study. External debt explained approximately 14 percent of long run variability of exchange rate. External debt service (EXS) and education (EDU) explained only small (1 percent each) shock on the long run fluctuation in EXR. The identified influence of EXS on EXR is surprisingly small as one would have expected it to explain more of EXR variability especially in the short run. This could mean that EXR in the country is influence by macroeconomic variables like import other than EXS.
The decomposition of HLTH from table 8 was mostly self-explanatory in the short run but was influenced by other variables also in the long run. External debt service shock accounted for 45 percent fluctuation in HLTH output while EXD shocks explained 13 percent fluctuations in HLTH in the long run. GDP fluctuation and EDU shocks also explained 12 percent and 8 percent of long run variability of health output respectively. This shows that EXS, EXD and GDP are identified variables significantly explaining health output fluctuation in Nigeria.
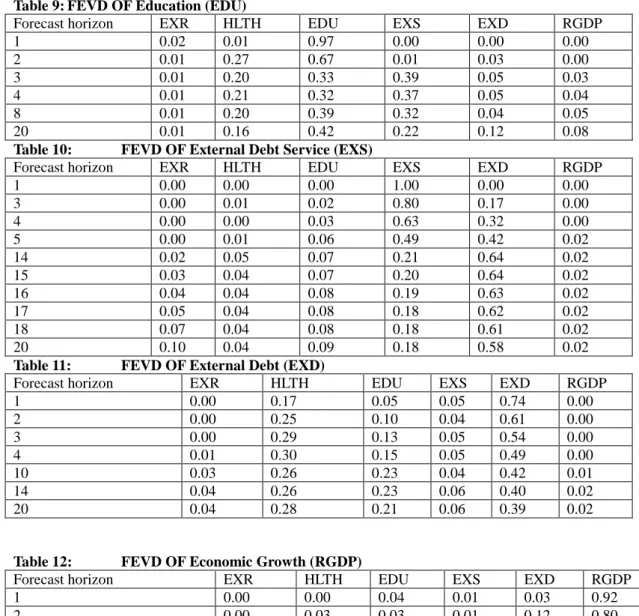
The fluctuations in the education sector in the short run from table 9 were explained mainly by its own self but in the long run its effect decreased. In the long run, EXS explained 22 percent of education variability. Also shock to HLTH and shock EXD caused 16 and 12 percent variations in education output respectively. This revealed that EXS, EXD and HLTH shocks accounted for EDU fluctuation in Nigeria within the study period. The variability of EXS in the short run from table 10 was explained more by its own shock (85 percent) and in the long run it shock only explained 18 percent influence on EXS. But EXD and HLTH explain the long run variation/fluctuation in EXS. Precisely, external debt is identified to explain 49 percent fluctuation of external debt service after one year (5th quarter) and 64 percent in the long run. Education and health sectors were identified to have explained 9% and 4% fluctuation in EXS in Nigeria respectively. External debt (EXD) shock is identified to account for the most external debt service variation in Nigeria. This is in line with other literatures as EXD attracts EXS (Bello, 2000 and Falegan, 1985).
Table 11 explained that fluctuation in the external debt (EXD) in the short run was mainly self-explained (74 percent), however in the long run its effect decreased (39%). The health sector shock explained 17 to 28 percent fluctuation in EXD and the education sector 5 to 23 percent respectively. This revealed that human capital output is identified as significant in explaining external debt of the country in the long run. Shocks to EXS were also able to explain 4 to 6 percent of EXD variability in the economy. Fluctuations in the gross domestic product (GDP) in the short and long runs were predominantly influenced by itself. These shocks explained up to 52 percent in the long run. The second largest identified shock that influenced gross domestic product was EXR (24 percent) followed by HLTH and EXD respectively.
Table 7: FEVD OF Exchange Rate (EXR)
Forecast horizon
EXR HLTH EDU EXS EXD RGDP
1 1.00 0.00 0.00 0.00 0.00 0.00 4 0.97 0.00 0.00 0.00 0.02 0.00 5 0.95 0.00 0.00 0.00 0.04 0.00 6 0.94 0.00 0.00 0.00 0.06 0.00 7 0.92 0.01 0.00 0.00 0.07 0.00 8 0.90 0.01 0.00 0.00 0.08 0.00 9 0.89 0.01 0.00 0.00 0.09 0.00 10 0.87 0.02 0.00 0.00 0.10 0.00 20 0.80 0.04 0.01 0.01 0.14 0.00
Table 8: FEVD OF Health (HLTH)
Forecast horizon
EXR HLTH EDU EXS EXD RGDP
1 0.00 1.00 0.00 0.00 0.00 0.00 2 0.01 0.38 0.03 0.45 0.09 0.04 3 0.01 0.40 0.03 0.41 0.08 0.07 4 0.01 0.41 0.03 0.40 0.08 0.07 5 0.01 0.38 0.05 0.38 0.11 0.07 6 0.01 0.37 0.05 0.38 0.11 0.07 7 0.01 0.37 0.05 0.39 0.11 0.07 8 0.01 0.36 0.05 0.39 0.12 0.08 9 0.01 0.35 0.06 0.38 0.13 0.07 10 0.01 0.34 0.06 0.37 0.13 0.08
Table 9: FEVD OF Education (EDU)
Forecast horizon EXR HLTH EDU EXS EXD RGDP
1 0.02 0.01 0.97 0.00 0.00 0.00 2 0.01 0.27 0.67 0.01 0.03 0.00 3 0.01 0.20 0.33 0.39 0.05 0.03 4 0.01 0.21 0.32 0.37 0.05 0.04 8 0.01 0.20 0.39 0.32 0.04 0.05 20 0.01 0.16 0.42 0.22 0.12 0.08
Table 10: FEVD OF External Debt Service (EXS)
Forecast horizon EXR HLTH EDU EXS EXD RGDP
1 0.00 0.00 0.00 1.00 0.00 0.00 3 0.00 0.01 0.02 0.80 0.17 0.00 4 0.00 0.00 0.03 0.63 0.32 0.00 5 0.00 0.01 0.06 0.49 0.42 0.02 14 0.02 0.05 0.07 0.21 0.64 0.02 15 0.03 0.04 0.07 0.20 0.64 0.02 16 0.04 0.04 0.08 0.19 0.63 0.02 17 0.05 0.04 0.08 0.18 0.62 0.02 18 0.07 0.04 0.08 0.18 0.61 0.02 20 0.10 0.04 0.09 0.18 0.58 0.02
Table 11: FEVD OF External Debt (EXD)
Forecast horizon EXR HLTH EDU EXS EXD RGDP
1 0.00 0.17 0.05 0.05 0.74 0.00 2 0.00 0.25 0.10 0.04 0.61 0.00 3 0.00 0.29 0.13 0.05 0.54 0.00 4 0.01 0.30 0.15 0.05 0.49 0.00 10 0.03 0.26 0.23 0.04 0.42 0.01 14 0.04 0.26 0.23 0.06 0.40 0.02 20 0.04 0.28 0.21 0.06 0.39 0.02
Table 12: FEVD OF Economic Growth (RGDP)
Forecast horizon EXR HLTH EDU EXS EXD RGDP
1 0.00 0.00 0.04 0.01 0.03 0.92 2 0.00 0.03 0.03 0.01 0.12 0.80 3 0.01 0.12 0.03 0.01 0.12 0.71 11 0.08 0.10 0.02 0.08 0.05 0.67 19 0.23 0.08 0.02 0.07 0.04 0.54 20 0.24 0.09 0.03 0.07 0.05 0.52
Source: Author’s Computation
4.8.Simulation Analysis of Impact of External Debt Relief
In order to determine the possible impact the reduction in debt burden could have on the economy, a simulation analysis was carried out for the first quarter of 2010 and a policy scenario. The estimates from Figure 4.12 which depicts the forecast estimates for the first quarter of 2010 (2010:1), showed that exchange rate would increase (depreciate) in 2010 and health output would increase beside a sharp rise during the external debt relief. The 2010 first quarter of education sector would witness increased education output. The forecast of external debt service and external debt in the first quarter of 2010 would witness a rise in external debt and consequent external debt service in the country. However, external debt and external debt service of the country forecast during the external debt relief period showed a drop in both EXD and EXS which witnessed a downward trend. Economic output forecast trend upward during the debt relief but its 2010 first quarter witnessed a fall in economic output. This may be a pointer to the fact that the gains from external debt relief are short lived in the Nigerian economy.
Figure 13: FORECASTING 2010:1 VARIABLES TREND
Source: Author’s Computation using Jmulti 4.1 Software
In summary, the SVAR results showed that EXS fall led to short run appreciation of EXR, EDU and HLTH. Also, external debt shock led to a short run increase in economic output in Nigeria. Human capital in the form of education and health were found to be good intermediate variables between external debt and economic output in Nigeria during the study period.
4.9.Discussion of Findings
The findings showed that Nigeria and most less developed economies now go for concessionary external loans rather than non-concessionary (see figure 1). This may be connected to the fact that concessional loan has soft loan condition and the possibility of debt relief which less developed countries sees as good to argument their local savings’ gap. The external debt and external debt service graphs (see figure 7) showed that the external debt relief brought a significant fall to EXD and EXS in the country. This is expected because the debt reduction of $30 billion from Nigeria external debt is substantial to show in external debt and external debt service trend in the country. Financial aid from the UK and other developed countries dropped significantly (see figure 2). Aid from the UK before the relief trend upward but dropped to the zero line soon after the debt relief. The reduction of financial aid to Nigeria soon after the external debt relief can be connected to the reason that the nation just received debt relief. Powel (2003) stated that for debt relief to impact on economic growth, financial aid should be given beside debt relief for such debt cancellation to significantly impact on less developed countries. However, the graphs of economic growth rate, health and education outputs showed significant improvement in 2005 as a result of the external debt relief. Also the Nigerian exchange rate appreciated during the period (see figure 5). This means that beside the reduction in financial aid to Nigeria during the debt relief, the impact of the debt relief on the economy was still substantial. These changes in 2005 can be attributed to the burden of huge debt servicing taken away by the debt relief. These positions would be further buttressed by the findings from the SVAR empirical results.
The response of external debt (EXD) and external debt service (EXS) to EXR shock shows that a short run depreciation of exchange rate led to a long run increase in EXS first (from the 2nd quarter) and EXD later (from the 6th quarter) in the economy (see figure 9). This identified channel of EXD and EXS transmission in the country can be explained that, depreciation of EXR increases EXS (CBN, 2010) and on the account of EXS default, it would be recapitalised which will eventually increase the EXD of the country. Similarly, Craigs (2011) and the Central Bank of Nigeria (CBN) 2008 annual report identified exchange rate depreciation of the naira as one factor significantly contributing to increased external debt service in the country. From the findings, EXS responded to EXR impulse quicker than EXD and GDP in the economy. However, economic output witnessed a progressive trend after a fall in the 1st to the 3rd quarter to shock on EXR in the country. In summary, the
Nigeria.
External debt service impulse showed own-shock decline after a short run increase in the first quarter. The depreciation of EXR resulting from short run rise in EXS may be because of the pressure of demanding more foreign currency for debt servicing in the country (see figure 10). This position was made clearer when the EXS reduction subsequently led to the appreciation of EXR as shown in Figure 5 and 9 which can be connected with the external debt relief to Nigeria.
The response of EXD to impulse on EXS of short run increase shows that EXD increases as a result of debt servicing, unpaid interest, trade arrears, fines/penalties and recapitalization of debt service default in the country. This position was also stressed by Craigs (2011) and Okonjo-Iweala (AFRODAD, 2007). Servicing debt with foreign currency has long term negative effect on economic growth because this would put pressure on the demand for dollar. Craigs (2011) called it ‘original sin’. The EXS impulse also showed that resources were freed for investment purposes in the economy which were evident in our earlier descriptive graphs. This means that external debt relief which reduces EXS has some contributions to GDP in the country. The FEVD showed that EXD predominantly (64 percent) explained variation in EXS in the country. This is expected, as external debt servicing results from external borrowing and it is a rate on the loan itself by definition.
External debt own-shock showed increase response in the short run (till the 3rd quarter). This could mean that the external debt relief effect of EXD only became evident in the economy after the 3rd quarter (about a year). Exchange rate response to EXD shock witnessed significant improvement of the naira over the dollar and short run increase in health, education and economic outputs in the country (see figure 11). This means that the effect of external debt and debt relief causes economic growth in the short run through human capital and appreciating EXR. As expected, the short run rise in EXD led to increase in EXS, affirming our earlier findings that external debt stock is the most significant factor influencing the size of EXS in the country. This result also affirmed our earlier hunch that EXS does not cause fluctuation on EXD as much as EXD influence EXS in the country. The FEVD decomposition of EXD (Table 6) showed that apart from itself, human capital was the most identified determinant of EXD in the country.
The place of debt relief in the relationship between external debt and economic growth has been contentious (Ekperiware and Oladeji, 2012). Some studies found debt relief to be just an accounting exercise that have a way of increasing again and does not possess any potential of improving economic output through providing resources for economic growth (Ben, 2010 and Presbitero, 2009). However, some reviewed literature did found debt relief to provide resources for investment purposes that will stimulate economic growth in recipient countries (Dijkstra, 2011; Ndangwa; 2009 and Dobdinga, 2009). This country case position is a clear empirical addition to the debt relief literature. The hypothetical tenets of debt relief is not in the act of the cancelation but in the use the equivalent resources are put into that would remove the impeding effect of debt burden and stimulate economic growth. The observed impact of debt relief in the Nigerian economy from the study can be attributed to the resources reallocated to human capital investment purposes as evident from the study in the country.
5. SUMMARY OF FINDINGS
The concept here is that external debt relief would remove the impeding effect of external debt on economic growth through some intermediate variables such as investment in education (EDU) and health (HLTH), better exchange rate (EXR), external debt (EXD) and external debt service (EXS) reductions. Three methodologies (Descriptive statistics, Structural VAR and Chow test,) were used as tool in achieving the objectives of the study. Here the major findings from the study are highlighted.
5.1: Sources of External Debt and Trend of Macroeconomic Variables
(i) The study revealed that Nigeria external debt was more from concessional official source (87.5% in 2005 and 92.7% in 2010) than non-concessional private source (12.5% in 2005 and 7.3% in 2010). Specifically, Paris Club before the external debt relief constituted larger portion (75.3%) of the Nigerian external debt but after the debt relief, multilateral external debt became the major source (92.7%).
(ii) External debt (EXD) and external debt service (EXS) graphs showed that the external debt relief brought a significant fall in EXD and EXS in the country. However, the graph of aid from the UK and other developed countries dropped significantly. Specifically, aid from the UK before the debt relief trend upward but dropped to the zero line soon after the debt relief.
(iii) Economic growth rate, health and education output graphs showed significant upward trend during the
2005 external debt relief. Also, the Nigerian exchange rate (EXR) improved during the period.
5.2: External Debt and Debt Relief Transmission Channels
The findings from Structural VAR impulse response function and variance decomposition used to identify and appraise the channels external debt and debt relief relates to economic growth in Nigeria are
presented below.
(i) The study revealed that a short run depreciation of exchange rate led to a long run increase in EXS first
(from the 2nd quarter) and EXD later (from the 6th quarter) in the economy. This identified channel of EXD and EXS transmission in the country is connected to a depreciation of EXR would increases EXS (CBN, 2010) and on the account of EXS default, it would be recapitalised which will eventually increase the EXD of the country. Similar findings were also reported in the works of Craig (2011) and the Central Bank of Nigeria (CBN) 2008 annual report.
(ii) External debt service responded to EXR shock was quicker than EXD and GDP responses in the
economy. However, GDP witnessed a progressive trend after a fall in the 1st to the 3rd quarter to shock on EXR in the country. In summary, the Nigerian economy from the study is open to EXR shock as it affects EXS, EXD and GDP including human capital variables in Nigeria.
(iii) Short run increased shock of external debt service led to depreciation of EXR because of the pressure of
demanding more foreign currency for debt servicing in the country. Servicing debt with foreign currency has long term negative effect on exchange rate because this would put pressure on the demand for dollar. Craig (2011) called it ‘original sin’. This position was made clearer when the EXS reduction subsequently led to the appreciation of EXR as shown in Figure 4.5 and 4.9 which can be connected with the external debt relief to Nigeria.
(iv) The response of EXD to a short run EXS shock shows an increase in EXD in the country and this increase can be attributed to debt servicing default in the form of unpaid interest, trade arrears, fines/penalties and recapitalization. This position was also stressed by Craigs (2011) and Okonjo-Iweala (AFRODAD, 2007).
(v) The external debt service shock also showed that resources were freed for investment purposes in the
economy which were apparent in Figure 4.6 and Table 4.7. This finding revealed that external debt relief which reduces EXS increased investment in human capital in the country.
(vi) The forecast error variance decomposition (FEVD) revealed that EXD predominantly (64 percent)
explained variation in EXS in the country. This is expected, as external debt servicing results from external borrowing and it is a rate on the loan itself by definition. The external debt relief effect of EXD only became evident in the economy after the 3rd quarter (about a year), as external debt own-shock showed a lag up the 3rd quarter.
(vii) Exchange rate response to EXD shock witnessed significant improvement of the naira over the dollar.
Health, education and economic outputs also showed short run increase in the country from an impulse on EXD. This means that the effect of external debt and debt relief causes economic growth in the short run through human capital and appreciating EXR channels in the country. As expected, the short run rise in EXD led to increase in EXS, affirming our earlier findings that external debt stock is the most significant factor influencing the size of EXS in the country. This result also affirmed our earlier hunch that EXD cause fluctuation on EXS more than how EXS influences EXD in the country. The FEVD decomposition of EXD (Table 4.6) showed that apart from itself, human capital was the most identified determinant of EXD in the country.
6. CONCLUSION
The general observation from the study is that Nigeria external debt constitute more of concessional than non-concessional debt. The external debt and external debt service significantly reduced because of the external debt relief in the country. Economic growth rate, health and education output significantly trend upward during the 2005 external debt relief. Also, the Nigerian exchange rate improved during the period. Exchange rate, health and education were observed transmission channels of how external debt, external debt relief affect economic growth in Nigeria.
7. POLICY RECOMMENDATION
Debt relief has acted as a powerful tool in curbing external debts, external debt services and releasing resources to alleviate poverty and boost growth. This, however, has to be sustained and supported by external and domestic policies with a genuine commitment from the developed community to reshaping developing countries in areas of financial aid, foreign trade and investment, democratic and institutional reforms for developing countries to have all-inclusive benefits from the external sector.
The trend toward concessional borrowing observed in the study should be encouraged but with a clear cut plan on how to manage such finance and not with the intention of further relief. Loan deal with either London club or other creditors be checked, compared to loan deal with Paris Club which is concessional, in that their debt payment impact negatively on Nigeria economic growth.
The World Bank warning for Nigeria to check her rising domestic debt should be looked into because this could cause harm to the economy. Nigeria’s domestic debt is about $21.8 billion (about N3 trillion) and N542.38billion was used to service 2011 domestic debt. If not check would create another leakage of investment
Fiscal discipline should be encouraged at every level of government and a national policy framework should be put in place to coordinate all borrowing in the country. Most of the increase in external debt consisted of federal ministries and state government loans. There is the need for an institutionalized mechanism for handling the management of a nation's debt. Such an arrangement would allow for the proper collation and documentation of a country’s debts as well as eliminate the need for burdensome reconciliation of accounts whenever disagreements exist between creditors and debtors. Nigeria has set up some institutions; the Virtual Poverty Fund (VPF), Debt Management Office (DMO), Nigerian Extractive Industries Transparency Initiative (NEITI), Economic and Financial Crime Commission (EFCC), etc. The DMO, established in 2000, reduced debt mismanagement and improved documentation rather than fragmented government departments and agencies debt management leading to poor debt co-ordination in the country.
REFERENCE
Abubakar S. (2012), External Debt and Nigerian Economic Development: An Empirical Investigation, Department of Accounting, Ahmadu Bello University, Zaria – Nigeria, Phone+234-803-3860665,
e-mail: [email protected]. www.abu.edu.ng/publications/2012-04-11-161305_1156.docx
Adebiyi M. A. (2009), Inflation Targeting: Can We Establish a Stable and Predictable Relationship between Inflation and Monetary Policy instruments in Nigeria and Ghana? Applied Econometrics & Macroeconometrics Modeling in Nigeria, page 211-240. Ibadan University Press, University of Ibadan, Ibadan Nigeria.
Addison T. (2006), Debt Relief: The development and poverty impact; Swedish Economic Policy Review 13; JEL classification: F41, O16.
Adesola W. A. (2009), Debt Servicing and Economic Growth in Nigeria: An Empirical Investigation. Global Journal of Social Science Vol. 8, No. 2, 2009: 1-11
Adrangi, B. and M. Allender (1998), Budget deficits and Stock Prices: International evidence, journal of economics, 22, (2-3, 57-66
AFRODAD (2007), Nigeria: Foreign Debts, Stolen Wealth, IFIS and the West; A Case Study, African Forum and Network on Debt and Development, 31 Atkinson Drive, Hillside, PO Box CY1517, Causeway, Harare,
Zimbabwe, Telephone 263 4 778531, 778536, E-Mail [email protected], Website:
www.afrodad.org
Aguirre M. S. and Connolly D. M. (2005), the HIPC Initiative and its Effects on the Family; Department of Business and Economics, Catholic University of America
Albert, W., Brian, D. andPalitha, P. (2007), Economic Growth and External Debt Servicing: a Cointegration analysis for the case of Sri Lanka; Indian Journal of Economics and Business.
Alfredo S. (2004), Debt and Economic Growth in Developing and Industrial Countries; Department of Economics, Lund University, P.O. Box 7082, SE-220 07 Lund, Sweden; tel: +46 (0) 73 689 1311,
e-mail: [email protected]; webpage: www.nek.lu.se/nekasc; JEL classification: F34; H63; O10; O40
Amakom, U. S. (2003), Nigeria Public Debt and Economic Growth: An Empirical Assessment of Effects on
Poverty; Research Fellow, E-mail: [email protected], African Institute for Applied Economics
Enugu, Nigeria
Aremo A.G. (2010), Trade Liberalization, Economic Growth and Poverty Levels in Nigeria (1980-2009), Unpublished Ph.D seminar presentation, Obafemi Awolowo Univeristy (OAU), Ile-ife, Osun State, Nigeria
Audu, I. (2004), the Impact of External Dent on Economic Growth and Public Investment: The Case of Nigeria (Abstract).
Bagliano, F. C. and Favero (1998), Measuring Monetary Policy with VAR Model: An Evaluation. European Economic Review 42 (6): p 1069-1112.
Bamidele, T.B. and Joseph A.I. (2013), Financial Crisis and External Debt Management in Nigeria, International Journal of Business and Behavioral Sciences Vol. 3, No.4; April 2013, Department of Economics, Ajayi Crowther University, Oyo, Oyo State, Nigeria. [email protected]
Bakare, A. S. (2010), Debt Forgiveness and its Impact on the Growth of Nigerian Economy: An Empirical Study; Pakistan Journal of Social Sciences, Volume: 7 Issue: 2 Page No.: 34-39, DOI: 10.3923/pjssci.2010.34.39, The Open Economics Journal, 2009, 2, 1-9 1
Bates S. and Hachicha A. (2009), Empirical Analysis of Monetary Transmission in Tunisia: What do SVAR Models Tell Us? 1874-9194/09 2009 Bentham Open Access, SDFi Universite Paris-Dauphine, Place Maréchal De Lattre de Tassigny, 75016 Paris, France
Bello, A. A., (2000), External Debt, Investment and Economic Growth in Nigeria, unpublished thesis work, Obafemi Awolowo university (OAU) Ile-Ife, Nigeria.
Ben, L. (2010), The Legacy of the Jubilee Debt Relief Movement: Agreements, Lessons, and Remaining
Challenges; center for global development essay www.cgdev.org;
www.cgdev.org/content/publications/detail/1424540
Benkwitz A, Lütkepohl H, Wolters J. (2001), Comparison of bootstrap confidence intervals for impulse responses of German monetary systems. Macro Dynam 2001; 5: 81-100.
Bhanumurthy N.R., Bose S. and Panda S (2014), Modeling India’s External Sector: Review and Some Empirics, http://www.nipfp.org.in National Institute of Public Finance and Policy New Delhi
Bruce E. H. (2011), ECONOMETRICS, University of Wisconsin, www.ssc.wisc.edu/~bhansen, This Revision:
January 13, 2011, pg. 231
CBN (2010), Statistical Bulletin, Statistical Department, Central Bank of Nigeria, P.M.B. 0187, Garki, Abuja. CBN (2008), Statistical Bulletin, Golden Jubilee Edition, Statistical Department, Central Bank of Nigeria, P.M.B.
0187, Garki, Abuja.
CBN, (2004), Major Economic, Financial and Banking Indicators; Research department, Central Bank of Nigeria, Abuja, the Liaison Office in Lagos and the Regional Offices in Bauchi, Enugu, Ibadan, and Kano. Clements, B., Bhattacharya, R., Quoc Nguyen, T. (2005), Can Debt Relief Boast Growth in Poor Countries?
International Monetary Fund (IMF), Economic Issues, (34), Washington DC, IMF.
Craig K. E. (2011), The Depreciating Dollar: Economic Effects and Policy Response, Specialist in Macroeconomic Policy.
Debt Management Office (DMO) (2009), Annual Report and Statement of Account, Abuja Debt Management Office (DMO) (2006), Annual Report and Statement of Accounts, Abuja.
Dijkstra G. (2011), What did 18 billion dollar achieve? The 2005 debt relief to Nigeria, Paper presented to the Annual Conference of the Centre for the Study of African Economies (CSAE) Oxford, 20-22 March 2011 Associate Professor Economics Programme of Public Administration, Erasmus University
Rotterdam PO Box 1738 3000, DR Rotterdam The Netherlands, [email protected]
Dina, A. M. R. (2010),A Study of the Major Constraints on Egyptian Economic Growth During the Period 1998-2008; A Comparison with Malaysia; Associate professor of Economics, Faculty of Commerce, Shams University, Cairo, Egypt,[email protected]
Dobdinga, C. F. (2009), Debt Relief Incentives in Highly Indebted Poor Countries (HIPC): An Empirical Assessment, International Atlantic Economic Society.
Efron, B. and Tibshirani, R. J. (1993), An Introduction to the Bootstrap, Monographs on Statistics and Applied Probability 57, Department of Preventative Medicine and Biostatistics and Department of Statistics, University of Toronto page 88 and 111.
Easterly, W. (1999), How did heavily indebted poor countries become heavily indebted? Reviewing two decades of debt relief.World Development.
Ekperiware M. C. and Oladeji S.I. (2012), External Debt Relief and Economic Growth in Nigeria, American Journal of Economics 2012, 2(7): 195-205, DOI: 10.5923/j.economics.20120207.05
Everest, A. (2011), Nigeria’s Total Debt Now $34.6 billion; from Debt Management Office (DMO), the Punch newspaper, Vol. 17 No. 20,805 www.punchontheweb.com, (01/26/2011) Abuja, Nigeria.
Falegan, S.B. (1985), Nigeria’s External Debt Burden. Fountain Publications, Ibadan, Nigeria.
Faraji K. and Makame A.S. (2013), Impact of External Debt on Economic Growth: A Case Study of Tanzania, Advances in Management & Applied Economics, vol. 3, no.4, 2013, 59-82 ISSN: 1792-7544 (print version), 1792-7552(online) Scienpress Ltd,
Ferede, E. A., (2005), External public debt, economic growth, and welfare gains from debt relief for HIPCs; University of Alberta, 188 pages; NR08638
Fosu A.K. (2007), The external debt-servicing constraint and public expenditure composition: Evidence from African economies, Research Paper, UNU-WIDER, United Nations University (UNU) 2007/36, http://www.econstor.eu/handle/10419/63373
Gianni V. and Annalisa P. (2009), On the Sustainability of External Debt: Is Debt Relief Enough? University of Pavia and OECD version.
Gottschalk J. (2001), An Introduction into the SVAR Methodology: Identification, Interpretation and Limitations of SVAR Models, Kiel Institute of World Economics, Duesternbrooker weg 120 24105 Kiel,
[email protected], (Germany)
Gujarati, N. D. and Sangeetha (2007), Basic Econometrics 4/e, The McGraw-Hill companies, Special India edition page 304-331, 278.
Hall P. (1992), The bootstrap and Edgeworth expansion. New York, USA: Springer-Verlag
Hansen H. (2001), the Impact of Aid and External Debt on Growth and Investment Insights from Cross-Country Regression Analysis; WIDER Development Conference on Debt Relief, Helsinki, 17-18 August Hepp R. (2005a), Health Expenditures under the HIPC Debt Initiative, University of California, Davis
Hoover K. D. (2004), Automatic Inference of the Contemporaneous Causal Order of a System of Equations; Department of Economics, University of California, E-mail [email protected]
Imed D. and Sami N. (2007), Public External Debt, Informality and Production Efficiency in Developing Countries; UNU-WIDER and LEGI-EPT & IHEC Sousse; JEL Classification: F34, O17, O40
IMF (International Monetary Fund) (2003), “Debt Relief under the Heavily Indebted Poor Countries Initiative: A factsheet”.
IMF (International Monetary Fund) (2003), External Debt Statistics: Guide for Compilers and Users. Washington DC.
IMF (2013), Nigeria Staff Report for the 2012 Article iv Consultation—Debt Sustainability Analysis, Approved By Seán Nolan and Martin Mühleisen (IMF) and Jeffrey D. Lewis and Marcelo, https://www.imf.org/external/pubs/ft/dsa/pdf/2013/dsacr13116.pdf
Iyoha, M. A. (2000). “The impact of external debt reduction on economic growth in Nigeria: Some simulation results”. Nigerian Journal of Economic and Social Studies, vol. 42, no. 2
Iyoha, A. M. (1999), External debt and economic growth in sub-Saharan African countries: An econometric study, Department of Economics ad Statistics, University of Benin, Benin City Nigeria, AERC Research Paper 90 African Economic Research Consortium, Nairobi.
Iyoha, M.A. (1997), “An Econometric Study of Debt Overhang, Debt Reduction, Investment and Economic Growth in Nigeria” Ibadan, National Centre for Economic Management and Administration (NCEMA), Monograph Series No. 8
Johansson P. (2008), Debt Relief, Investment and Growth, JEL classification: F34; F35; O11; O16, Lund University, Department of Economics, P.O. Box 7082, SE-220 07 Lund, Sweden; E-mail: [email protected]
Kappagoda and N. C. Alexander, Debt Sustainability Framework for Low Income Countries: Policy and Resource Implications, Paper Submitted for the G-24 Technicl Group Meeting, Washington, D.C., September 27-28 (2004). Avaialble at:
Koeda J. (2006), A Debt Overhang Model for Low-Income Countries: Implications for Debt Relief; International
Monetary Fund WP/06/224, IMF Working Paper, Finance Department,E-Mail Address: [email protected],
JEL Classification Numbers:E21, F34, F35, F43, O16, O21
Loganathan N., Muhammad N. S and Sanusi N. A (2010), External Debt and Macroeconomics Performance in Malaysia: Sustainable or Not? Global Economy and Finance Journal Volume 3, Number 2. Pp. 122 – 132.
Lǘtkepohl, Helmut, (2005), New Introduction to Multiple Time Series Analysis
Matthew, M. (2004), Debt Relief and Poverty Reduction: Do We Need a HIPC iii? African Report: Assessing the New Partnership.
McCoy D. (1997), How Useful is Structural VAR Analysis for Irish Economics? Economic Analysis, Research and Publications Department, Central Bank of Ireland, P.O. Box 559, Dublin 2.
Michael A. (2005), Impact of the HIPC Debt Initiative on Macroeconomic Variables: the case of Uganda, Bank
of Uganda, [email protected],
http://www.cgdev.org/doc/event%20docs/10.23.03%20GDN%20Conf/Atingi-Ego%20-%20Impact%20of%20HIPC%20debt%20initiative%20Case%20of%20Uganda.pdf
Moss T. (2006), Will Debt Relief Make a Difference? Impact and Expectations of the Multilateral Debt Relief Initiative; Centre for Global development; Working Paper Number 88
Ndangwa, N. (2009), Deriving maximum social benefits from debt relief: A case of ZambiaViewpoint, Social Policy Unit of the National Department of Social Development, Tshwane, South Africa
Nikolaus A. Siegfried (2002), An Information-theoretic Extension to Structural VAR Modelling, Hamburg University, Department of Economics Germany
Obadan, M. I. (2004), Foreign Capital Flows and External Debt, Perspectives on Nigeria and the LDCs Group.National Centre for Economic Management and Administration (NCEMA) Ibadan, Nigeria. Ogujiuba, K. K. and Adeniyi, A. O. (2006), Economic Growth and Human Capital Development: The Case of
Nigeria; [email protected]; +234 08037882841;
Ogun, T. P. (2010), Infrastructure and Poverty Reduction: Implications for Urban Development in Nigeria; Dept of Economics, Obafemi Awolowo University, Ile-Ife, Nigeria. [email protected]
Ogun, T. P. and Akinlo, A. E. (2006), The Effectiveness of Bank Credit Channel of Monetary Policy Transmission: the Nigerian Experience; Obafemi Awolowo University, Nigeria. African Economic and Business Review Vol. 8, No. 2, Fall 2010, ISSN 1109-5609, African Education and Business Research Institute, Inc.
Ogunmuyiwa M.S. (2011), Does External Debt Promote Economic Growth in Nigeria? Current Research Journal of Economic Theory 3(1): 29-35, 2011, ISSN: 2042-485X, © Maxwell Scientific Organization, 2011, Department of Economics, Olabisi Onabanjo University, P.M.B. 2002, Ago-Iwoye, Ogun State, Nigeria