Psychological Motivated Multi-Stage Emotion
Classification Exploiting Voice Quality Features
Marko Lugger and Bin Yang
University of Stuttgart
Germany
1. Introduction
Paralinguistic properties play a more and more decisive role in recent speech processing systems like automatic speech recognition (ASR) or natural text-to-speech systems (TTS). Besides the linguistic information, the so called paralinguistic properties can help solving ambiguities in man-machine-interaction. Nowadays, such man-machine-interfaces can be found for example in call-centers, in driver assistance systems, or at the personal computer at home. There are many different applications for the recognition of paralinguistic properties, e.g. gender, age, voice quality, emotion, or alcohol consumption. Among these properties, the emotional state of a speaker has a superior position because it strongly affects the acoustic signal produced by the speaker in all kind of conversational speech. Emotion recognition has its applications in various fields e.g. in call centers to detect angry customers, in entertainment electronics, in linguistics, and even in politics to analyse speeches of politicians to train the candidates for election campaigns.
Various attempts show quite good results in the case of speaker dependent classification (Lugger & Yang, 2006; McGilloway et al., 2000; Nogueiras et al., 2001). But the hardest task and also the most relevant in practice is the speaker independent emotion recognition. Speaker independent means that the speaker of the classified utterances is not included in the training database of the system. He is unknown for the classifier and the deduced learning rules in the training phase. Up to now, a good speaker independent emotion recognition could only be achieved by using very large feature sets in combination with very complex classifiers (Schuller et al., 2006; Lee & Narayanan, 2005). In (Schuller et al., 2006), an average recognition rate of 86.7% was achieved for seven emotions by using 4000 features and support vector machine as classifier.
In this work, our goal is to further improve the classification performance of the speaker independent emotion recognition and make it more applicable for real-time systems. Therefore, we use the same German database consisting of 6 basic emotions: sadness, boredom, neutral, anxiety, happiness, and anger. For lack of relevance disgust is ignored. But in contrast to other approaches, we focus on the extraction of less but more adapted features for emotion recognition. Because for real-time systems the feature extraction is the most time consuming part in the whole process chain, we try to reduce the number of features. At the same time we study multi-stage classifiers to optimally adjust the reduced feature number to the different class discriminations during classification. In comparison to support vector machines or neural networks, the Bayesian classifier we use can be
Open
Access
Database
www.intechweb.org
implemented on processors with lower computational power. By using only 346 features and a multi-stage Bayesian classifier, we achieve improved results by dramatically reducing computational complexity.
We improve the speaker independent emotion recognition in two ways. First, we propose a novel voice quality parameter set. It is an extension of the parameter set reported in (Lugger et al., 2006). We observed that one can exploit the existence of different phonation types within the human speech production for emotion classification. In our study, we show that our voice quality parameters outperform mel frequency cepstral coefficients in the application of emotion recognition. We further investigate how prosodic and voice quality features overlap or complement each other. Second, our observation that the optimal feature set strongly depends on the emotions to be classified, leads to a hierarchical emotion classification strategy. The best results are achieved by a classification that is motivated by the psychological model of emotion dimensions. After activation recognition in the first stage, we classify the potency and evaluation dimension in following classification stages. A 2-stage and a 3-stage hierarchical classification approach are presented in this article. For each classification, the optimal feature set is selected separately.
This chapter is organized as follows: First, the theory of emotion and the relevance of the database used in this study are discussed in section 2. Then, the relevant acoustic features for different emotion dimensions are introduced in section 3. The performance of the different feature groups is studied and voice quality parameters are compared with mel frequency cepstral coefficients. In section 4, the results of classifying six emotions using different strategies and combinations of feature sets are presented. Finally, some conclusions are drawn.
2. Emotion definitions
Emotion theory has been an important field of research for a long time. Generally, emotions describe subjective feelings in short periods of time that are related to events, persons, or objects. There are different theoretical approaches about the nature and the acquisition of emotions (Cowie and Douglas-Cowie, 2001). Since the emotional state of humans is a highly subjective experience it is very hard to find objective definition or universal terms. That is why there are several approaches to model emotions in the psychological literature (Tischer, 1993). The two most important approaches are the definition of discrete emotion categories, the so called basic emotions, and the utilization of continuous emotion dimensions. These two approaches can also be utilized for the application of automatic emotion recognition. The two models result in different advantages and disadvantages for automatic emotion recognition. The usage of emotion dimensions has the advantage that we can find acoustic features which are directly correlated with certain emotion dimensions. But in listening tests, which are used to obtain a reference for the acoustic data, it is hard for a proband to work with different dimensions. In this case, it is more appropriate to use basic emotions. In the following, the two approaches are briefly explained.
2.1 Categorical emotion approach
Within this approach, the emotional state of a speaker during natural conversation is defined by discrete classes. Ekman defined so called basic emotions (Ekman, 1972). These are happiness, sadness, anger, anxiety, boredom, disgust, and neutral. More detailed emotions can be designed by mixtures of the basic emotions. In our work we use the same
basic emotions as defined by Ekman except for disgust. On the one hand, we benefit from the fact that people are familiar with these terms. But on the other hand, there is also a lack of differentiation possibility. For example there is hot anger and cold anger, or silent sadness and whiny-voiced sadness where the basic emotion model does not distinguish between. Generally, there are no acoustic features that are directly correlated with a single basic emotion.
2.2 Dimensional emotion approach
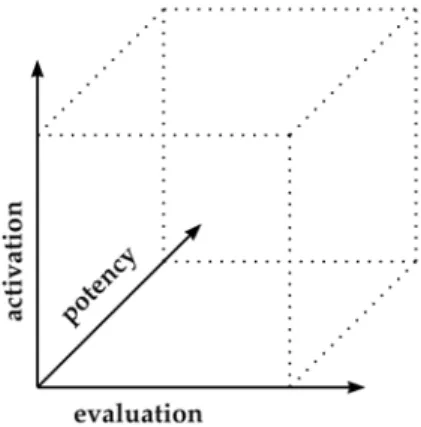
The second approach of psychological emotion research says that we can locate different emotions in a two- or three-dimensional space (Schlosberg, 1954). The most often used dimensions are activation (arousal), potency (power), and evaluation (pleasure), see Figure 1. As we will see below, most of the features used in acoustical emotion recognition, mainly prosodic features, describe the activation dimension. This is why emotions which do not obviously differ in the activation dimension can not be well separated by classical acoustic features. These are, for example, anger, happiness, and anxiety with a high activation or neutral, boredom, and sadness with a low activation level. So our task is to find novel acoustic features that describe more the other dimensions, e.g. the evaluation to distinguish between positive and negative emotions and the potency discriminating dominant and submissive emotions.
Fig. 1. Three-dimensional emotional space
2.3 Emotions and voice quality
Besides the standard prosodic aspects, voice quality is an important factor in conveying emotional information (Klasmeyer & Sendlmeier, 2000). That is why voice quality is also called as the 4th dimension of prosody (Campbell & Mokhtari, 2003). Listening tests showed that there is a strong relation between voice quality and emotion perception (Gobl & Ni Chasasaide, 2003; Yanushevskaya et al., 2008). Many speakers express their emotional state by altering their voice quality. This can happen consciously by supporting their affective expression by changing the voice quality from modal to nonmodal. But most of the times it is an unconscious process, where the glottal muscles are influenced by the affective state of the speaker and the glottal phonation process is affected indirectly. The here studied emotions differ considerably in the utilized phonation type. The following relations between emotions and phonation types can be observed: For the production of a sad and disgusted
emotional state, a creaky phonation is often used. Rough voice is usually used to support an angry emotion. The anxious emotion shows sometimes parts of breathy voice. To express happiness as well as the neutral emotional state, the modal voice quality is exclusively used.
2.4 Emotional database
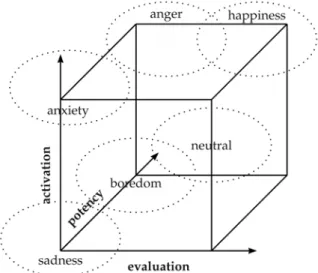
In emotion recognition the used database plays a crucial role. The most important databases are listed in (Ververidis & Kotropoulos, 2003). Thereby, we have to distinguish between three kinds of databases: acted speech, elicited speech, and spontaneous (natural) speech. In this study we used a well known German database of acted speech, called the Berlin emotional database (Burkhardt et al., 2005). It provides short acted utterances approximately between two and five seconds of length. We try to classify six emotions: anger, happiness, sadness, boredom, anxiety, and neutral. There are 694 utterances, which are more than 100 patterns per emotion. We use a combination of both categorical and dimensional emotion definition, by locating 6 basic emotions in a 3-dimensional emotion space. Figure 2 shows the six basic emotions and their location in the three dimensional emotion space.
Fig. 2. 3-dimensional emotion space and 6 basic emotions
3. Acoustic features
Discrete affective states experienced by the speaker are reflected in specific patterns of acoustic cues in the speech (Lewis et al., 2008). This means, information concerning the emotional state of a speaker is encoded in vocal acoustics and subsequently decoded by the receiving listeners. For automatic emotion recognition two basic tasks occur. The first is to find the manner how speaker encode their emotional state in the speech. This problem is basically the extraction of emotion correlated features from the acoustic speech signal. After that, the second task is to solve a pattern recognition problem to decode the emotional state from the extracted speech features. This second problem is discussed in section 4.
In the field of emotion recognition mainly suprasegmental features are used. The most important group is called prosodic features. Sometimes segmental spectral parameters as mel
frequency ceptral coefficients (MFCC) are added. But according to (Nwe et al., 2003), MFCC features achieve poor results for emotion recognition. In our approach, the common prosodic features are combined with a large set of so called voice quality parameters (VQP). Their performance in speaker independent emotion classification is compared with that of MFCC parameters and their contribution in addition to the standard prosodic features is studied.
3.1 Prosodic features
There are three main classes of prosodic features: pitch, energy, and duration. Pitch is describing the intonation of a sentence. The intensity of the uttered words is covered by energy features. Duration stands for the speed of talking and for the number of pauses. Two more classes that do not belong directly to prosody are articulation (formants and bandwidths) and zero crossing rate. These deduced features are obtained by measuring statistical values of their corresponding extracted contours. Mean, median, minimum, maximum, range, and variance are the most used measurements. So they are describing both the mean level and the variability of the basic features. All together we extracted 201 prosodic features from the speech signal.
3.2 Voice quality parameters
As stated in subsection 2.3, phonation is one aspect besides articulation and prosody in generating emotional coloured speech. The theory of voice quality estimation is based on the source filter model of speech production (Fant, 1960). In this model the speech signal is assumed as a source signal produced at the glottis that is filtered by a system defined by the supralaryngeal setting of the vocal tract. Whereas the process at the glottis is called phonation, articulation is the mechanism of producing different sounds by the vocal tract. In contrast to other spectral speech features, the voice quality parameters (VQP) describe basically the properties of the phonation process. By inverse filtering, the influence of articulation is compensated to a great content. Thus, the parameter values specify the phonation type that is used by the speaker. The feature set we use is a parameterization of the voice quality in the frequency domain. We extract various gradients in the excitation spectrum. The method of using spectral gradients was first introduced by Stevens and Hanson (Stevens & Hanson, 1994). The detailed computation is given in the following sections. The definition and the robustness of VQP are also reported in (Lugger et al., 2006). Altogether there are 67 voice quality parameters. As we will see later in section 4, the VQP parameters have an obvious contribution to the discrimination of different emotions beyond the prosodic features.
3.2.1 Measurement of basic speech features
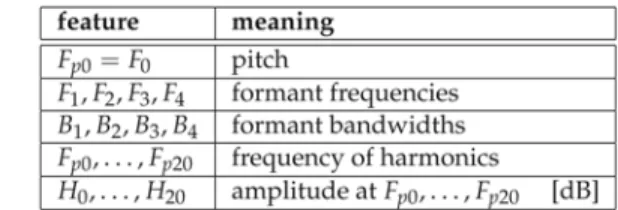
First, we estimate some well known basic speech features from windowed, voiced segments of the speech signal, see Table 1. We perform the voiced-unvoiced decision and the pitch estimate F0 according to the RAPT algorithm (Talkin et al., 1995) that looks for peaks in the
normalized cross correlation function. As measuring points for the spectral gradients, we use higher harmonics. To get a fixed number of 20 gradients for all pitch frequencies, we extract the harmonics Fpk next to fixed frequencies at multiples of 200 Hz. So all together 21 harmonics are used, which cover the relevant frequency range for voice quality up to 4000 Hz. The frequencies and bandwidths of the first four formants are estimated by an LPC analysis (Talkin, 1987).
Table 1. Basic speech features for estimation of spectral gradients
3.2.2 Compensation of the vocal tract influence
Since the voice quality parameters shall only depend on the excitation and not on the articulation process, the influence of the vocal tract has to be compensated. This is done by subtracting terms which represent the vocal tract influence from the amplitudes of each harmonic Hk as described in (Lugger et al., 2006). The amplitudes of the compensated harmonics are H#k.
3.2.3 Estimation of the voice quality parameters
Up to now only 4 spectral gradients were used to characterize the glottal source signal. In order to better parameterize the glottal excitation signal the parameter set is extended to 20 gradients. Figure 3 illustrates the definition of the spectral gradients.
(1) In addition to these 20 gradients normalized to the linear frequency difference Δfk = Fp(k) − Fp0, the same amplitude differences H#0− H#k are also normalized to frequency differences in both octave and in bark scale. Octave is a logarithmic scale
(2) and the bark scale is based on the human auditory system:
(3)
In addition, the four formant bandwidths Bn normalized to the corresponding formant frequencies Fn are calculated.
(4) The last three voice quality parameters describe the voicing, the harmonicity, and the periodicity of the signal, see (Lugger & Yang, 2006). In total, we obtain a set of 67 voice quality features.
3.3 Mel frequency cepstral coefficients
The cepstrum of a signal is the inverse Fourier transform of the logarithm of the Fourier transform. In comparison to the standard cepstrum, MFCC uses frequency bands which are positioned logarithmically based on the mel scale motivated by the human auditory system. MFCC is the state of the art spectral parameter set in automatic speech recognition. According to (Nwe et al., 2003), its performance is, however, not satisfying for emotion recognition. So we want to know whether VQP is a better alternative than MFCC for emotion recognition. For this comparison, we use in our study the mean value as well as the 2nd to the 6th central moments of 13MFCC. The total number of MFCC features is thus 78. The implementation we use was first published in (Orsak & Etter, 1995).
3.4 Feature selection
There are two main reasons for reducing the number of features from the original set. First, the number of training patterns had to be enormous if we want to use all features. Second, the training and classification would take a long time when using the whole feature set. So for all the classifications, the original number of 346 features is reduced by using an iterative selection algorithm. After the selection process the final feature number is reduced to 25 because for this feature number a local maximum in the classification rate was observed. We used the sequential floating forward selection algorithm (SFFS). It is an iterative method to find a subset of features that is near the optimal one. It was first proposed in (Pudil et al., 1994). In each iteration, a new feature is added to the subset of selected features and afterwards the conditionally least significant features are excluded. This process is repeated until the final dimension is obtained. As selection criterion the speaker independent recognition rate is used. In combination with the Bayesian classifier it turns out to be an efficient method for optimizing a feature set to a specific classification problem.
3.5 Comparison of VQP and MFCC
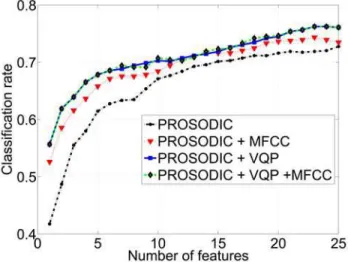
Now the performance of VQP is compared to that of MFCC for the recognition of emotions. Figure 4 shows the average classification rates of six emotions when using prosodic features only and when combining them with MFCC and/or VQP. In each of the four cases, feature sets with increasing number (up to 25) are selected by SFFS. A flat 1-stage classification is used. That means, the discrimination of all 6 emotions is performed by using only one classification. As we see, the classification rate by using additional MFCC is higher than using only prosodic features. But the classification rate when combining prosodic features with VQP outperforms that when combining with MFCC. In comparison to prosodic
features only, a gain of at least 3% is achieved. Adding both VQP and MFCC to prosodic features brings no noticeable improvement.
As we have seen, the voice quality parameters outperform the MFCC for emotion recognition because they are predestined for the recognition of different voice qualities that are used in emotion production. But two questions arise that we would like to answer in the sequel: Do the voice quality parameters contain some new information that is not included in the prosodic features? And how can we optimally combine both feature types to get the best classification result?
Fig. 4. Comparison between VQP and MFCC
4. Classification
In this section, the relationship between prosodic and voice quality features is studied and different classification strategies using a combined feature set are presented. First, we compare the classification rate of using only prosodic features with that of combining both feature types using a flat 1-stage classifier. Here, the gain of adding voice quality information to the prosodic information is investigated. After that, different strategies to optimally combine the information contained in both feature types are presented: a flat 1-stage classification, a hierarchical 2-1-stage, and a hierarchical 3-1-stage classification.
For all the classifications, a Bayesian classifier is used and the best 25 features are selected using SFFS. The speaker independent classification is performed by a "leaving-one-speaker-out" cross validation. The class-conditional densities are modelled as unimodal Gaussians. By using the Gaussian mixture model (GMM) with a variable number of Gaussians, we could not observe significant changes in the classification rate for this database. Mostly, only one Gaussian per feature and emotion was decided.
In our study, all the classification results are represented by confusion matrices. Every field is associated with a true and an estimated emotion. Thereby, the true emotion is given by the corresponding row. Every column stands for an estimated emotion. So the percentages of correct classification are located on the main diagonal whereas the other elements of the matrix represent the confusions.
4.1 Classification with prosodic features
First of all we classify with prosodic features only. The 201 features were reduced to an optimized set of 25 by using SFFS. The confusion matrix is shown in Table 2. The overall recognition rate of 72.8% is quite good, but there are mainly 3 problematic class pairs. The confusion between anger and happiness is with 26.2% respectively 11.8% unacceptably high. In general, happiness is least classified with a recognition rate of only 57.9%. Furthermore, the confusions between neutral and boredom as well as between happiness and anxiety are also unsatisfying. As we know from Figure 1, these emotions do not differ in the activation dimension and so prosodic features are not appropriate to distinguish between them.
Table 2. Classification with prosodic features only
On the other hand, the classification rate of angry, bored, and sad is quite good with 80.2%, 79.3%, respectively 73.4%. The reason is that in this database sadness is spoken very slowly and also with long pauses. On the opposite side, angry sentences are spoken very fast. Hence, duration features, one group of prosodic features, are well suitable to recognize sad and angry utterances. In German, boredom is realized with a very distinctive intonation contour. That is why pitch features, another group of prosodic features, can detect bored sentences very well. In general, we can state that by using prosodic features, the discrimination between high and low activation emotions is very good. The highest confusion between these two activation levels is only 7.8% (neutral vs. happy).
4.2 Classification with combined feature sets
Below, we classify with both prosodic and voice quality features. The result shown in Table 3 is the classification rate we would obtain by an ideal combination of a single prosodic and a single voice quality classifier. The prosodic classifier uses the best 25 prosodic features selected by SFFS and the voice quality classifier uses the best 25 voice quality parameters. P
stands for the event “correctly classified by prosodic features” and V stands for the event “correctly classified by voice quality parameters”. The second row in Table 3 shows the rate of patterns that are classified correctly by both classifiers. For the emotions happiness, boredom, and neutral the correctly classified patterns are quite disjoint, while for sadness, anger, and anxiety they are strongly overlapping. The third and fourth row show the patterns that are correctly classified by prosodic features but not by voice quality parameters and vice versa. In general, the prosodic classifier performs better. But for all the emotions except for boredom the voice quality classifier contributes to an improvement of more than 10%. Interestingly, for sadness and anxiety the voice quality classifier even outperforms the prosodic one. In the last row of Table 3 the overall classification rate for P OR V is given. This implies that we would have complete knowledge of which classifier performs correctly for every single given pattern. We only get a misclassification when both classifiers are
wrong. One can interpret this as a reference value for the classification rate with both feature sets. The result corresponds to an overall recognition rate of 86.2% that is at the level of human recognition rate. Clearly, the voice quality features improve considerably the classification beyond the prosodic information. The gain is biggest for the classes sadness and anxiety that make use of the nonmodal voice qualities creaky respectively breathy voice.
Table 3. Reference value for the classification rate with prosodic and voice quality features In practice we do not know which classifier performs correctly for every single pattern. So we have to define a general fusion method for all the patterns. In the following different strategies for the combination of prosodic and voice quality features are proposed. We will see that we can even exceed the reference value of 86.2% by a deliberate design of our classifier.
4.3 1-stage classification
In Table 4, the results using the best 25 features out of all (prosodic and voice quality features) are shown. Here, the features are jointly selected by SFFS. Among them, there are 18 prosodic and 7 voice quality features. With an overall recognition rate of 75.5%, this approach outperforms the results of Table 2. In general, the result is slightly better than using only prosodic features. But with this direct classification we are not able to exploit all the information that is contained in both feature sets, when we compare with Table 3. Only sadness and anxiety are distinctly improved by 9.1% respectively 11.5% To further benefit from the voice quality information we apply multi-stage classifications in the next sections.
Table 4. Classification with 18 prosodic and 7 voice quality features jointly selected by SFFS
4.4 Psychological motivated multi-stage classification
The main drawback of the previous approaches is that we do not consider which feature group classifies well for which emotions. Our investigation in (Lugger & Yang, 2007a) showed that the optimal feature set strongly depends on the emotions to be separated. This means, using one global feature set for the discrimination of all emotions is clearly suboptimal. This conclusion motivates a hierarchical classification strategy, consisting of different classification stages distinguishing different classes, and using different feature sets
(Lugger & Yang, 2007b). The fundamental observation that prosodic features are very powerful in discriminating different levels of activation and voice quality features perform better in discriminating the other emotion dimensions leads to the following multi-stage strategies. The stages chosen here are motivated by the emotion dimensions of the psychological model shown in Figure 1.
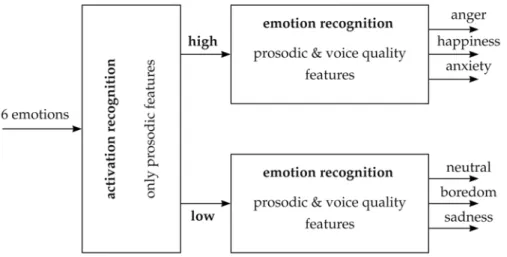
4.4.1 2-stage hierarchical classification
Fig. 5. 2-stage approach of emotion recognition
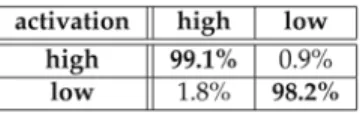
As shown in Figure 5, we separate the classification process in two stages. In the first stage, we classify for two different activation levels. One class including anger, happiness, and anxiety has a high activation level. The second class including neutral, boredom, and sadness has a low activation level. For this activation discrimination we achieve a very good classification rate of 98.8% on average with prosodic features only. Table 5 shows the corresponding confusion matrix. In this stage, we have observed that including voice quality features will not contribute to any improvements.
Table 5. Classification of two activation levels
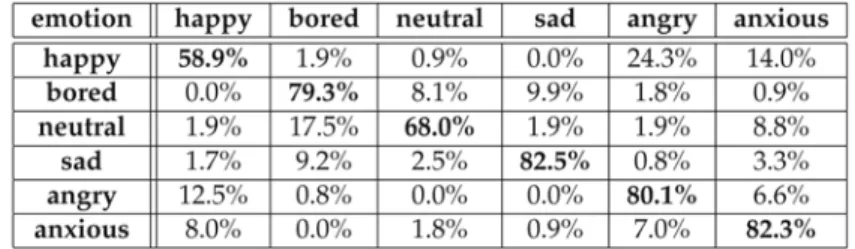
In the second stage, we classify the emotions inside each activation class. That means, all patterns that were classified to high activation in the first stage are classified to anger, happiness, and anxiety. Similarly, all patterns that were decided to have a low activation in the first stage were classified to neutral, boredom, and sadness. For the second stage, 2 instances of the joint SFFS-based combination of prosodic and voice quality features were used. Here, there is a clear advantage of including voice quality features in comparison to prosodic features only. Table 6 shows the classification results for the second stage. Needless to say, the few patterns that were incorrectly classified in the first stage cannot be corrected
in the second stage. By combining both stages in Figure 5, we obtain the overall confusion matrix shown in Table 7.
Table 6. Classification of emotions with high or low activation
Table 7. 2-stage hierarchical classification
Important is the fact that all three subclassifications in Figure 5 are trained separately by using different feature sets. Even the two feature sets used for emotion recognition with a high and a low activation level are different. In each case, the best 25 features were selected using SFFS. With this strategy and by using our new set of voice quality parameters, we achieved an overall classification rate of 83.5%. This is an improvement of another 8.0% compared to direct classification.
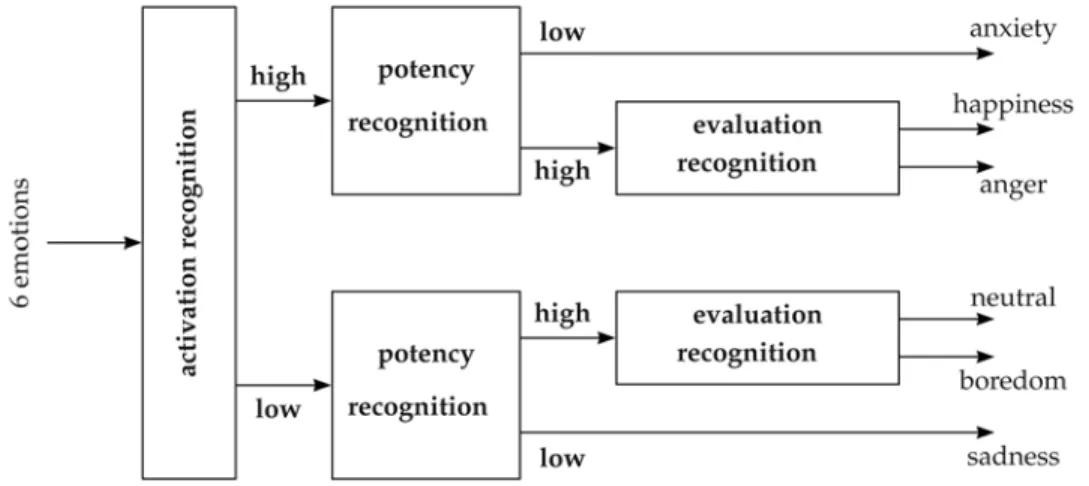
4.4.2 3-stage hierarchical classification
Motivated by the psychological emotion model, we found out that one can further improve the classification results by using only binary subclassifications (Lugger and Yang, 2008). That means, we perform 5 classifications in 3 stages for 6 emotions. Every frame in Figure 6
corresponds to one binary classification whose best 25 features are separately optimized by SFFS. In the first stage, we classify two different activation levels, in analogy to Figure 5. One class including anger, happiness, and anxiety has a high activation level while the second class including neutral, boredom, and sadness has a low activation level. For this activation discrimination, we achieve a very good classification rate of 98.8% on average. Table 8 shows the confusion matrix using 25 features, analog to Table 6.
Table 8. Classification of 2 activation levels
In the second stage, we classify two potency levels within each activation class. That means, all patterns that were classified to high activation in the first stage are classified to one class containing happiness and anger or to a second class containing only anxiety. Similarly, all patterns that were classified to low activation in the first stage are classified to one class containing neutral and boredom or to a second class containing sadness. Table 9 shows the classification results for the second stage. Here, there is a noticeable advantage of including voice quality features.
Table 9. Classification of 2 potency levels
In the third stage, we distinguish between the emotions that differ only in the evaluation dimension: happiness and anger as well as neutral and boredom. The confusion matrix for the third stage is shown in Table 10. Here, for the discrimination of anger and happiness, voice quality parameters bring a large improvement because of the rough voice quality for angry utterances. This 3-stage strategy using an optimized feature set of 25 features leads to the overall confusion matrix shown in Table 11. It corresponds to an overall recognition rate
Table 10. Classification of 2 evaluation levels
of 88.8%. This is an additional improvement of 5.3% in comparison to the 2-stage approach. In particular, the recognition rate of happiness is improved by nearly 15% due to its separately selected feature set containing the so important voice quality information.
5. Conclusion and outlook
5.1 Conclusion
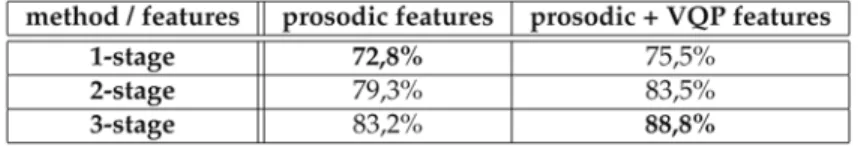
In this study, we presented a novel approach of speaker independent emotion classification. We used a large set of voice quality parameters in addition to standard prosodic features. Altogether we extracted 346 acoustic features from the speech utterances. In all classification studies, we used the SFFS algorithm to reduce the feature number to 25. In a first study, we could show that our voice quality parameters outperform the well known mel frequency cepstral coefficients in the application of speaker independent emotion recognition. Thus, a combined feature set of prosodic and voice quality features led to the best recognition result using an 1-stage classification. Using MFCC and VQP in addition to prosodic features brought no further improvement in classification performance. We further compared a flat 1-stage classification of 6 emotions with a 2-stage respectively 3-stage hierarchical classification approach using only prosodic and a combined feature set. A summary of all the results using the best 25 features is shown in Table 12.
Table 12. Overview of classification strategies
We observed that in general a multi-stage classification performs better than a flat classifier. For the classification of 6 emotions, the best recognition rate could be achieved by using the 3-stage classification consisting of 5 binary subclassifications. This is true for both only prosodic features and the whole feature set. The overall classification rate is raised by 10.4% respectively 13.3% by using the psychological motivated hierarchical classification in comparison to a flat classification. We also showed that parameters of voice quality supply a contribution in addition to the well known prosodic features. They deliver information concerning the different phonation types used by the emotion production of the speaker. This information is not adequately contained in the prosodic features. In the flat classification we could improve the classification rate by 2.7%. Another interesting observation is that the gain of using additional VQP is even higher when using a multi-stage classification. For the 2-stage respectively 3-stage approach, using voice quality features result in a gain of 4.2% respectively 5.6%. With our best method, we achieved an improvement of 16.0% in comparison to a standard flat classification using only prosodic features. This improvement could be even larger by using other emotional databases that make more use of different voice qualities in the production of emotions.
5.2 Outlook
Although all the presented classifications are speaker independent, the results are strongly optimized for the 10 speakers contained in the database. By using the speaker independent classification rate as criterion for the selection algorithm, the features are selected in a way
that is optimizing the classification rate of the unknown speaker. So we can say the classification itself is speaker independent but not the feature selection process. Because of the relatively low number of speakers, the dependency of the results on the speakers is high. That is why an additional study on the robustness of the here presented results is necessary. In this study, the classification data should neither be included in the training data nor in the feature selection process.
Another open question is: How do other multi-stage classification approaches perform? In the pattern recognition literature there exist other multi-stage classification methods as cascaded or parallel classification approaches. Do they significantly differ in the performance? And how about the robustness of these different approaches? Which is the most robust one for speaker independent emotion recognition?
This study is based on a well known German database. We have to mention that the utterances are produced by actors. So the speakers only performed this emotional state in an acoustic manner. They have not necessarily felt this emotion at the moment when they produced the spoken utterance. It would be interesting to test the proposed methods with a more natural database. But larger emotion databases with conversational speech are really rare.
6. References
F. Burkhardt, A. Paeschke, M. Rolfes, and W.F. Sendlmeier. A database of German emotional speech. Proceedings of Interspeech, 2005.
Nick Campbell and Parham Mokhtari. Voice quality: the 4th prosodic dimension. 15th International Congress of Phonetic Sciences, 2003, 2003.
R. Cowie and E. Douglas-Cowie. Emotion recognition in human-computer interaction. IEEE
Signal Processing Magazine, 18(1):32–80, 2001.
P. Ekman. Universal and cultural differences in facial expressions of emotion. Nebraska
Symposium on Motivation, 19:207–283, 1972.
G. Fant. Acoustic theory of speech production. The Hague: Mouton, 1960.
Christer Gobl and Ailbhe Ni Chasasaide. The role of voice quality in communicating emotion, mood and attitude. Speech communication, 40:189–212, 2003.
Gudrun Klasmeyer and Walter F. Sendlmeier. Voice quality measurement, chapter Voice and emotional states, pages 339–357. Singular Publishing group, 2000.
Chul Min Lee and S. Narayanan. Toward detecting emotions in spoken dialogs. Transaction
on speech and audio processing, 13(2):293–303, 2005.
Michael Lewis, Jeannette Haviland-Jones, and Lisa Feldman Barrett, editors. Handbook of
emotions. The Guilford Press, 2008.
Marko Lugger and Bin Yang. Classification of different speaking groups by means of voice quality parameters. ITG-Sprach-Kommunikation, 2006.
Marko Lugger and Bin Yang. An incremental analysis of different feature groups in speaker independent emotion recognition. ICPhS, Saarbrücken, 2007a.
Marko Lugger and Bin Yang. The relevance of voice quality features in speaker independent emotion recognition. ICASSP, Hawaii, USA, 2007b.
Marko Lugger and Bin Yang. Cascaded emotion classification via psychological emotion dimensions using a large set of voice quality parameters. In IEEE ICASSP, Las Vegas, 2008.
Marko Lugger, Bin Yang, and Wolfgang Wokurek. Robust estimation of voice quality parameters under real world disturbances. IEEE ICASSP, 2006.
S. McGilloway, R. Cowie, S. Gielen, M. Westerdijk, and S. Stroeve. Approaching automatic recognition of emotion from voice: A rough benchmark. ISCAWorkshop Speech and
Emotion, pages 737–740, 2000.
A. Nogueiras, A. Morena, A. Bonafonte, and JB. Marino. Speech emotion recognition using hidden Markov models. Eurospeech, pages 2679–2682, 2001.
T. Nwe, S. Foo, and L. De Silva. Speech emotion recognition using hidden Markov models.
Speech communication, 41:603–623, 2003.
G.C. Orsak and D.M. Etter. Collaborative SP education using the internet and matlab. IEEE
Signal processing magazine, 12(6):23–32, 1995.
P. Pudil, F. Ferri, Novovicova J., and J. Kittler. Floating search method for feature selection with nonmonotonic criterion functions. Pattern Recognition, 2:279–283, 1994.
H. Schlosberg. Three dimensions of emotions. Psychological Review, 61:81–88, 1954.
B. Schuller, D. Arsic, F. Wallhoff, and G. Rigoll. Emotion recognition in the noise applying large acoustic feature sets. Speech Prosody, Dresden, 2006.
K. Stevens and H. Hanson. Classification of glottal vibration from acoustic measurements.
Vocal Fold Physiology, pages 147–170, 1994.
D. Talkin, W. Kleijn, and K. Paliwal. A robust algorithm for pitch tracking (RAPT). Speech
Coding and Synthesis, Elsevier, pages 495–518, 1995.
David Talkin. Speech formant trajectory estimation using dynamic programming with modulated transition costs. Technical Report, Bell Labs., 1987.
B. Tischer. Die vokale Kommunikation von Gefühlen, Fortschritte der psychologischen Forschung. Psychologie-Verlag-Union, 1993.
D. Ververidis and C. Kotropoulos. A state of the art review on emotional speech databases.
1st Richmedia conference, pages 109–119, 2003.
Irena Yanushevskaya, Christer Gobl, and Ailbhe Ni Chasaide. Voice quality and loudness in affect perception. Speech prosody, Campinas, 2008.
Edited by France Mihelic and Janez Zibert
ISBN 978-953-7619-29-9 Hard cover, 550 pages Publisher InTech
Published online 01, November, 2008 Published in print edition November, 2008
InTech Europe
University Campus STeP Ri Slavka Krautzeka 83/A 51000 Rijeka, Croatia Phone: +385 (51) 770 447 Fax: +385 (51) 686 166 www.intechopen.com
InTech China
Unit 405, Office Block, Hotel Equatorial Shanghai No.65, Yan An Road (West), Shanghai, 200040, China Phone: +86-21-62489820
Fax: +86-21-62489821
Chapters in the first part of the book cover all the essential speech processing techniques for building robust, automatic speech recognition systems: the representation for speech signals and the methods for speech-features extraction, acoustic and language modeling, efficient algorithms for searching the hypothesis space, and multimodal approaches to speech recognition. The last part of the book is devoted to other speech processing applications that can use the information from automatic speech recognition for speaker
identification and tracking, for prosody modeling in emotion-detection systems and in other speech processing applications that are able to operate in real-world environments, like mobile communication services and smart homes.
How to reference
In order to correctly reference this scholarly work, feel free to copy and paste the following:
Marko Lugger and Bin Yang (2008). Psychological Motivated Multi-Stage Emotion Classification Exploiting Voice Quality Features, Speech Recognition, France Mihelic and Janez Zibert (Ed.), ISBN: 978-953-7619-29-9, InTech, Available from:
http://www.intechopen.com/books/speech_recognition/psychological_motivated_multi-stage_emotion_classification_exploiting_voice_quality_features