University of Central Florida University of Central Florida
STARS
STARS
Electronic Theses and Dissertations, 2004-20192016
Spatial and Temporal Modeling for Human Activity Recognition
Spatial and Temporal Modeling for Human Activity Recognition
from Multimodal Sequential Data
from Multimodal Sequential Data
Jun YeUniversity of Central Florida
Part of the Computer Sciences Commons
Find similar works at: https://stars.library.ucf.edu/etd University of Central Florida Libraries http://library.ucf.edu
This Doctoral Dissertation (Open Access) is brought to you for free and open access by STARS. It has been accepted for inclusion in Electronic Theses and Dissertations, 2004-2019 by an authorized administrator of STARS. For more information, please contact [email protected].
STARS Citation STARS Citation
Ye, Jun, "Spatial and Temporal Modeling for Human Activity Recognition from Multimodal Sequential Data" (2016). Electronic Theses and Dissertations, 2004-2019. 5347.
SPATIAL AND TEMPORAL MODELING FOR HUMAN ACTIVITY RECOGNITION FROM MULTIMODAL SEQUENTIAL DATA
by
JUN YE
B.S. Huazhong University of Science and Technology, 2007 M.S. Beihang University, 2010
A dissertation submitted in partial fulfilment of the requirements for the degree of Doctor of Philosophy
in the Department of Computer Science in the College of Engineering and Computer Science
at the University of Central Florida Orlando, Florida
Fall Term 2016
c
ABSTRACT
Human Activity Recognition (HAR) has been an intense research area for more than a decade. Different sensors, ranging from 2D and 3D cameras to accelerometers, gyroscopes, and magne-tometers, have been employed to generate multimodal signals to detect various human activities. With the advancement of sensing technology and the popularity of mobile devices, depth cam-eras and wearable devices, such as Microsoft Kinect and smart wristbands, open a unprecedented opportunity to solve the challenging HAR problem by learning expressive representations from the multimodal signals recording huge amounts of daily activities which comprise a rich set of categories.
Although competitive performance has been reported, existing methods focus on the statistical or spatial representation of the human activity sequence; while the internal temporal dynamics of the human activity sequence are not sufficiently exploited. As a result, they often face the challenge of recognizing visually similar activities composed of dynamic patterns in different temporal order. In addition, many model-driven methods based on sophisticated features and carefully-designed classifiers are computationally demanding and unable to scale to a large dataset. In this disserta-tion, we propose to address these challenges from three different perspectives; namely, 3D spatial relationship modeling, dynamic temporal quantization, and temporal order encoding.
We propose a novel octree-based algorithm for computing the 3D spatial relationships between objects from a 3D point cloud captured by a Kinect sensor. A set of 26 3D spatial directions are defined to describe the spatial relationship of an object with respect to a reference object. These 3D directions are implemented as a set of spatial operators, such as ”AboveSouthEast” and ”Be-lowNorthWest,” of an event query language to query human activities in an indoor environment; for example, ”A person walks in the hallway from north to south.” The performance is
quanti-tatively evaluated in a public RGBD object dataset and qualiquanti-tatively investigated in a live video computing platform.
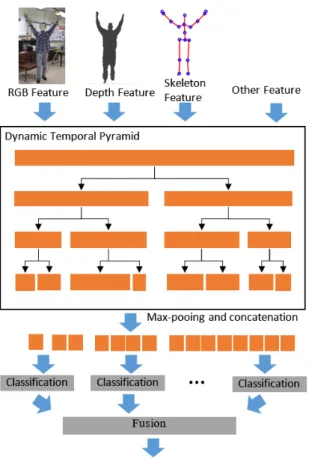
In order to address the challenge of temporal modeling in human action recognition, we introduce the dynamic temporal quantization, a clustering-like algorithm to quantize human action sequences of varied lengths into fixed-size quantized vectors. A two-step optimization algorithm is proposed to jointly optimize the quantization of the original sequence. In the aggregation step, frames falling into the sample segment are aggregated by max-polling and produce the quantized representation of the segment. During the assignment step, frame-segment assignment is updated according to dynamic time warping, while the temporal order of the entire sequence is preserved. The proposed technique is evaluated on three public 3D human action datasets and achieves state-of-the-art per-formance.
Finally, we propose a novel temporal order encoding approach that models the temporal dynamics of the sequential data for human activity recognition. The algorithm encodes the temporal order of the latent patterns extracted by the subspace projection and generates a highly compact First-Take-All (FTA) feature vector representing the entire sequential data. An optimization algorithm is further introduced to learn the optimized projections in order to increase the discriminative power of the FTA feature. The compactness of the FTA feature makes it extremely efficient for human activity recognition with nearest neighbor search based on Hamming distance. Experimental re-sults on two public human activity datasets demonstrate the advantages of the FTA feature over state-of-the-art methods in both accuracy and efficiency.
I dedicate this dissertation to my wife, Xing, for being there whenever I need her, and to my parents, Jiaxiang and Huifang, for their love and support through all the years.
ACKNOWLEDGMENTS
I would like to thank my advisor, Dr. Kien A. Hua for his guidance, support and advice throughout my Ph.D. program at University of Central Florida.
I would also like to thank my dissertation committee members, Dr. Cliff C. Zou, Dr. Hassan Foroosh and Dr. Waldemar Karwowski, for their valuable guidance and suggestions on my disser-tation.
I would like to specially thank Dr. Guo-Jun Qi for his advise and help on our coauthored publica-tions.
I would like to thank all the past and present DSG members, Kai Li, Kutalmis Akpinar, Omar Nakhila, Sansiri Tarnpradab, Naifan Zhuang, Yusuph Turgun, Hao Hu, Liheng Zhang, Dr. Faisal Amjad, Dr. Alex Aved, Affra Attiah, Fereshteh Jafariakinabad, for being good friends and making DSG such an interesting place to work at.
Finally, I am especially grateful to my wife, Xing, and my parents, Jiaxiang and Huifang, for their love and support and for being the most important people in my life.
TABLE OF CONTENTS
LIST OF FIGURES . . . xiii
LIST OF TABLES . . . xvi
CHAPTER 1: INTRODUCTION . . . 1
Problem Statement and Motivation . . . 1
Contributions . . . 2
Organization of the Dissertation . . . 4
CHAPTER 2: LITERATURE REVIEW . . . 5
3D Spatial Relationship Modeling and Human Event Query Processing . . . 5
Human Action Recognition From Videos . . . 8
Wearable Sensor-based Human Activity Recognition . . . 11
Feature Extraction . . . 12
Classification . . . 13
CHAPTER 3: 3D SPATIAL RELATIONSHIP MODELING FOR HUMAN ACTIVITY DE-TECTION . . . 15
Introduction . . . 15
Proposed Solutions . . . 17
Definition of 3D Spatial Relationship . . . 17
3D Object Modeling . . . 18
Cloud-based 3D Object Modeling . . . 18
Otree-based 3D Object Modeling . . . 20
3D Relationship Computation . . . 22
Sampling the Space By Rays . . . 23
Ray-Tracing-Based 3D Direction Computation . . . 24
GPU Implementation . . . 25
Discussion on the Proposed Solutions . . . 25
Performance Studies . . . 27
Experiments on RGBD Image Dataset . . . 27
Validation in the LVDBMS Framework . . . 29
Example 1: Event with One Person and One Static Object . . . 31
Example 2: Cross Camera Event . . . 32
Summary . . . 35
CHAPTER 4: DYNAMIC TEMPORAL QUANTIZATION FOR 3D HUMAN ACTION RECOGNITION . . . 37
Motivation . . . 37
An Overview of the Proposed Techniques . . . 38
Dynamic Temporal Quantization . . . 40
Problem Formulation . . . 40
Optimization and Implementation . . . 41
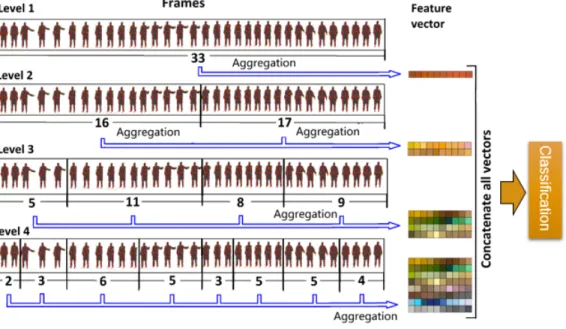
Hierarchical Representation . . . 43
Frame Assignment Sharing Between Multiple Features . . . 44
Performance Studies . . . 45 Experiment Setup . . . 45 MSR-Action3D Dataset . . . 46 MSR-ActionPairs Dataset . . . 50 UTKinect-Action Dataset . . . 53 Summary . . . 54
Introduction . . . 56
Temporal Order Encoding by Expected Moment . . . 60
Latent Patterns . . . 60
Temporal Order Encoding . . . 60
Learning Optimized Projections . . . 65
Problem Formulation and Objective . . . 66
The Optimization Algorithm . . . 67
Complexity Analysis . . . 69
Probabilistic Temporal Order Encoding . . . 70
Probability and Hypothesis . . . 70
Probability First-Take-All and the pFTA feature . . . 73
Optimization for pFTA . . . 74
Problem Formulation and Objective . . . 74
Optimization Algorithm . . . 75
Complexity Analysis . . . 78
Performance Evaluation . . . 80
Experiment settings . . . 82
Results on UCI Daily and Sports Activities . . . 82
Impact of Encoding Scale . . . 83
Impact of Feature Dimension . . . 84
Impact of Rescale Factor . . . 85
Confusion Matrix . . . 86
Compare with State-of-the-art Results . . . 87
Comparison of Computational Cost . . . 88
Results on MSRActionPairs . . . 91
Impact of Encoding Scale . . . 92
Impact of Feature Dimension . . . 94
Impact of Rescale Factor . . . 94
Confusion Matrix . . . 95
Comparison with State-of-the-Art Results . . . 95
Comparison of Computational Cost . . . 100
Summary . . . 101
Conclusion . . . 103
Future Work . . . 104
LIST OF FIGURES
3.1 Extending 2D Directions to 3D Directions . . . 17
3.2 Examples of the Aligned RGB Frame and Depth Frame from the Kinect Sensor 19 3.3 Object Segmentation from the 3D Point Cloud . . . 20
3.4 A Two-level Octree Model . . . 21
3.5 based Modeling. (a) Point Cloud-Based Chair Model, (b) Octree-Based Chair Model, (c) Human in the Depth Image. (d) Octree-Octree-Based Human Model. . . 21
3.6 Uniform Spherical Surface Sampling . . . 23
3.7 The Graphic User Interface of LVDBMS . . . 31
3.8 Key Frames of the Human-centric Events in the Demonstration . . . 36
4.1 The General Framework of the Dynamic Temporal Quantization . . . 39
4.2 Examples of Good and Bad Warping . . . 42
4.3 Illustration of the Dynamic Temporal Quantization with the Hierarchical Rep-resentation . . . 45
4.4 Confusion Matrix of the Classification Results in the MSR-Action3D Dataset 50
5.1 Framework of the Temporal Order Encoding Approach . . . 59
5.2 Examples of the Probability Distribution ofpk,ton Two Different Latent
Pat-terns . . . 63
5.3 Running Examples of Latent Patterns on Two Different Categories of Human
Actions. The left column are from the action “Put up a box”, the right column are from action “put down a box.” Results are from the experiments in the
MSRActionPairs Dataset. . . 64
5.4 Training Loss on a Mini-batch of Pairwise Training Data through Multiple
Epochs of the Optimization. Curve is obtained through the optimization of
one FTA feature dimension in the MSRActionPairs dataset. . . 68
5.5 Training Loss on One pFTA Dimension through Iterations. Mini-batch size
is 256.K = 3.Training process converges after 50 epochs. . . 78
5.6 Impact of the Encoding Scale of FTA and pFTA on the Classification
Accu-racy in the UCI Daily and Sports Activities Dataset . . . 83
5.7 Impact of the Feature Dimension of FTA and pFTA on the Classification
Accuracy in the UCI Daily and Sports Activities Dataset . . . 84
5.8 Impact of the Rescale Factorαof FTA and pFTA on the Classification
Accu-racy in the UCI Daily and Sports Activities Dataset . . . 86
5.9 Impact of the Encoding Scale of FTA and pFTA on Classification Accuracy
5.10 Impact of the Feature Dimension of FTA and pFTA on Classification
Accu-racy in the MSRActionPairs Dataset . . . 93
5.11 Impact of the Rescale Factorαof FTA and pFTA on Classification Accuracy
in the MSRActionPairs Dataset . . . 94
5.12 Confusion Matrix of the Classification Results by FTA Feature in the UCI
Sport and Daily Activity Dataset . . . 96
5.13 Confusion Matrix of the Classification Results by pFTA Feature in the UCI
Sport and Daily Activity Dataset . . . 97
5.14 Confusion Matrix of the Classification Results by FTA in the
MSRAction-Pairs Dataset . . . 98
5.15 Confusion Matrix of the Classification Results by pFTA in the
LIST OF TABLES
3.1 The Set of 26 Primitive 3D Directional Relationships (grouped By Locations) 18
3.2 Comparison of the Computational Complexity . . . 26
3.3 Experimental Results . . . 28
3.4 Query Result of Example 1 . . . 32
3.5 Query Result of Example 2 . . . 33
3.6 Query Result of Example 3 . . . 35
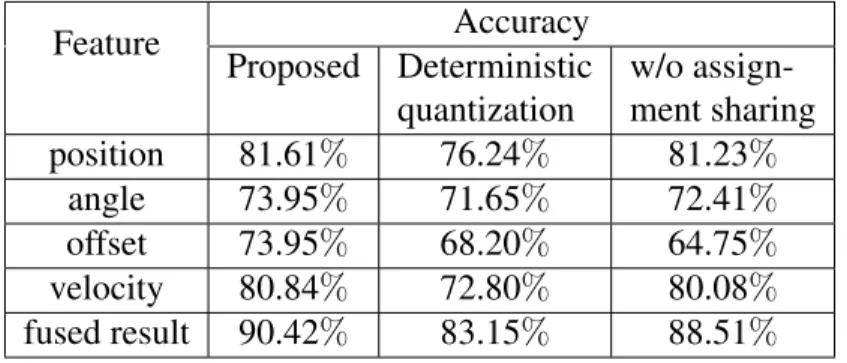
4.1 Impact of the height of Quantization Pyramid in the MSR-Action3D Dataset . 47 4.2 Impact of the Dynamic Temporal Quantization and the Frame Assignment Sharing in the MSR-Action3D Dataset . . . 48
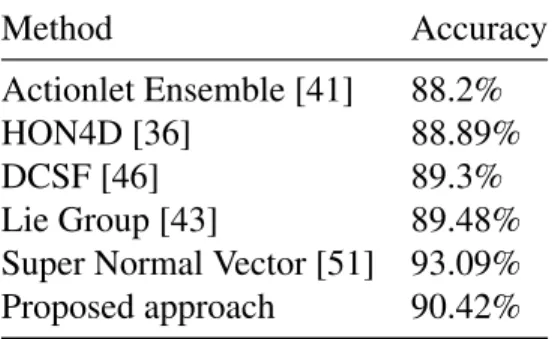
4.3 Comparison with State-of-the-arts in the MSR-Action3D Dataset . . . 49
4.4 Impact of the Dynamic Temporal Quantization and the Frame Assignment Sharing in the MSR-ActionPairs Dataset . . . 51
4.5 Comparison with State-of-the-arts in the MSR-ActionPairs Dataset . . . 52
4.6 Impacts of the Dynamic Temporal Quantization and the Frame Assignment Sharing in the UTKinect-Action Dataset . . . 54
5.1 Definitions of Notations . . . 61
5.2 The 19 Action Categories in the UCI Daily and Sports Activities Dataset . . . 81
5.3 Comparison with State-of-the-art Methods in the UCI Daily and Sports
Ac-tivities Dataset. For FTA and pFTA features,Lis set to 128 andK is set to
3. . . 89
5.4 Comparison of Execution Time for Feature Extraction in UCI Daily and
Sports Activities Dataset (K = 3, L = 128 for FTA and pFTA features).
Time is measured in units of one second. . . 90
5.5 Comparison of Training Time and Testing Time by Learning-based Methods
in the UCI Daily and Sports Activities Dataset. Cost is measured in units of
one second. For pFTA and FTA features,Lis set to 128 andK is set to 3. . . 91
5.6 Comparison with State-of-the-art Results in the MSRActionPairs Dataset.
For FTA features, L is set to 128 and K is set to 3. For pFTA features, L
is set to512andK is set to3. . . 100
5.7 Comparison of Execution Time in the MSRActionPairs Dataset. Cost is
mea-sured in units of one second. For FTA feature,Lis set to 128 andKis set to
CHAPTER 1: INTRODUCTION
Problem Statement and Motivation
Human Activity Recognition (HAR) has attracted intense research interest for more than a decade. Many different sensors, ranging from 2D and 3D cameras to miniature inertial sensors, such as accelerometers, gyroscopes and magnetometers, have all been investigated and utilized in HAR systems to capture various human activities. Recent development in commodity depth sensors,
such as Microsoft Kinect [3] and Leap Motion 1, have made quality RGBD data accessible at
an affordable cost. This new technology has driven the creation of a wide range of applications based on human activity recognition. For example, the original purpose of the development of Kinect depth camera is to support the natural user interface in video games such as dancing [4]. Such a capability is quickly applied to other application area, such as health care where human activity such as the gait information captured by the depth sensor can be used to help early-diagnose diseases or prevent health issues [5, 6]. Other successful applications have also been reported in education [7] and surveillance [8].
Although competitive performance has been reported, existing methods of HAR focus on the spa-tial representation of the human activity sequence, leaving the temporal dynamics inside the hu-man activity sequence largely under-researched. As a result, they often face the challenge of recognizing visually similar activities composed of dynamic patterns in different temporal order. For instance, “put on a hat” and “take off a hat”, “entering a room” and “exit from a room” are examples of human actions with the same primitive postures but the reverse order. It is very chal-lenging to distinguish these actions without sufficiently exploiting the temporal order information.
In addition, many model-driven methods based on sophisticated features and carefully-designed classifiers are computationally demanding and unable to scale to a large dataset.
Besides the above camera-based HAR systems, wearable sensors have also been widely utilized as a HAR solution with high availability to track one’s daily and fitness activities. For example, smart wristbands and smart phones provide a convenient solution to count steps and monitor heart
rate. Some smart wristbands even support the feature of auto-logging of different cycling events,2
or tracking the number of strokes made in a lap of swimming 3. The popularity in smart
wear-able devices have opened a unprecedented opportunity to solve the challenging HAR problem by learning expressive representations from the multimodal sensor signals recording huge amounts of daily activities.
Although many successful products and applications in HAR have been developed, wearable sensor-based HAR remains to be a challenging problem due to the highly noisy nature and the com-plex temporal dynamics within the sensor signals. Most existing sensor-based HAR approaches focus on extracting statistical and structural features from the time domain and frequency
do-main, such asmean, min, max, var, kurtosis, entropy, Fourier Transform coefficients and Discrete
Transform coefficients,etc., and do no consider the temporal dynamics inside the human activ-ity sequence. Therefore, they suffer from the confusion between activities with similar statistical patterns but different temporal patterns.
Contributions
To address the above challenges of HAR, this dissertation proposes solutions to HAR from three novel perspectives:
2
http://cycling.moov.cc/
1. 3D spatial relationship modeling and 3D spatial query-based human event detection.
2. Dynamic temporal quantization for human action representation.
3. Temporal order encoding for human activity recognition.
The main contributions of this dissertation are:
• A novel octree-based algorithm of computing the 3D spatial relationship between objects is
proposed. A set of 26 spatial operators are further defined and implemented to be included in an SQL-style event query language. HAR is then resolved by spatial-event query processing based on the 3D spatial relationship between a human and surrounding objects. Performance is quantitatively evaluated in a public RGBD object dataset and qualitatively investigated in a Live Video Computing Platform.
• A clustering-like algorithm is presented to quantize human action sequences of varied lengths
into fixed-size quantized vectors. A two-step optimization algorithm is proposed to jointly optimize the quantization of the human activity sequences. In the aggregation step, frames falling into the sample segment are aggregated by max-polling and produce the quantized representation of the segment. In the assignment step, frame-segment assignment is updated according to dynamic time warping, while the temporal order of the entire sequence is pre-served.
• A novel temporal order encoding approach is introduced to model the temporal dynamics of
the sequential data for HAR. The algorithm encodes the temporal order of the latent patterns extracted by the subspace projection and generates a highly compact First-Take-All (FTA) feature vector representing the entire sequential data. An optimization algorithm is further presented to learn the optimized projections in order to increase the discriminative power of
the FTA feature. The compactness of the FTA feature makes it extremely efficient for human activity recognition with nearest neighbor search based on Hamming distance.
Organization of the Dissertation
The rest of the dissertation is organized as follows: The literature review is presented in Chapter 2. In Chapter 3, we introduce the 3D spatial relationship modeling from the point cloud data and present the spatial event query-based human activity detection. In Chapter 4, the temporal order-preserving dynamic quantization algorithm for 3D human action recognition is presented. In Chapter 5, A novel temporal order encoding approach and two different First-Take-All feature representations are presented to encode multimodal sensor data into compact feature vectors for human activity recognition, and finally, Chapter 6 concludes the dissertation and discusses the future work.
CHAPTER 2: LITERATURE REVIEW
In this chapter, we review the related work in the literature for spatial relationship modeling, camera-based human action recognition and wearable sensor-based human activity recognition.
3D Spatial Relationship Modeling and Human Event Query Processing
The spatial relationship between objects has a fuzzy nature [9]. It is quite intuitive and common to human understanding when interpreting directions in an approximate framework. Most of the existing methods adopted the fuzzy framework and interpreted the spatial relationship by a number or a range indicating the degree of applicability; and the spatial relationship of two complex objects can be interpreted by a combination of primitive spatial operators. [10] presented a good survey of different methods for computing the spatial relationships.
A great number of methods in the literature are based on angles. Keller and Wang [11] measured
the angle between the connection of two points and the x-axis and used the cosine distance to
compute the direction “to the right” between two objects. This method can be extended to any
2D directional relationships by simply replacing thex-axis by other directions. Other evaluation
functions such as cubic spline functions were also utilized to measure the degree of applicability [12]. In [11], a centroid-based solution was proposed to evaluate the spatial relationship. Objects were represented by their centroid and the angle-based methods were employed to compute the directional relationships. Instead of using only centroid, Miyajima and Ralescu [13] computed the angle between any pair of points in the two objects. Then, a weighted histogram of angles were generated to compute the relationship between two objects. This exhausted comparison-based method can achieve higher accuracy at the cost of more computational overhead. Salamat
and Zahzah [14] proposed a method that can combined fuzzy topological relations and directional relations and modeled them simultaneously. Nevertheless, this method can only work with the 2D objects.
Besides angle-based methods, machine learning-based methods were also proposed to address the complexity of the spatial relationships. Artificial Neural Networks [15] were incorporated to train and classify different spatial relationships between several basic shapes. However, each type of shape required a dedicated classifier, making this method not scalable for the real world scenario. In [16], SVM (Support Vector Machine) was employed to detect the contact points of two objects which were further clustered into groups to establish the contact point network. This network served as a skeletonized description of the objects and was finally used to identify the spatial relationships of the objects. The skeleton graph only utilized the contact regions between two objects. As a result, it had limited capability in representing complex spatial relationships. As a matter of fact, this approach only supported two simple spatial relationships, namely “on” and “adjacent”.
Bloch [17] proposed a morphological approach to assess the spatial relationships of multiple ob-jects with respect to the same reference object simultaneously. A fuzzy landscape around the reference object was computed and the target object was then compared against the fuzzy land-scape by a fuzzy pattern matching approach. Since the entire space around the reference object was investigated, it was capable of intepreting the spatial relationships between complex objects. Two later versions of this approach were extended to focus on the spatial relationships “between” [18] and “along” [19] in the context of medical imaging. Although these fuzzy-based methods can address very complex objects, each direction of interest must be computed separately, which will inevitably incur huge computational overhead and make it not scalable for more general and realistic scenarios.
Most of the above methods can only compute the 2D spatial relationships from images. Recently, with the prevalance of the commodity depth cameras (e.g. Kinect), depth information and the point cloud data structure have been explored to investigate the spatial relations in the 3D environment. Three supporting relations, “on-top,” “partial on-top” and “side,” were evaluated in [20] based on the object volumes from the point cloud. An angle-based measurement was then applied to distinguish them. Similar to the idea of the exhuasted comparison in [13], the geometric relations of all pairs of skeleton joints of two people were exploited to detect the interaction between them [21]. Borrmann et. al. [22] addressed the 3D spatial query challenge from the database perspective. They developed a 3D spatial query language from ISO standard SQL to enable the spatial analysis of building information models. More specifically, a slot-tree-based algorithm was proposed to partition the 3D object and compute directions by testing the local coordinates of slot pairs. Since their directional model is straightforward, they only supported six major directions in the 3D space.
Similar idea was also investigated in [23, 24], where a Live Video DataBase Management Sys-tem (LVDBMS) was introduced and a Live Video Computing (LVC) framework was proposed to achieve the general event detection from a database point of view. A set of 2D spatial oper-ators, along with the temporal operators and logical operoper-ators, were introduced and an SQL-like Live Video Query Language (LVQL) was defined to support the continuous query of the spatial-temporal human-centric event.
Different from the database perspective for event detection, a hierarchical event modeling frame-work was proposed in [25] and [26]. They introduced the definition of three classes of event– transient event, atomic event and compound event, and further evaluated three relationships– temporal, causal and spatial between them. The proposed method mapped an event from the data-level to the domain-level thus achieved a better event representation.
Human Action Recognition From Videos
Human action recognition has been intensively studied in the recent decades. Many of the existing approaches for human action recognition focus on the spatio-temporal feature and local motions. Most of these works adopt histogram-based features to represent the distribution of the spatio-temporal patterns in the human actions. In [27], the space-time interest points (STIP) were
pro-posed as a local feature and used as a compact representation of spatio-temporal events. Dollaret.
al. [28] applied the sparse spatio-temporal features to characterize the cuboids of spatio-temporally windowed data, and used the dictionary of cuboid prototypes to interpret a variety of human ac-tions. Normally, the Bag-of-Word feature representation is employed as an unsupervised method to learn the dictionary of the spatio-temporal visual words. Supervised learning methods such as SVM is then employed to classify these feature vectors into different action categories.
Beside the Bag-of-Word-style methods, other features such as the motion energy of the action sequences, optical flow and contours have also been investigated for human action recognition. In [29], the motion energy image and motion history image were constructed as a temporal template and the Hue moments were extracted to describe the human activity. [30] introduced a motion descriptor based on optical flow measurements and recognized the activities in a nearest neighbor framework. In [31], a sequence of 2D object contours with respect to time were exploited to generate a spatio-temporal volume (STV), which was later used as the action descriptors to identify human actions. Agarwal and Triggs proposed a shape feature descriptor from image silhouettes and recovered the human pose by using the nonlinear regression [32]. The above global features can interpret the action in a holistic way. However, they are normally dense and less computationally efficient.
Recent advances in depth cameras (e.g. Kinect) provide an affordable solution to access multi-modal data from the indoor environment and attracts huge interest in the research of 3D human
action recognition. There are a great number of approaches using only the depth data from the Kinect sensor. [33] proposed a human pose descriptor by computing the average normalized depth value on a dense grid over the 3D point cloud of the human body. In [34], the bag of 3D points from the depth maps was sampled and projected into three orthogonal 2D planes. An action graph was then employed to model the dynamics of the actions. Similar ideas had been applied in [35], where depth motion maps were accumulated over depth sequences and projected into three orthogonal planes, and the HoG (Histogram of Oriented Gradient) feature were computed as the feature de-scriptor to classify human actions. Oreifej and Liu [36] proposed the 4D normals from the surface of the 3D point cloud and introduced the histogram of oriented 4D normals (HON4D) descriptor. A machine learning-based sampling process was further applied to optimize the weight of each projector to achieve higher discriminative capability. This method has achieved great accuracy on several datasets. However, it is skeptical to datasets containing large spatial location variations.
With the success of skeleton joints estimation from depth images [37], joint-based features [38, 39, 40, 41, 42, 43] gain huge popularity in 3D action recognition. [39] and [38] both proposed view-invariant features from skeleton joints by coordinates transformation to detect human actions. Instead of using joint locations directly, [41] and [42] computed the normalized pair-wise joint distances from all pairs of skeleton joints and demonstrated good discriminative capability. In [40], distances of skeleton joints between the current frame and the previous frame as well as the first frame were computed in order to combine the spatial and the temporal feature. The joint-based features can be further quantized into code words and histogram of 3D joints (HOJ3D) [39] and histogram of visual words [40] were employed to describe the action sequences. Different from those joint-based methods, Vemulapalli [43] proposed a body-part representation of the skeleton and modeled the geometric transformation between different body parts in the 3D space. The temporal dynamics in terms of 3D transformation were captured and projected as a curved manifold in the Lie group. Classifications on the curves eventually determined the labels of the action.
Instead of using single modality data such as depth or skeleton joints, there are also many works leveraging multimodal data to further increase the recognition accuracy. Methods based on the
RGB+depth images had been proposed lately. Niet.al.[44] extended the space-time interest point
(STIP) feature [27] by combining the color and depth information and proposed their multimodal fusion schemes. Zhang and Parker [45] proposed the 4D local spatio-temporal features that com-bine both the intensity image and the depth image, and replaced the original cuboid in [28] with the 4D hyper cuboid. Xia and Aggarwal [46] also extended the STIP feature in depth videos and described the local 3D depth cuboid by measuring the Depth Cuboid Similarity. Some other works also consider the combination of Depth+skeleton feature. [41] proposed the Local Occu-pancy Patterns (LOP) which characterized the distribution of point cloud around joints where the human-object interactions happened.
Most of the above methods adopt the histogram-based representations of local spatio-temporal features. Such features completely remove the global temporal information of the sequence data and therefore may be confused by actions containing similar poses but different temporal order. To address this issue, many methods focus on modeling the temporal structures of the human actions in a holistic way. Graph model-based methods such as Hidden Markov Model (HMM) [47], Max Entropy Markov Model (MEMM) [48], Conditional Random Field (CRF) [49] had been proposed to interpret the dynamics of the human actions. Motion template-based approaches [50, 42] introduced another way of modeling the temporal characteristics of human actions. In the motion template methods, a number of motion templates indicating different action classes were trained. Dynamic Time Warping (DTW) was employed to warp the video sequences of varied length. The labels of the unknown action sequences were then determined by measuring the similarity between the unknown sequences and the motion templates. These methods are able to detect and recognize a subsequence from the entire video and did not require the pre-segmentation of the video sequence. This is a great advantage and can be applied for online human action
recognition. Temporal Pyramid [41, 36] was developed to capture the temporal structure of the sequence by uniformly subdividing the action sequence into partitions. Spatio-temporal feature descriptors were then applied to each partition. Since the uniform partition along the temporal axis was employed, the temporal pyramid was less flexible to handle the inter-class similarity and intra-class variation of the temporal patterns of different actions. Adaptive temporal pyramid [51] was proposed to partially overcome the above disadvantage by subdividing the temporal sequence according to the motion energy. A Super Normal Vector feature was then generated from the space-time partition and served as the comprehensive representation of the sequence. However, this method heavily relied on sophisticated features such as 3D surface normals and polynormals which were inapplicable to more general problems. In general, the aforementioned temporal modeling methods suffer from the temporal misalignment due to factors of temporal translation, motion scales and execution rate variations [42]. Temporal modeling still remains to be a challenging problem for human action recognition.
Wearable Sensor-based Human Activity Recognition
Wearable sensor-based HAR has been an active research field for more than a decade. Many different aspects have been investigated to improve the performance of HAR, including sensor and attribute selection, data acquisition, feature extraction, classification and energy consumption. All of the above factors have crucial impacts on the performance of HAR systems. In this section, we review the previous literature on feature extraction and classification for HAR.
Feature Extraction
Acceleration and gyroscopic data from miniature inertial sensors such as the accelerometer and gy-roscope have been widely employed to recognize ambulation activities, including walking, climb-ing stairs, lyclimb-ing down, etc. [52, 53, 54, 55, 56]. Genrally, time series signals are segmented into windows with or without overlapping. Feature extraction is then applied to the windowed data to produce feature vector for recognition. Although sensor signals are oscillatory and prone to high fluctuation, they will still exhibit certain statistical behaviors. These behaviors have led many works to adopt statistical features from the time domain of the sesnor signal. For exam-ple, mean, max, min, standard deviation (std), skewness, kurtosis [57], median absolute deviation (mad), root mean square (rms), interquartile range (iqr) [58] and spectral entropy [59] have been utilized to form a statistical representation of the sensor signals. In order to handle the periodic signals in human activities, raw sensor signals are also transformed into the frequency domain by Discrete Fourier Transform or Discrete Cosine Transform, and different statistical features have been extracted, such as peak of DFT coefficients, energy, index of the largest frequency compo-nent, and signal power in different frequency bands [55, 56, 54, 57]. Some other techniques have also investigated both time and frequency characteristics of complex signals and employed wavelet coefficients and their energy as features [60]. To further enhance the discriminative power of the statistical features, several HAR systems combine the above time domain and frequency domain
features to form a super feature vector. For example, Altun et. al. employed a 1170-dimensional
feature vector by concatenating a collection of statistical features and further reduced the
dimen-sionality to 30 by Principle Component Analysis [55]. Auguitaet. al. separated body acceleration
and body angular acceleration from the gravity acceleration and implemented 17 features from the time domain and the frequency domain and eventually created a 561-dimensional feature vector representing a human activity sequence [56, 61]. The proposed pFTA feature is significant differ-ent from all of the above traditional statistical features and addresses the problem of human activity
recognition from a new perspective of temporal dynamics interpretation.
Classification
Most existing methods for HAR adopt off-the-shelf classifiers for the task of prediction. Unsuper-vised methods such as K Nearest Neighbor(KNN) and Dynamic Time Warping (DTW) [62] have been employed as straightforward solutions to classify feature vectors according to their distance. However, DTW often requires pairwise comparison between temporal order of human activity pat-terns, which are computationally demanding and unable to scale to a large dataset. Supervised methods, such as Artificial Neural Networks (ANN) [63], Naive Bayes [64], Decision Trees, Ran-dom Forests [65], and Support Vector Machine (SVM) [66], have also been widely adopted to train human activity models from labeled training data. The majority of existing classification methods are still shallow and with simple structures. Recurrent Neural Networks (RNN) such as Long Short-Term Memory [67] have proven to be very powerful in capturing the temporal dynamics in time series, and are extremely effective in time series classification inlcuding speech recognition [68] and multimodal translation [69]. More recently, LSTM has also been used in Human action recognition [70, 71, 72]. For example, differential Recurrent Neural Networks (dRNN) has been proposed to model the dynamics of human actions by computing different-orders of derivative of state that are sensitive to the spatio-temporal structure of input sequence [71]. A hierarchical archi-tecture of RNN has been proposed to accumulate the results from multi-layer RNNs and eventually makes the decision by a single-layer perceptron [72]. Besides RNN, Convolutional Neural Net-works have also been studied for human activity recognition from sensor streams. In [73], a hybrid end-to-end deep architecture, DeepConvLSTM, has been built from Convolutional Neural Net-works (CNN) and LSTM Recurrent Neural NetNet-works to model the temporal dynamics of human activities from wearable sensor signals and achieved state-of-the-art results. In general, LSTM encodes the temporal structures of activity patterns in their memory states, but how the memory
states can be mapped to temporal order of patterns is unclear which limits their ability in fully capturing dynamic structures behind human activities.
CHAPTER 3: 3D SPATIAL RELATIONSHIP MODELING FOR HUMAN
ACTIVITY DETECTION
This chapter presents the research on 3D spatial relationship modeling for the query-based human activity detection from the data stream captured by the Kinect sensor.
Introduction
Spatial relationship specifies how an object is located in space in relation to the reference object. Effective computation of spatial relationships between objects is an essential problem for many ap-plications including robotics [74, 75, 16], video surveillance [23, 24, 26], and scene understanding [76, 77, 78].
Spatial relationships can be roughly classified into two groups, the topological relationships and the metric relationships [79]. The topological relationships have a large number of instances including coincide, intersect, touch externally, touch internally, contains, inside, disjoint, etc. A complete set of topological relationships were proposed in [80]. The metric relationships can be further split into distance relationships and directional relationships. Typical distance relationships include at, nearby, in the vicinity, far away, etc. Directional relationships are those operators specifying the relative or absolute spatial directions such as left, right, in front of, at the back of, north, south, west and east. Compared with the topological relationships and the metric relationships, the directional relationships remain under-researched [10]. In this chapter, we focus on the research on the directional relationships between two objects and assume one object does not contain or contact the other. In addition, we only deal with the indoor environment considering the limits of the depth camera.
Spatial relationship modeling has been investigated for human activity detectionin [23, 24], where a Live Video DataBase Management System (LVDBMS) was introduced and a Live Video Com-puting (LVC) framework was proposed to achieve the general event detection from a database point of view. A set of 2D spatial operators, along with the temporal operators and logical operators, were introduced and an SQL-like Live Video Query Language (LVQL) was defined to support the continuous query of the spatial-temporal human-centric event. This research extends the 2D spatial relationship modeling in [23, 24] into the 3D environment by leveraging the RGBD stream from the depth camera. It is very challenging to define and compute the 3D relationship between objects due to its fuzzy nature. In addition, depth data are normally noisy and incomplete with severe self-occlusions, making the 3D object modeling even more challenging. Last but not least, there are significantly more computational overhead for 3D data than 2D data which has a higher demand on the efficiency for real-time applications.
Note that a portion of this work, including the techniques and results, have previously been pub-lished by the author in conference [1] proceedings and in journals [2]. The contributions of the proposed research are as follows.
• We define a new set of 3D directional operators that can effectively represent the spatial
relationships between objects in the 3D environment;
• We introduce a novel octree-based object modeling technique and propose the
Ray-Tracing-like sampling-based technique to compute the 3D spatial relationship between objects of complex structure. A GPU-base implementation is developed to speed up the proposed algorithm for the real-time scenario;
• The performance of the proposed technique is quantitatively evaluated in a public 3D RGBD
object dataset and we integrate the proposed technique in the LVDBMS prototype and in-vestigate its performance on human activity detection in a real-time setting.
Proposed Solutions
In this section, we first introduce a set of 3D directional operators that will be used for the 3D spatial relationship modeling. A point cloud based 3D object modeling technique and its extension to the octree-based 3D object modeling algorithm are presented then. A sampling-based method to compute the directional spatial relationship between objects are finally proposed.
Definition of 3D Spatial Relationship
The directional relationship in the 2D space can be represented by either relative direction (left, right, front and back, or the global direction (east, west, north and south). In this research, we adopt the global term as our directional relationship system.
(a) The Eight Directions in 2D Plane
(b) The Six Major Directions in 3D Space
(c) 26 3D Directions Fitted in A 3×3Cube
Figure 3.1: Extending 2D Directions to 3D Directions
As can be seen in Figure 3.1a, 2D directions are defined in a plane without distinguishing whether the objects are above the plane or below the plane. This will result in less accurate description when expressing the directions in the 3D space. To address this issue, an intuitive way is to add two major directions, “above” and “below” to the original 2D directions by the left hand rule as
By combining any three orthogonal directions in Figure 3.1b, we can generate a set of 26 3D directional relationships. This set of the 3D directions can be perfectly fitted into a3×3cube as illustrated in Figure 3.1c, where the original eight 2D directions are preserved in the middle level of the cube and the extended directions are located in the upper and lower level. Specifically, the 16 new directions in the upper and the lower level are generated by concatenating A or B with
the eight original 2D directions. For example, ANW means “northwest” in the “above” direction.
Table 3.1 summarizes the set of 26 3D directions and groups them according to their locations with respect to the 2D horizontal plane. It is obvious that the 3D directions are a super set of the original 2D directions.
Table 3.1: The Set of 26 Primitive 3D Directional Relationships (grouped By Locations)
Above the 2D
horizontal Plane A, AE, ANE, AN, ANW, AW, ASW, AS, ASE
On the 2D horizontal
Plane E, NE, N, NW, W, SW, S, SE
Below the 2D
horizontal Plane B, BE, BNE, BN, BNW, BW, BSW, BS, BSE
3D Object Modeling
[htbp] In this subsection, we introduce the technique of the 3D object modeling by the RGBD data from a single Kinect sensor [81].
Cloud-based 3D Object Modeling
With the advancement of the sensing technology, commodity depth cameras (e.g. Microsoft
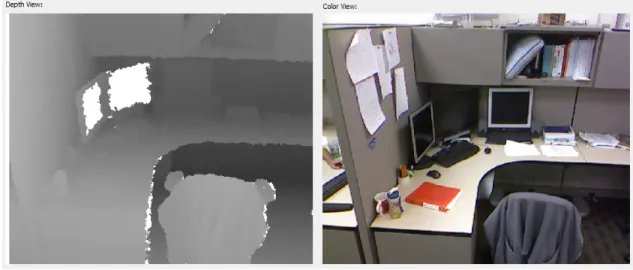
in real-time. Figure 3.2 shows an example of the aligned RGB and color coded depth image from the Kinect. Each pixel in the depth image has a corresponding pixel in the RGB image. Therefore, each point in the point cloud can be represented by a 6-tuple data structure,(i, j, r, g, b, zc), where
i and j denote the column index and the row index of the pixel in the image, r, g and b denote
the three channel color information of the pixel and zc denotes the raw depth reading measured
by the Kinect. The coordinate of each pixel (i, j, zc) in the image can be further converted to a 3D coordinate in the world coordinate system according to the camera model [1]. Additionally, the 3D point cloud is rotated in the 3D space so that the floor plane in the depth image is parallel to the floor plane in the real world [2]. This is to compensate the camera orientation. Figure 3.3 illustrates the point cloud-based 3D model of the computer chair in an office view. The computer chair is segmented from the background according to its depth value.
Otree-based 3D Object Modeling
The aforementioned object modeling algorithm is based on the dense point cloud data which will inevitably incur heavy computational overhead when computing the spatial relationship between different objects. This is not scalable for large-scale real-time applications. To address this issue, we introduce a more compact data structure by employing the octree decomposition [82] of the original point cloud data. Therefore, the computational overhead is significantly reduced.
(a) Original Image (b) The Point Cloud of the Ex-tracted Objects after Rotation and Background Removal (The Frontal View)
Figure 3.3: Object Segmentation from the 3D Point Cloud
The octree is a space-dividing hierarchical tree structure for the quantized representation of 3D volumetric geometry. As shown in Figure 3.4, each internal node of the octree has exactly eight children, and it recursively subdivides the 3D space enclosed by the parent node. To construct the octree-based object model in the proposed technique, a bounding box is employed to enclose the object of interest in the RGB image. An axis-aligned bounding box (AABB) is then computed from the point cloud extracted by the 2D bounding box according to [22]. Figure 3.5a illustrates an example of the AABB of a computer chair. Finally, the AABB of the object is used as the root node of the octree and the decomposition process is recursively performed until the number of point in
each subcube is less than a threshold which serves as the parameter to control the granularity of the model. It is obvious that, more levels of octree decomposition can produce an octree model of finer quality. However, the trade-off between the accuracy and the computational overhead must be considered for the real-time application scenarios. Those subcubes do not contain any point are removed from the model and the connected components of the remaining subcubes are extracted and clustered to give the octree-based representation of the object.
Figure 3.4: A Two-level Octree Model
(a) (b) (c) (d)
Figure 3.5: Octree-based Modeling. (a) Point Cloud-Based Chair Model, (b) Octree-Based Chair Model, (c) Human in the Depth Image. (d) Octree-Based Human Model.
by the front side of the objects, making the 3D object models incomplete. To deal with the self-occlusion, the backside of the object is filled up by a heuristic proposed in [2]. An example of the final octree models of an static computer chair and a human are illustrated in Figure 3.5. As can be seen, the octree models is able to provide a highly abstract representation of the object while preserve sufficient geometric structure of the object. Essentially, we use the subcubes of the octree modal to replace each individual pixel in the point cloud so that the computational overhead can be significantly reduced.
3D Relationship Computation
In this subsection, the algorithm for computing the spatial relationship between a target object and a reference object is introduced. Most conventional approaches assume object with simple shapes or structures, such as a ball or a box. While this is not always true in reality where objects like human beings can have very complex structure. Inspired by the Ray Tracing rendering technique [83] in the computer graphics, we propose a sampling-based method to compute the 3D directions which considers the sub-structure of the objects.
The general idea of the proposed algorithm is: we sample the entire space around the reference object by generating a number of rays from the reference object. Each ray represents one of the 26 3D directions. If the ray hits any subcube of the target object, the target object is partially in the direction represented by the ray. Finally, results of each ray are aggregated to form a feature vector indicating a global representation of the directional spatial relationships between the target object and the reference object.
Sampling the Space By Rays
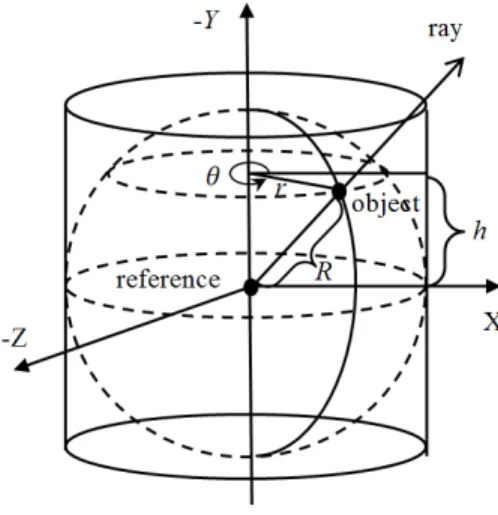
Since we use rays origined from the reference object to sample the entire 3D space, it is crutial that the sampling process is uniform and evenly covers the space. To achieve this goal, we adopt the approach in [84], which achieves a uniform point sampling on the spherical surface. Therefore by connecting the origin and the sampling points, we generate rays that can uniformly sample the 3D space.
Figure 3.6: Uniform Spherical Surface Sampling
Figure 3.6 shows the sampling process. A random number, h ∈ [−R, R], (R is the radius of
the sphere), is used to create a plane parallel to the xoz plane with a distance ofh. This plane
will intersect with the sphere surface at a circle. A second random number, θ ∈ [0,2π), further determines the position of a random point on the circle. In this way, a random point on the spherical surface is sampled and has the coordinate given by (3.1).
The random points generated in the above way have a uniform distribution on the spherical surface according to [84]. Following this way, the rays originated from the sphere center and pointing to the random points on the spherical surface therefore have a uniform distribution over the space enclosed by the sphere. The more rays we use, the higher sampling quality can be achieved. Considering the trade-off between the performance and the computational overhead, we uniformly
quantizeh andθ into 20 and 39 intervals, respectively and generate 840 rays. We further assign
each ray one of the 26 3D directions according to the value ofhandθso that each direction will
have approximately the same rays. The detailed assignment can be found in [2].
Ray-Tracing-Based 3D Direction Computation
For each subcube s in the reference octree model, a sphere sampling process is performed and
840 rays are originated from the centroid of the subcube to probe the entire space. A ray-subcube intersection condition is evaluated for each ray. Let’s denotepsl as intersection result of thelthray originated from subcubes. psl is set to1if the ray hit any subcubes of the target octree model and 0, otherwise. Results of rays falling into the same directions are aggregated and a 26-dimensional feature vectorWs is developed with each elementwsh indicating the number of rays intersect with the target octree model in this direction. Ws = [ws1, w2s, ws3, w4s,· · · , ws26],wherewsh is computed by (3.2), whs = 840 X l=1, map(l)=h psl, (3.2)
wheremap()is a look up table that maps thelth ray to its assigned direction. The above process
is performed for each subcube of the reference object and the results at all reference subcubes are
further aggregated to give a 26D vectorW. W is further normalized by the L1 norm. In addition,
a threshold is used to filter out the less salient relationships which are considered to be noise. This threshold is set to 0.1 empirically.
The proposed algorithm has two advantages. Firstly, instead of computing one spatial direction at a time, the proposed method can compute all directions at once, which is significantly more efficient than the conventional methods. Secondly, since each subcube of both the reference and the target objects are considered, such a subcube-to-subcube evaluation strategy can achieve a better global representation of the spatial directions between objects with complex structures.
GPU Implementation
Although the octree-based modeling can greatly reduce the computational overhead, the computa-tion on the ray-subcube interseccomputa-tion on all pairs of subcube between the two objects still requires a significant amount of computation. In order to enable the real-time capability, we implement the the ray-subcube intersection module by the OpenCL [85] programming. In our implementation, the evaluation at each subcube of the reference object is computed in parallel in the OpenCL ker-nel. As a result, the overall time for computing the results at all subcubes of the refence object is almost equivalent to the time for computing a single subcube, and dramatic speedup is gained. We will show more results on the GPU speedup in the performance study section.
Discussion on the Proposed Solutions
The computational complexity of the proposed algorithm is analyzed and compared with the al-gorithms in the literature. Comparison results are summarized in Table 3.2. There are three steps in the the proposed algorithm: octree decomposition, ray sampling and result mapping. The com-plexity of octree decomposition isO(np), wherenp the number of pixels in the point cloud of the object. In ray sampling, the complexity of a single ray-subcube intersection is O(no). no is the number of subcubes of the object octree model. It will be repeated for all rays at each subcube of
the reference object and the total complexity is of O(Nrayn2o)whereNray denotes the number of
rays. This is the most time-consuming part. The third step maps theNraydimension results back to
the 26 directions. So the complexity isO(Nray). Putting all together, the complexity of the entire algorithm isO(np) +O(n2oNray) +O(Nray)which is equivalent toO(n2oNray). Sinceno Nray
for most cases, the complexity is essentially quadratic to the number of subcubes,no which has a
significantly lower complexity than those pixel-based methods.
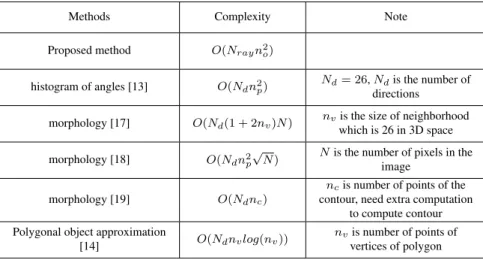
The polygonal object approximation method [14] has a lower complexity than the proposed method. Nevertheless, it can only handle 2D directions. The morphology-based method [19] has a com-plexity of onlyO(Ndnc), wherencis the number of points of the 3D contour but it requires extra computation to find the convex hull from the point cloud. As mentioned earlier, our algorithm can compute all the 26 directions at one run. Whereas all the other algorithms listed in Table 3.2 can only compute one direction at a time. That’s why they all bear a constantNd(number of directions) in the complexity.
Table 3.2: Comparison of the Computational Complexity
Methods Complexity Note
Proposed method O(Nrayn2o)
histogram of angles [13] O(Ndn2p)
Nd= 26,Ndis the number of
directions morphology [17] O(Nd(1 + 2nv)N) nvis the size of neighborhood
which is 26 in 3D space morphology [18] O(Ndn2p
√
N) Nis the number of pixels in the image
morphology [19] O(Ndnc)
ncis number of points of the
contour, need extra computation to compute contour Polygonal object approximation
[14] O(Ndnvlog(nv))
nvis number of points of
Performance Studies
To have an extensive performance evaluation on the proposed technique, we conduct the experi-ments in two different settings. Firstly, we evaluate the accuracy of the algorithm in a public RGBD image dataset. Secondly, we implement the proposed technique in the LVDBMS and demonstrate its performance in human activity detection in the live video query processing framework.
Experiments on RGBD Image Dataset
For quantitative performance studies, the proposed spatial relationship modeling algorithm is eval-uated in a public RGB-D dataset [86]. This dataset consists of aligned RGB images and depth images captured by a Kinect sensor in eight different indoor scenes such as kitchen and living room. Each image contains several common household objects. We select 43 representing images from the dataset and evaluate the spatial directional relationships between 214 pairs of objects in those images. Note that the RGB-D dataset is originally established for 3D object recognition, therefore no ground truth (GT) of spatial relationship is provided. We manually labeled the GT by ourselves in [1]. It worth mentioned that there can be multiple spatial relationships existing between two objects at the same time. For example, W and NW can coexist between two objects. We adopt recall, precision and F-score as the performance metrics which are defined as follows:
recall= num of correctly detected relationships
total num of relationships in the GT , (3.3)
precision= num of correctly detected relationships
F1 = 2·
precision·recall
precision+recall (3.5)
It is clear that increasing recall may result in the drop of precision. Meanwhile, increasing precision
may also compromise recall.F1score serves as a balanced metric between recall and precision. A
higherF1score represents higher overall performance.
We compare the performances of the proposed technique with other state-of-the-art solutions based on the above metrics and summarize the results in Table 3.3. From the perspective of spatial query, recall is a more significant metric than precision because normally, it is more interesting to know
whether a given spatial relationship exists or not. Our proposed technique achieves92.6% recall,
significantly higher than all the other state-of-the-art methods listed in the Table. We notice the centroid-based method and the landmark-based method in [1] have a higher precision than the proposed methods at the price of a much lower recall. To achieve an overall understanding of the
performance, we further compute theF1 score from the recall and the precision. It shows that the
proposed method achieves a significant higher score than the other methods, which demonstrates the superior performance of the proposed method.
Table 3.3: Experimental Results
Method Recall Precision F1 Average Speed
Centroid [1] 72.8% 88.6% 0.798 41.8ms
Landmark [1] 82.5% 84.3% 0.834 1370 ms
Morphology [17] 90.4% 75.8% 0.825 406.22 ms
Proposed technique 92.6% 79.6% 0.860 127.3 ms (non-GPU)
53.6 ms (GPU)
is measured by the average time in millisecond to compute the 26D feature vectors between a pair of objects in one image. Hardware configuration is stated in [1]. Since other methods listed are not implemented with GPU, for fair comparison, we implement the proposed technique in two different versions, a non-GPU version and a GPU-accelerated version. As shown in Table 3.3, the speed of the non-GPU version is approximately 10 times faster than the landmark-based method and 3 times faster than the morphology method, which agrees with the analysis in complexity in the previous subsection. By leveraging the parallelism in the GPU-based programming, we further reduce the processing time from 127.3 ms to 53.6 ms which is almost comparable to the centroid-based method. Technically, the GPU-version is expected to give a much higher speedup due to the fact that the computation at all subcubes are fully in parallel. However, there is a slowdown due to the overhead for OpenCL kernel initialization. We expect a faster speed when processing videos because the resources initialization happens only once for the entire video. This has been
demonstrated by the experiments on videos. The GPU version achieves a 25∼27 FPS (frame per
second) when processing a video with640×480 resolution, that is 37ms∼40ms for one frame.
This justifies the explanation of the slowdown of the GPU version when processing the image data. We belief the speed of the proposed method is sufficient for the general-purpose real-time live video computing.
Validation in the LVDBMS Framework
In this subsection, we investigate the performance of the proposed spatial relationship modeling technique for human activity detection in the LVDBMS. LVDBMS was originally developed by
Peng and Aved, et. al. in [23, 24] as a general platform for Live Video Computing (LVC)
ap-plication development. It treats the video feeds from live cameras as a special kind of database and supports the continuous queries to retrieve video segments that satisfy certain query predicates defined in terms of spatial, temporal and logical operators. An SQL-like Live Video Query
Lan-guage (LVQL) was defined describe various spatial-temporal events in the video stream. More details of the flatform can be found in [23, 24]. In this dissertation, we are particularly interested in its application in human activity detection by querying the spatial and temporal events in the live videos. We extend the original 2D spatial operators in the LVDBMS with the proposed 26 3D spatial spatial relationships.
The spatial operators have the syntax,Operator(Operand1, Operand2, T hreshold). Operand1
is the reference object;Operand2is the target object. Both operands can be either dynamic object
or static object. A threshold in terms of centimeters is used to specify the minimum distance
between the two objects in the direction. As an example, East(Operand1, Operand2, 20)
represents Operand2 is to the east of Operand1 and their distance in the east direction must
be at least 20 cm away. The value of the operator East is evaluated continuously in real-time
according to the 3D spatial relationship modeling methods. At each point of time, it output “1” if
the direction “east” is detected and “0” otherwise. We further extend the 3D spatial operators to
support the dynamic trend of the two objects by adding the symbols of “+” and “−”. For example
East−means the target object is to the “east” direction of the reference object and it is moving
towards the reference object. Similarly,East+shows that the target object is moving away from
the reference object in the east direction.
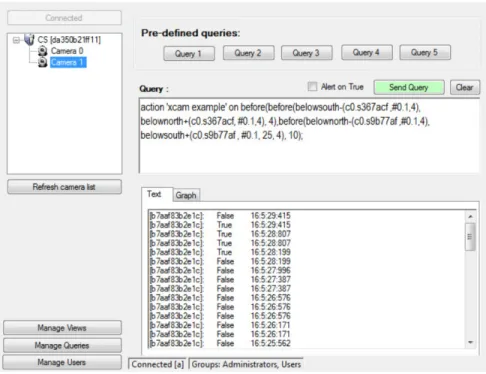
A screen shot of the graphic user interface of LVDBMS is shown in Figure 3.7. To support the continuous live event detection, each query is executed every 250 ms by the query process server
in the LVDBMS and outputs either “True” (T) or “False” (F) with T meaning the event is detected
on the current time and F otherwise. In this experiment, we show three different examples to demonstrate the effectiveness of the spatial relationship modeling for human activity detection.
Figure 3.7: The Graphic User Interface of LVDBMS
Example 1: Event with One Person and One Static Object
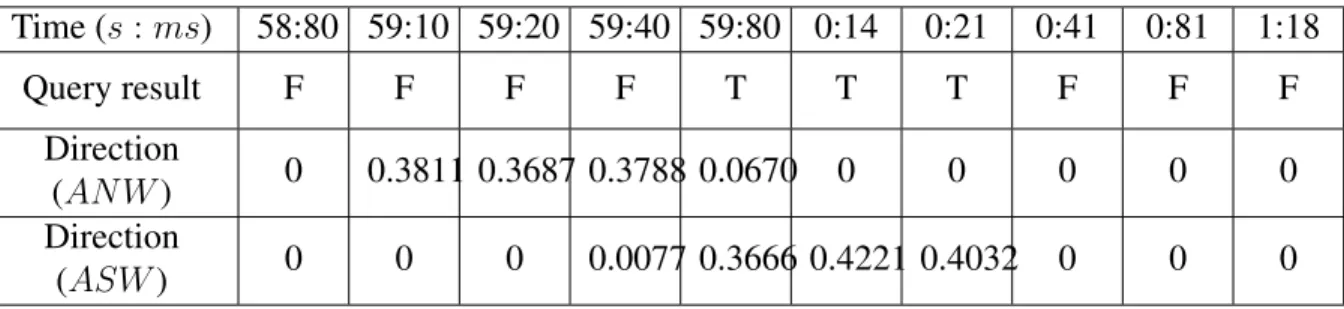
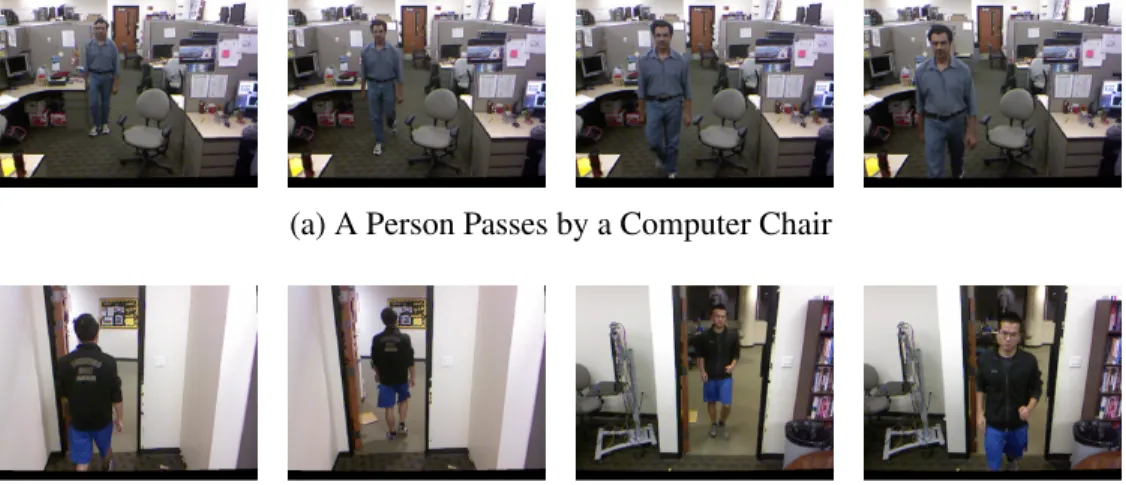
In this example, we show the query example of a simple event between a static object and a human being. The event of a person passing by a computer chair (the reference object) is captured by a Kinect, and their spatial relationships in terms of 3D directions are evaluated in real-time. We show some key frames of the above event in Figure 3.8a. Those key frames are manually selected for demonstration purpose only. The following query is used to represent the event.
Bef ore(AN W(c1.s6745bb, c1.@), ASW(c1.s6745bb, c1.@), 4),
where a temporal operator “before” and two spatial operators “ANW” and “ASW” are used. In the
LVQL syntax, c1.sxxxxxx denotes the static object (computer chair) in camera 1 which is manually selected by drawing a bounding box around the object in the RGB image. The six-digit number
after “c1.s” is a randomly generated ID to uniquely identify the static object in LVDBMS. Symbol “c1.@” refers to the dynamic object automatically tracked by the Kinect SDK in camera 1. During the query processing, the temporal operator “before” takes the output of the two spatial operators,
AN W and ASW as the input and evaluates the order within a 4-frame window. If “ANW” is
detected before “ASW” in a 4-frame window, the entire query will output true.
The query results are summarized in Table 3.4, where the final query results as well as the interme-diate results of individual operators are shown at each point of time. In the 3-second-long event, the query is evaluated for 10 times. “AN W”generates several positive results in the first part of the event while“ASW”outputs positive results at the second half of the event. The event has been detected for three times when “ANW” occurs before “ASW” in a window of 4. The query results perfectly match the human observation.
Table 3.4: Query Result of Example 1
Time (s:ms) 58:80 59:10 59:20 59:40 59:80 0:14 0:21 0:41 0:81 1:18 Query result F F F F T T T F F F Direction (AN W) 0 0.3811 0.3687 0.3788 0.0670 0 0 0 0 0 Direction (ASW) 0 0 0 0.0077 0.3666 0.4221 0.4032 0 0 0
Example 2: Cross Camera Event
In this example, we show a composite event involving multiple objects across different cameras. Since the LVDBMS utilizes distributed live cameras at different locations, it is common and essen-tial to query events occurring simultaneously or sequenessen-tially in different cameras during a period of time. To show the capability to handle the cross camera event, we show an event that a
per-son exits from a room and enters the room next door (See Figure 3.8b). This is almost the most common event in the indoor scene. We use the following query to interpret the event.
Bef ore(
Bef ore(BS−(c1.s367acf, #1.2), BN+(c1.s367acf, #1.2), 4), Bef ore(BN−(c2.s9b77af, #1.2), BS+(c2.s9b77af, #1.2), 4),10).
The above nested query has three levels. At the bottom level, spatial operatorsBS−,BN+,BN−
and BS+ are computed to generate the spatial relationship between the person and the door at
each point of time; at the middle level, the temporal operator “before” is employed to compute
the sub-event of exiting and entering the doors; Finally at the top level, another temporal operator “before” is used to evaluate the temporal order of the two sub-event and eventually determines the
entire query result. The symbol “#1.2” denotes the same dynamic object appears in camera 1 and
2. We use a distributed in-memory image retrieval system [24] to perform the cross-camera object tracking.
Table 3.5: Query Result of Example 2
Time (s:ms) 0:25 0:65 0:86 1:06 1:46 1:67 1:87 2:07 2:48 2:68 2:88 3:29 3:49 3:69 4:10 4:30 4:51 4:91 Query result T T T BS− T T T BN+ T T T Exit T T T BN− T T BS+ T T T Enter T T T
show the result of T and omit all the F with blank. In this 5-second-long event, LVDBMS evaluates the query 20 times. In the first half of the event, the sub-event of exiting from the room is detected and three Ts are produced; in the second half, the sub-event of entering another room is detected and another three Ts are generated. The top-level operatorbef oreobserves that exiting through the door appears earlier than entering the door within a 10-frame window and produces T accordingly. This example demonstrates the capability of the 3D spatial operators in detecting the cross-camera events.
Example 3: Event of Interactions Between Two Persons
All of the above query examples only covers events involving one person and one static object. Spatial relationships between two persons are also common in many events with multiple persons interactions. We give a demonstration of an event involving two persons. Figure 3.8c demonstrates the event of two persons walking towards each other in the hallway. They meet in front of the camera and keep walking out of the view. We use a simple querySouth(c1.∗, c1.∗,20)to detect the event, wherec1.∗denotes any dynamic object in camera 1.
This query captures the moment these two persons are overlapping with each other from the view
of camera. At this point of time, one person must be to the “south” of the other person and the
operator ”south” can detect the event. Furthermore, we use the threshold “20” to ensure the two
people are at least 20 cm away from each other and there is not contact between them. Query results are summarized in Table 3.6. As can been seen, the direction value and the distance reach maximum and minimum, respectively, when the two people meet each other in front of the camera. This example validates the effectiveness of the spatial operators when dealing with two dynamic operands. It also shows that 3D spatial operators can effectively detect whether two visually over-lapping objects contact each other or not by exploiting the depth.