Robust Volatility Forecasts and Model Selection in
Financial Time Series
Luigi Grossi and Gianluca Morelli
∗Dipartimento di Economia, Universit`a di Parma, Italy
Abstract
In order to cope with the stylized facts of financial time series, many models have been proposed inside the GARCH family (e.g. EGARCH, GJR-GARCH, QGARCH, FIGARCH, LSTGARCH) and the stochastic volatility models (e.g. SV). Generally, all these models tend to produce very similar results as concerns forecasting performance. Most of the time it is difficult to choose which is the most appropriate specification. In addition, all these models are very sensitive to the presence of atypical observations. The purpose of this paper is to provide the user with new robust model selection procedures in financial models which downweight or eliminate the effect of atypical observations. The extreme case is when outliers are treated as missing data. In this paper we extend the theory of missing data to the family of GARCH models and show how to robustify the loglikelihood to make it insensitive to the presence of outliers. The suggested procedure enables us both to detect atypical observations and to select the best models in terms of forecasting performance.
Keywords: GARCH models, extreme value, robust estimation. JEL classification: C16, C22, C53, G15.
1
Introduction
Financial returns are generally characterized by small first-order autocorrelation, kur-tosis much higher than that of the normal distribution, slow decay of the autocor-relations of squared observations towards zero and clusters of high volatility (see for example Franses and van Dijk (2000) or Rossi and Gallo (2006)). During the last 20 years many models have been proposed to cope with these stylized facts. The most often used are the generalized autoregressive conditional heteroscedasticity (GARCH) models, introduced independently by Bollerslev (1986) and Taylor (1986) generalizing a specification proposed by Engle (1982) and the autoregressive stochastic volatility model also proposed by Taylor (1986).
∗Despite being the result of a joint work, the computational part should be attributed to Gianluca
Another stylized fact which is often observed in high frequency financial returns is the asymmetric response of volatility to positive and negative changes in prices. The first model which was introduced to cope with this effect is the so called exponential GARCH model introduced by Nelson (1991). This approach has been further devel-oped by Glosten, Jagannathan, and Runkle (1993) and Sentana (1995) who proposed respectively the GJR-GARCH and Quadratic GARCH (QGARCH) specifications. Fi-nally, other extensions of GARCH models are IGARCH (Engle and Bollerslev 1986), FIGARCH (Baillie, Bollerslev, and Mikkelsen 1996), GARCH in mean (Engle, Lilien, and Robins 1987) and LSTGARCH (Gonzalez-Rivera 1998).
In practice all these models tend to produce very similar results as concerns forecast-ing performance. Sometimes, it is difficult to choose which is the most appropriate. In addition, all these specifications are very sensitive to the presence of particular observa-tions. In the last years there have been some papers dealing with outliers in stochastic volatility models (e.g. Muler and Yohai 2002; Franses and Lucas 2004; Zhang 2004; Battaglia and Orfei 2005; Charles and Darn´e 2005).
The purpose of this paper is to develop new methods that can help the user to select among different similar alternative specifications in the “galaxy” of GARCH models. This procedure, which is based on a forward search algorithm (Atkinson and Riani 2000 or Atkinson, Riani, and Cerioli 2004), is robust to the presence of atypical observations. A distinction between this contribution and the previous works on robust GARCH models is that the emphasis was on aggregate statistics and on robustification of standard quantities. For example, Park (2002) suggested replacing iterative LS estimation with least absolute deviation estimation. Muler and Yohai (2002) proposed to replace mean square errors of the standardized observations with the square of a robustτ-scale estimate. In this paper we are concerned with methods which show the effect individual observations (outliers or not) exert on the fitted model. The procedure is based on a series of fits of subsets of increasing size which treat the observations which are outside the subsets as missing. Given that in financial time series all the data are always available and the problem of missing values is absent, this argument has never received particular attention and the software which is regularly used to estimate GARCH models does not allow the possibility of dealing with missing observations (e.g. the Finmetrics module of S-plus). The issue of missing values, however, arises when we have detected some observations as atypical and we do not want them to affect the out-of-sample volatility forecasts, the parameter estimates and so on.
The structure of the paper is as follows. In section 2 we briefly review linear and non linear GARCH models with particular attention to the QGARCH and GJR-GARCH specifications. In section 3 we show how to robustify the parameter estimates of the previous models and provide a unified treatment of missing values in stochastic volatility models. In section 4 we show the additional insight the suggested procedure provides in terms of robust model selection. In section 5 we construct robust confidence envelopes which act as calibratory backgrounds for judging the eventual significance of the jumps we observe during the forward search and show the robustness of the suggested approach when the data are contaminated with outliers. Section 6 contains conclusions and extensions for further research.
2
Linear and nonlinear GARCH models
Let rt be an observed time series of returns, such that rt = log(pt/pt−1) where pt is
a stock price or a stock market index. As it is well known, GARCH models were introduced to capture the volatility clustering of financial returns which is observed on the conditional variance of returns or of residuals in a time series model applied to returns. Formally, we can write the observed time series of returns as the sum of a predictable and an unpredictable part
rt =E[rt|Ωt−1] +εt (1)
where Ωt−1 is the set of all relevant information arrived on the market up to and
including time t−1; εt is conditionally heteroscedastic, that is
εt =ztσt, (2)
where zt ∼ iid(0,1), and E[ε2t|Ωt−1] = σ2t. The linear GARCH(1,1) model can be
written as
σt2 =α0+α1ε
2
t−1 +β1σt2−1, (3)
withα0 >0,α1 >0 andβ1 ≥0 for nonnegativity of conditional variance andα1+β1 <1
for covariance stationarity.
For stock returns, it has been observed that volatile periods are often initiated by a large negative shock which suggests that negative and positive shocks have a differ-ent impact on conditional volatility of subsequdiffer-ent times. This phenomenon called the “leverage effect” is not captured by the linear GARCH models introduced above, be-cause conditional volatility depends only on the squares of the shocks so that positive and negative shocks of the same magnitude have the same effect on the conditional volatility. In this paper we consider two nonlinear models which are able to capture the leverage effect: the model introduced by Glosten, Jagannathan, and Runkle (1993) called GJR-GARCH and the quadratic GARCH (called QGARCH) introduced by Sen-tana (1995). The GJR-GARCH(1,1) model is obtained from the GARCH(1,1) model (3) with a correction which links the parameter ofε2
t−1 to the sign of the shock, that is
σt2 =α0+α1ε2t−1(1−I[εt−1 >0]) +γ1ε2t−1I[εt−1 >0] +β1σt2−1, (4)
where I[·] is an indicator function which equals 1 when the event inside the brackets is true. For nonnegativeness of variance the following conditions must be satisfied: α0 >0, (α1+γ1)/2 and β1 >0. For covariance stationarity (α1+γ1)/2 +β1 <1.
The QGARCH(1,1) model is an alternative way to cope with asymmetric effects of shocks on volatility and is specified as follows:
σt2 =α0+γ1εt−1+α1ε2t−1+β1σt2−1, (5)
where the conditions for covariance stationarity are the same as the corresponding conditions in the GARCH(1,1) model. The additional term γ1εt−1 makes possible an
asymmetric effect of positive and negative shocks on the conditional variance. When γ1 < 0 the effect of negative shocks on σt2 will be larger than the effect of positive
When εt is assumed to be normally distributed, the conditional log-likelihood for
the t-th observation is given by: ℓt(θ) = − 1 2log(2π)− 1 2log(σ 2 t)− ε2 t 2σ2 t , t= 3, . . . , T, (6)
where the vectorθ contains the parameters of the specified model. For example, in the context of the QGARCH model (5), θ= (α0, α1, γ1, β1)T.
The optimal s-step-ahead out-of-sample forecast of the conditional variance can be computed recursively from:
b σ(2T+s)|T = α0 + (α1+β1)σb2(T+s−1)|T GARCH (7) b σ(2T+s)|T = α0 + [(α1+γ1)/2 +β1]σb2(T+s−1)|T GJR−GARCH (8) b σ(2T+s)|T = α0 + (α1+β1)σb2(T+s−1)|T QGARCH. (9)
In practice all these specifications tend to produce very similar results as concerns forecasting performance. Moreover, it is clear from the previous equations that the forecasts can be strongly affected by the presence of atypical observations whose effect propagates recursively. In the next section we show how to robustify the previous mod-els and at the same time not to lose the efficiency of maximum likelihood estimators.
3
Robustification of linear and non linear
GARCH models
In order to robustify the estimates of the parameters of models (3), (4) and (5), we repeatedly fit the forward search algorithm in the way suggested by Atkinson and Riani (2000) and extended to time series by Riani (2004) and Grossi (2004). The algorithm is both efficient and robust. It is efficient because it makes use of the Gaussian likelihood machinery underlying model (6). It is robust because the outliers enter in the last steps of the procedure and their effect on the statistics of interest is clearly depicted. More generally, this approach allows evaluation of the inferential effect each time period, either outlying or not, exerts on the fitted model. The key features of the forward search applied to linear and non linear GARCH models can be summarized as follows.
Choice of the initial subset. We take periods of contiguous observations as the basic sets of our algorithm. These blocks are intended to retain the autocorrelation structure of the whole time series. Confining attention to subsets of continuous observa-tions ensures that the parameters can be consistently estimated within each block. The initial subset can be obtained through least median or least trimmed squares applied to these blocks.
Progressing in the search and diagnostic monitoring. The transformed model is repeatedly fitted to subsets of increasing sizes ignoring contiguity and selected in such a way that outliers are included only at the end of the search. For this reason, in each step of size m, we take as the new subset that formed by the smallest squared one step ahead prediction errors. One major advantage of the forward search over other high-breakdown techniques is that a number of diagnostic measures can be computed and monitored as the algorithm progresses. Given that one of the main purposes of
financial models is to forecast the volatility, it seems natural to monitor the out-of-sample h-step ahead prediction errors as the subset size grows. In each step of the search the observations not forming the subset are treated as if they were missing. The most natural way to replace a missing observation consists in using its optimal predictor (see Harvey and Pierce 1984). In the context of state space models this is equivalent to omit the Kalman filter updating equations for the conditional mean and the conditional variance. The generalization of this argument to the family of linear and non linear GARCH models implies that we have to replace ε2
t with σ2t, the
conditional expectation of ε2t. Thus, given a subset of size m (say Sm∗), if observation
t does not belong to the subset, the conditional variance at time t+ 1 is iteratively computed as follows, depending on the underlying model:
σt2+1|S∗ m = α0+ (α1+β1)σ 2 t|S∗ m GARCH (10) σt2+1|S∗m = α0+ [(α1+γ1)/2 +β1]σt2|S∗m GJR−GARCH (11) σt2+1|S∗ m = α0+sgn(εt−1)γ1σ 2 t|S∗ m+ (α1 +β1)σ 2 t|S∗ m QGARCH (12)
Finally, when the t-th observation is missing, skipping the equation of the condi-tional variance implies modifying the condicondi-tional log-likelihood (6) so that log(σ2
t) = 0
and ε2t 2σ2
t = 1
2. In other words, the resulting log-likelihood for the t-th observation when
it does not belong to the subset is: ℓt(θ) = −
1
2log(2π)− 1
2. (13)
4
Model selection through robust comparison of
the forecasting performance
In this section we show how the suggested procedure can help the user to select, in a robust way, the best model belonging to the GARCH family. In order to illustrate the difficulties we encounter in model selection even when the data do not contain outliers we start with an example with simulated data.
4.1
Simulated data
We have generated a series of 205 observations from a GARCH(1,1) model with pa-rameters α0 = 0.1, α1 = 0.1, β1 = 0.6. To these data we have fitted a GARCH(1,1),
GJR-GARCH(1,1) and QGARCH(1,1) specification1. The additional parameter γ 1
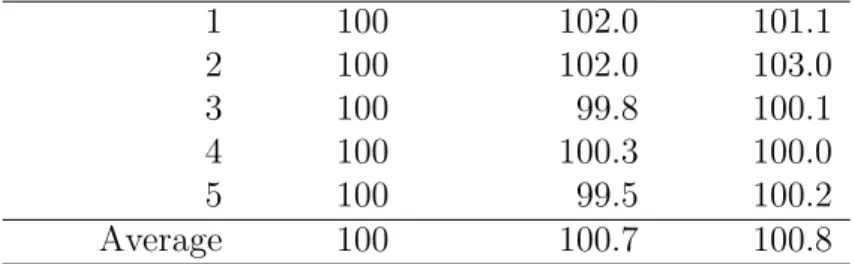
turned out to be significant in both cases. However, given that the true model is GARCH, we expect that this specification should outperform that of the other models. Table 1 shows the ratios of the out-of sample forecasting performance of GJR-GARCH and QGARCH evaluated using MAPE (Mean Absolute Prediction Error) with respect to that of the GARCH model. This index relays on models estimated on the basis of rolling windows of 100 observations (for weekly data it is equivalent to rolling windows
Table 1: Simulated GARCH data: comparison of out-of sample forecasting performance of GARCH, GJR-GARCH and QGARCH using rolling windows MAPE index for 1-to-5 steps forecast horizons and average. Base: GARCH=100
Forecast step GARCH GJR-GARCH QGARCH
1 100 102.0 101.1 2 100 102.0 103.0 3 100 99.8 100.1 4 100 100.3 100.0 5 100 99.5 100.2 Average 100 100.7 100.8
of two years). For example, with a sample of 205 observations, we start with the sub-sample ranging from the first 100 observations. The fitted models are then used to obtain 1-to-5-steps-ahead forecasts of the conditional volatility, that is the conditional volatility of observations 101-105. Next the window is moved 1 step into the future, by deleting the observation at time 1 and adding observation at time 101. The various models are re-estimated on this sample, and are used to obtain forecasts for ε2
t for
time 102 until time 106. This procedure is repeated until the final estimation sample consists of observations from time 101 until time 200. In this way we obtain 100 1-to-5-steps-ahead forecasts of the conditional variance (see Franses and Van Dijk, 2000 for more details). To evaluate and compare the forecasts from the different models, the MAPE is computed, with true volatility measured by the squared realized returns. Table 1 shows the ratio of the MAPE of the nonlinear GARCH models to those of the GARCH model for different forecast horizons. The last row reports the ratio of the MAPE averaged through the different horizons. For example, the value 100.7 in the last row of the column of GJR-GARCH means that the average MAPE from this model is 0.7% greater than the corresponding criteria for forecasts from the linear GARCH model. This table clearly shows that even if the data have been generated by a GARCH model these three specifications give a similar forecasting performance leaving the user with unclear ideas about the best specification. In other words, we have no reasons for considering one model better than the other.
Figure 1 shows the monitoring of one step forecast error (top panel) and two steps ahead forecast error (bottom panel) for observations 201 and 202 for the three alter-native specifications. This figure clearly shows that throughout the search the best performance is given by the GARCH model. The QGARCH model, even if at the end of the search has the best forecasting performance both in terms of one step and two steps forecast horizon, has a curve which always lies above that of the other two models.
The message which comes from the analysis of these simulated data is that even if the series under study does not contain outliers, if we compute the forecasting per-formance on rolling windows the different specifications are likely to have similar fore-casting performance or, even worse, can suggest a wrong model. In the next section we will analyze 3 real financial time series where the above stylized facts are present.
Subset size m One step 160 170 180 190 200 2 4 6 8 10 14 GARCH QGARCH GJR−GARCH Subset size m Two steps 160 170 180 190 200 5 10 15 GARCH QGARCH GJR−GARCH
Figure 1: Monitoring of one step ahead forecast error (top panel) and two steps ahead forecast error (bottom panel) for GARCH, QGARCH and GJR-GARCH model.
4.2
Real financial data
In this section we apply our method of model selection to a series of data sets making use of the expertise and insights gained in analyzing the simulated data. The data we consider are monthly stock prices indices for Italy (MIB storico generale), Japan (TSE TOPIX) and USA (NYSE composite), gained from the OECD database MEI (Main Economic Indicator) downloaded from the websitehttp://lysander.sourceoecd.org. The monthly indices are averages of daily closing quotations. Time series cover the period January 1988 - June 2005 which gives 209 observations. In order to compare price trends in different countries, data are transformed to obtain index numbers with base 2000=100. As can be seen from Figure 2, Japan stock index followed an opposite path with respect to US and Italian stock indexes from 1988:1 to 1998:1, while in the subsequent period began a path very similar to the other stock indexes essentially fol-lowing the US indexes as the indexes in the majority of the developed countries. As it is well known, from 1998 a sharp bull trend started with a high peak in the first months of 2000. In 2001 indexes followed a bearish trend with a relative minimum in September (twin towers attack), while a relative minimum took place in the first few months of 2003. It is interesting to note that the US index shows in the middle of 2005 a level higher than the maximum reached in 2000 while the Japanese and the Italian indexes are only at 70-80% of the 2000 maximum. The corresponding plot of returns (Figure 3) shows that in the Italian case the volatility is larger than that in the other countries. This is confirmed by the presence of a large number of extreme returns in the Italian series (nine months above 10% and two months under -15%) and by the mean of the squared returns which for the Italian index is 29.8 against 10.1 and 21.7 for USA and Japan, respectively. Thus, we expect a worse forecasting performance in the Italian case. We applied to the series of returns the three models presented in
1988 1990 1992 1994 1996 1998 2000 2002 2004 2006 20 60 100 ITALY 1988 1990 1992 1994 1996 1998 2000 2002 2004 2006 20 60 100 US 1988 1990 1992 1994 1996 1998 2000 2002 2004 2006 60 100 160 JAPAN
Figure 2: Stock prices indexes (year 2000 = 100) of Italy (top panel), USA (middle panel) and Japan (bottom panel) during the period January 1988 - June 2005 (monthly data)
section 2.
Table 2 gives the comparison of the GARCH, QGARCH and GJR-GARCH in terms of MAPE indexes when we consider the averages 1-to-4 and 1-to-5 steps forecast horizons using all observations at the end of the search, while Table 3 compare the performance of the three models in temrs of rolling windows MAPE index.
As concerns Italy, this Table 2 and Table 3 point out that the two best specifications seem to be the GARCH and GJR-GARCH. These two models have the same MAPE when we consider the average of 1-to-4 and 1-to-5 step ahead forecast horizons.
Figure 4, which shows the monitoring of average forecast errors from 1-to-4 steps, clearly points out that the GJR-GARCH model has a forecasting performance which is always worse than that of the other two models throughout the search. Only in the final step the curves cross. This is precisely the behaviour we have seen in the previous
1988 1990 1992 1994 1996 1998 2000 2002 2004 2006 −20 0 10 ITALY 1988 1990 1992 1994 1996 1998 2000 2002 2004 2006 −20 0 10 US 1988 1990 1992 1994 1996 1998 2000 2002 2004 2006 −20 0 10 JAPAN
Figure 3: Returns on stock prices index of Italy (top panel), USA (middle panel) and Japan (bottom panel) during the period February 1988 - June 2005
Table 2: Monthly index number of stock prices of Italy, US and Japan: comparison of prediction errors of GARCH, QGARCH and GJR-GARCH models through the MAPE index using all observations (end of the search). Averages for 1-to-4 and 1-to-5 steps forecast horizons. Base: GARCH=100
GARCH QGARCH GARCH-GJR Country MAPE 1-to-5 steps ahead
Italy 100 102.2 100.0
USA 100 94.6 130.0
Japan 100 100.2 133.0
MAPE 1-to-4 steps ahead
Italy 100 101.6 100.0
USA 100 89.2 117.0
Table 3: Italian stock index: comparison of out-of sample forecasting performance of GARCH, GJR-GARCH and QGARCH using rolling windows MAPE index for 1-to-5 steps forecast horizons and average. Base: GARCH=100
forecast step GARCH QGARCH GARCH-GJR
1 100 91.3 91.7 2 100 89.1 91.0 3 100 89.3 91.0 4 100 87.5 90.4 5 100 86.6 89.7 Average 100 88.7 90.8
Table 4: US stock index: comparison of out-of sample forecasting performance of GARCH, GJR-GARCH and QGARCH using rolling windows MAPE index for 1-to-5 steps forecast horizons and average. Base: GARCH=100
forecast step GARCH QGARCH GARCH-GJR
1 100 102.6 115.7 2 100 100.6 113.8 3 100 101.4 115.0 4 100 100.7 120.4 5 100 105.6 123.6 Average 100 102.2 117.7
Table 5: Japanese stock index: comparison of out-of sample forecasting performance of GARCH, GJR-GARCH and QGARCH using rolling windows MAPE index for 1-to-5 steps forecast horizons and average. Base: GARCH=100
forecast step GARCH QGARCH GARCH-GJR
1 100 104.5 105.0 2 100 101.6 104.5 3 100 101.4 103.8 4 100 100.9 103.5 5 100 97.7 102.5 Average MAPE 100 101.2 103.9
Subset size m
Average forecast error
160 170 180 190 200 100 200 300 400 500 600 GARCH QGARCH GJR−GARCH
Figure 4: Stock prices index of Italy: monitoring of average 1-to-4 step ahead squared volatility forecast errors for GARCH, QGARCH and GJR-GARCH model.
Subset size m One step 160 170 180 190 200 0 100 200 300 GARCH QGARCH GJR−GARCH Subset size m Two steps 160 170 180 190 200 200 400 600 GARCH QGARCH GJR−GARCH Subset size m Three steps 160 170 180 190 200 200 400 600 800 GARCH QGARCH GJR−GARCH Subset size m Four steps 160 170 180 190 200 200 400 600 GARCH QGARCH GJR−GARCH
Figure 5: Stock prices index of Italy: monitoring of one, two, three and four steps squared volatility forecast errors for GARCH, QGARCH and GJR-GARCH model.
section when we have analyzed simulated data. Figure 5 shows the monitoring of the forecasting performance for the three models for 1, 2, 3 and 4 steps ahead forecast horizon. In the final step all the curves are very similar making us wrongly think that these three models are equivalent. The forward search on the other hand shows that:
1. The prediction performance of the GJR-GARCH model is always worse than that of the other two specifications;
2. The difference of forecasting performance between the GJR-GARCH and the other two models seems to increase when the forecast horizon increases;
3. The GARCH and QGARCH specifications seem to provide similar prediction er-rors even if the QGARCH seems slightly better.
4. The small difference in performance between GARCH and QGARCH becomes negligible when the forecast horizon increases. As a matter of fact, it is interest-ing to notice that in the central part of the search the solid line associated with the GARCH models becomes closer and closer to the dotted line of the QGARCH specification when the forecast horizon increases.
Let us now consider the series of stock prices indexes of US and Japan. For the United States Table 2 and Table 4 show that the QGARCH model outperforms the GARCH specification at the end of the search, while the rolling windows MAPE in-dicate that the GARCH and the QGARCH specifications are substantially equivalent. The worst fit seems to be given by the GJR-GARCH model. Figures 6 and 7, which show respectively the monitoring of average 1-to-4 step ahead absolute forecast errors and the detail of 1, 2, 3 and 4 forecast errors clearly confirm these conclusions. The curve associated with the Q-GARCH specification is always virtually below that of the other two curves throughout the search. This example has been given to show that sometimes the results which come from the application of traditional methods coincide with what the robust analysis reveals. On the other hand, as in the final example we consider (stock prices index of Japan) the forward search shows that the conclusions which come from the analysis of the final step of the search are not supported by the majority of the data. As concerns Japan, Table 2 and Table 5 makes us conclude that the best specification should be the GARCH model. Figure 8 clearly shows that the average forecast errors of the QGARCH model are always below those of the GARCH except in the final step. The monitoring of the detail of the prediction errors in the first 4 steps clearly shows that even if in the central part of the search the curve associated with the QGARCH is lower, the forecasting performance seems equivalent when it is based on all the observations. Notice that in the final step of the search the two curves associated with GARCH and QGARCH cross in the case of 1 step and 2 step prediction errors, while they become very close to each other for 3 and 4 steps prediction errors.
Subset size m
Average forecast error
160 170 180 190 200 20 40 60 80 GARCH QGARCH GJR−GARCH
Figure 6: Stock prices index of USA: monitoring of average 1-to-4 step ahead squared volatility forecast errors for GARCH, QGARCH and GJR-GARCH model.
Subset size m One step 160 170 180 190 200 0 2 4 6 8 10 GARCHQGARCH GJR−GARCH Subset size m Two steps 160 170 180 190 200 20 40 60 80 100 GARCH QGARCH GJR−GARCH Subset size m Three steps 160 170 180 190 200 0 5 10 15 20 GARCH QGARCH GJR−GARCH Subset size m Four steps 160 170 180 190 200 50 100 150 GARCH QGARCH GJR−GARCH
Figure 7: Stock prices index of USA: monitoring of one, two, three and four steps squared forecast errors for GARCH, QGARCH and GJR-GARCH model.
Subset size m
Average forecast error
160 170 180 190 200 50 100 150 200 GARCH QGARCH GJR−GARCH
Figure 8: Stock prices index of Japan: monitoring of average 1-to-4 step ahead squared volatility forecast errors for GARCH, QGARCH and GJR-GARCH model.
Subset size m One step 160 170 180 190 200 0 20 40 60 80 GARCH QGARCH GJR−GARCH Subset size m Two steps 160 170 180 190 200 50 150 250 350 GARCH QGARCH GJR−GARCH Subset size m Three steps 160 170 180 190 200 0 50 100 200 GARCH QGARCH GJR−GARCH Subset size m Four steps 160 170 180 190 200 0 50 150 250 GARCHQGARCH GJR−GARCH
Figure 9: Stock prices index of Japan: monitoring of one, two, three and four steps squared forecast errors for GARCH, QGARCH and GJR-GARCH model.
Subset size m One step 160 170 180 190 200 0 5 10 15 20 Subset size m Two steps 160 170 180 190 200 0 5 10 15 20 Subset size m Three steps 160 170 180 190 200 0 5 10 15 20 Subset size m Four steps 160 170 180 190 200 0 5 10 15 20
Figure 10: One, two, three and four steps ahead squared forecast errors for contami-nated data with 1%,5%,50%,95%,99% simulation envelopes
5
Envelopes of
h
-step ahead prediction errors for
outlier detection
In order to evaluate the trajectories of the forecast errors which come from the forward search we need to superimpose a calibratory background in order to judge the even-tual significance of jumps. To this purpose we have constructed forward simulation envelopes for different combinations of parameters values, different sample sizes and the three different models described in section 3. In more detail, for a particular sam-ple size and a set of parameter values we have performed 1000 independent forward searches. The data in each simulation have been generated assuming the same specifi-cation. With this calibratory background we can check if the forward search curve for our real data stays inside the bands and in which step it eventually goes out.
In order to better understand how the procedure works we have contaminated the series used in the previous example, adding a level shift of size 5 to 4 consecutive observations in the middle of the sample (observations 150-153). Figure 10 shows one, two, three and four steps ahead forecast errors with 1%,5%,50%,95%,99% simulation envelopes. In the central part of the search, it is possible to notice that the observed forecast error lies very close to the line representing the median of the envelope. As soon as the first outlier enters the subset (subset size m = 197) there is an upward jump which, for example, in the monitoring of one step forecast error is significant at the 1% level. At the end of the search it is possible to observe the well-known masking effect with a sudden decrease of the forecast error. The top left panel of Figure 10 shows that the final value is even below the lower threshold suggesting that there is something wrong.
6
Conclusions
There is an appreciable literature on financial models and the set of models which have been proposed is very wide (e.g. see the books of Gourieroux (1997) and Franses and van Dijk (2000) and the references contained). Generally, all these specifications give the same forecasting performance and it is difficult to choose among them using traditional indexes (e.g. h-step ahead out-of-sample prediction errors or MAPE index based on rolling windows). In this paper we have suggested robust and efficient tools for model selection in stochastic volatility models which show which is the model with the best forecasting performance. The procedure is efficient, because it always uses maximum likelihood estimators and is robust, because is not affected by the presence of atypical observations. Finally we have provided robust envelopes so that the user can have formal tests about the presence of atypical observations. Simulated and real data showed that the procedure can help in selecting the model with the best forecasting performance avoiding the effect of extreme observations. Further research will be devoted to extend the robust model selection procedure to a wider class of nonlinear and to the application to high frequency data.
References
Atkinson, A. C. and M. Riani (2000). Robust Diagnostic Regression Analysis. New York: Springer–Verlag.
Atkinson, A. C., M. Riani, and A. Cerioli (2004). Exploring Multivariate Data with the Forward Search. New York: Springer–Verlag.
Baillie, R., T. Bollerslev, and H.-O. Mikkelsen (1996). Fractionally integrated gener-alized autoregressive conditional heteroskedasticity.Journal of Econometrics 52, 91–113.
Battaglia, F. and L. Orfei (2005). Outlier detection and estimation in nonlinear time series. Journal of Time Series Analysis 26, 107–121.
Bollerslev, T. (1986). Generalized autoregressive conditional heteroskedasticity.
Journal of Econometrics 31, 307–327.
Charles, A. and O. Darn´e (2005). Outliers and GARCH models in financial data.
Economics Letters 86, 347–352.
Engle, R. (1982). Autoregressive conditional heteroskedasticity with estimates of the variance of United Kingdom inflation. Econometrica 50, 987–1087.
Engle, R. and T. Bollerslev (1986). Modelling the persistence of conditional vari-ances. Econometric Reviews (with discussion) 5, 1–50.
Engle, R., D. Lilien, and R. Robins (1987). Estimating time varying risk premia in the term structure: the ARCH-M model. Econometrica 55, 391–407.
Franses, J. D. and D. van Dijk (2000). Non Linear Time Series Models in Empirical Finance. Cambridge: Cambridge Univesity Press.
Franses, P.H., V. D. D. and A. Lucas (2004). Short patches of outliers, ARCH and volatility modelling.Applied Financial Economics 14, 221–231.
Glosten, L., R. Jagannathan, and D. Runkle (1993). On the relation between the expected value and the volatility of the nominal excess return of stocks. Journal of Finance 48, 1779–1801.
Gonzalez-Rivera, G. (1998). Smooth transition GARCH models. Studies in non lin-ear dynamics and econometrics 3, 61–78.
Gourieroux, C. (1997). ARCH Models and Financial Applications. Berlin: Springer Verlag.
Grossi, L. (2004). Analyzing financial time series through robust estimators.Studies in Non Linear Dynamics and Econometrics 8, Article 3.
Harvey, A. and R. Pierce (1984). Estimating missing observations in economic time series. Journal of the American Statistical Association 79, 125–131.
Muler, N. and V. Yohai (2002). Robust estimates for ARCH processes. Journal of Time Series Analysis 23, 341–375.
Nelson, R. (1991). Conditional heteroskedasticity in asset returns: a new approach.
Econometrica 59, 347–370.
Park, B.-J. (2002). An outlier robust GARCH model and forecasting volatility of exchange rate returns.Journal of Forecasting 21, 381–393.
Riani, M. (2004). Extension of the forward search to time series. Studies in Non Linear Dynamics and Econometrics 8, Article 1.
Rossi, A. and G. M. Gallo (2006). Volatility estimation via hidden markov models.
Journal of Empirical Finance 13, 203–230.
Sentana, E. (1995). Quadratic ARCH models. Econometrica 62, 639–661.
Taylor, S. (1986). Modelling Financial Time Series. New York: John Wiley and Sons.
Zhang, B., X. (2004). Assessment of local influence in GARCH processes. Journal of Time Series Analysis 25(2), 301–313.