Cryptovisor: A Cryptocurrency Advisor Tool
matthew baldree
Southern Methodist University, [email protected]
paul widhalm
Southern Methodist University, [email protected]
brandon hill
Southern Methodist University, [email protected]
matteo ortisi
Follow this and additional works at:
https://scholar.smu.edu/datasciencereview
Part of the
Artificial Intelligence and Robotics Commons
,
Databases and Information Systems
Commons
,
Finance and Financial Management Commons
, and the
Other Computer Sciences
Commons
Recommended Citation
baldree, matthew; widhalm, paul; hill, brandon; and ortisi, matteo (2018) "Cryptovisor: A Cryptocurrency Advisor Tool,"SMU Data Science Review: Vol. 1 : No. 2 , Article 3.
Cryptovisor: A Cryptocurrency Advisor Tool
Matthew Baldree, Paul Widhalm, Brandon Hill, Matteo Ortisi
Master of Science in Data Science, Southern Methodist University 6425 Boaz Lane, Dallas, TX 75205
{mbaldree, pwidhalm, bdhill}@smu.edu, [email protected]
Abstract. In this paper, we present a tool that provides trading recommendations for cryptocurrency using a stochastic gradient boost classifier trained from a model labeled by technical indicators. The cryptocurrency market is volatile due to its infancy and limited size making it difficult for investors to know when to enter, exit, or stay in the market. Therefore, a tool is needed to provide investment recommendations for investors. We developed such a tool to support one cryptocurrency, Bitcoin, based on its historical price and volume data to recommend a trading decision for today or past days. This tool is 95.50% accurate with a standard deviation of 0.54%. From our analysis, we conclude that Bitcoin is a unique asset with similarities to gold. As a young asset, it lacks economic fundamentals making it very difficult to predict. By leveraging technical momentum indicators to provide buy, sell, and hold markers or labels, a tool can be developed that performs as good or better than a buy and hold trading strategy in a bear market, bull market or both markets.
1 Introduction
The first cryptocurrency, Bitcoin, based on blockchain technology, is a secure method to make financial transactions was introduced in 2009 [12]. Bitcoin is a peer-to-peer cryptographic digital currency created in 2009 by an unknown person using alias Satoshi Nakamoto [12]. Bitcoin is unregulated and hence comes with benefits (and potentially a lot of issues) such as frictionless transactions and pseudo anonymity. Transactions can be purchased through exchanges or can be ‘mined’ by
computing/solving complex cryptographic/mathematical puzzles [1].
Since 2009, the cryptocurrency market was dominated by Bitcoin with 100% share of the market. In 2011, Litecoin was created as a fork1 of Bitcoin. In 2015, Vitalik
Buterin co-founded Ethereum to be a blockchain technology alternative to Bitcoin. As of March 12, 2018, there are over 1,500 cryptocurrencies traded on 5,400 plus exchanges throughout the world. Collectively, this represents a total market capitalization of $311 billion and a 46-fold ($821B/$18B) increase at its all-time high (ATH) of $821 billion [2]. In 2017, Bitcoin reached an ATH of $19,536 representing a 20-fold ($19,536/$973) price increase. As a comparison, the S&P 500 Index took over forty years to achieve a similar growth. The market has now taken a downturn with a
62% reduction. The stock market has nothing to compare with in terms of this volatility as a stock market price correction and bear marker are signified by a 10% and 30% drop, respectively [23].
The volatility of this new emergent market makes it impossible to forecast. Factors such as regulatory news, investor hype, exchange volatility, and large liquidity sell offs can greatly affect its price [23]. With the recent severe market downturn, it is clear there is no market fundamental economic indicators to provide investors with a way to contextualize price movements. For the market to level out, economic fundamentals must be established. In order to better model cryptocurrency, we need to understand how and why it behaves such as it does. One of the main issues with cryptocurrency is that each currency is built somewhat differently. Unlike fiat currency where the units are backed by the government and it has value because the government says it has value, cryptocurrency has value because others who hold the crypto-coin say it has value. Therefore, financial markets are trying to decide whether cryptocurrencies are a hedge, safe haven or a real currency like the dollar or yen [4].
Recently, mainstream financial institutions like Fidelity are allowing its customers to add cryptocurrencies to their portfolios [3]. In addition, global exchanges like CBOE and CME are offering Bitcoin Futures to their investors allowing them to get Bitcoin price exposure without actually holding it. More cryptocurrency financial vehicles are on the way in 2018 that will provide more liquidity and help establish market fundamentals. In the meantime, the new investor is left with little tools outside of the exchange price and volume time series and marketplace news to make an informed decision.
Investors that do decide to enter this emerging market, ask a common question on social media such as Reddit, “When is a good time for me to buy in the market?” Or, the opposite question will be asked, “When is a good time for me to sell out of the market?” To aid the new investor in making an informed decision and answer these questions, we created a novel cryptocurrency tool, Cryptovisor, that recommends for an investor if he should buy, sell, or hold their investment. This tool is built with a combination of financial technical indicators to label historical cryptocurrency data for optimum time to buy, sell, or hold the asset. Labeling the dataset is a trial and error procedure of adjusting the indicators and algorithm so the trading strategy results are as good or better than a buy and hold trading strategy. With this trading strategy labeled dataset, a stochastic gradient boost classifier was trained on the labeled data and used to predict current or past recommendations. The baseline classifier was then iterated to reduce the required features and not sacrificing accuracy. The result of this exercise reduced the required features from 18 to two with an accuracy improvement of 0.6% and standard deviation of 0.54%.
The advisor tool trained with trading signals identified by an algorithm against a bear market2, bull market3, and both markets with results as good or better than a buy and
hold strategy. Extending this tool with multiple models for various cryptocurrencies will allow an investor to surface new opportunities that they might otherwise ignore or miss4. Investors utilizing this tool will have additional data to incorporate in making
2 A bear market is prolonged decline in market price over a period of time. 3 A bull market is prolonged increase in market price over a period of time. 4 This extension is left as a future exercise.
investment decisions in cryptocurrency market. The rest of the paper is structured as follows. Section 2 provides background of cryptocurrency. Section 3 provides details about the cryptocurrency market and provides a visualization of the market structure for Bitcoin. Section 4 provides background of sentiment analysis. Section 5 describes our Cryptovisor tool. Section 6 details the data used in the research. Section 7 provides the results of our research. Section 8 analyzes the results. Section 9 discusses the ethics. We draw the relevant conclusions in Section 10 and discuss future work in Section 11.
2 Cryptocurrency
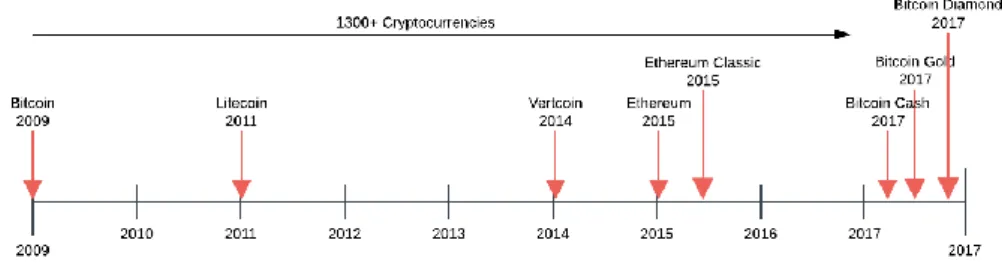
Cryptocurrency is an asset designed to be used as digital currency. The asset is a chain of digital signatures that exist in binary format secured by cryptography with the right to use [17]. There are two kinds of assets in the cryptocurrency world; i.e., coin and token. Both assets may be acquired and traded on public exchanges and used in the exchange of goods and services. Coins are more general purpose and require more effort to create and support the ecosystem. Tokens run on top of a platform such as Ethereum and are designed for a specific ecosystem such as eSports. The reference cryptocurrency is Bitcoin, the largest and oldest coin, see Fig. 1 for a timeline that includes Litecoin, Vertcoin, Ethereum, and their subsequent forks, if any. There are more than 1,500 cryptocurrencies to date and all are not shown on the timeline.
Fig. 1. Cryptocurrency timeline.
Since the 1990s, numerous cryptographers and companies have repeatedly attempted to create digital currencies to compete with cash and credit. These attempts failed because their solutions were not substantially better than the current state due to several factors. 1) They relied on cryptographic certificates to tie parties to real-life identities. The hassle to acquire, install and use these certificates lowered the utility of these systems and therefore adoption. 2) They wanted merchants to adopt this new technology as opposed to going directly to consumers. Incumbent solutions are entrenched and have money to defend their marketplace. 3) They solved the “double
-spend” problem through a third-party clearinghouse adding cost and time to the process. With all these systems, they added innovation but did not improve the whole user experience as still required a network of trust [13].
In 2008, after almost two years of development, an anonymous person or group under the alias “Satoshi Nakamoto” released a white paper describing the production
of a peer-to-peer electronic cash system named Bitcoin [12]. This system allowed irreversible, secure, digital payments directly between parties through a non-trusted network built on cryptographic proof-of-work. Transactions are assembled and hashed by bitcoin nodes or miners that use CPU power to solve cryptographic puzzles for coin and or transaction rewards by adding blocks to the ledger creating the blockchain. Miners have incentive to be honest which keeps the network secured and introduces coins to the marketplace. With Bitcoin, a maximum of 21 million coins will be minted. The network also rewards miners with fees which offset lack of coin rewards. Rewarded miners may sell or trade their coins for goods and services. The network is secure as long as there are 51% honest nodes on the network5.
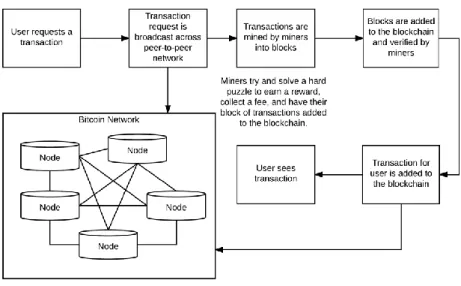
The Bitcoin network broadcasts all new transactions to all nodes on the peer-to-peer network. Nodes may come and go as they please and the active nodes collect new transactions into a block and work to solve a computational puzzle or proof-of-work (POW) for its block. Nodes will compete to work on the next block for a reward by extending the longest ledger. When a node solves the puzzle, the node will broadcast its block to all nodes on the network. The block will be accepted by the network if all transactions are valid and are not already spent and prevents double-spending. Today there are many derivatives of Bitcoin, but the main principles of a decentralized peer-to-peer digital currency network remain the same, see Fig. 2 [12].
Fig. 2. Cryptocurrency workflow.
5 If an entity collects 51% of the hashing power, they are able to mine faster than everybody else.
This allows an entity to double spend on the network by mining their own blocks without announcing them to the network. The double spend case here is the rogue entity spends currency on the public chain but does not include it on the private blockchain. The longer blockchain is accepted by the network with nodes that do not include the rogue public spend.
The process to acquire cryptocurrencies usually entails signing up with an exchange, proving who you are6 and submitting assets to the exchange to credit your account.
The assets could be other cryptocurrencies or fiat currency. After submitting assets, the exchange will credit your account and you may then submit buy and sell orders into the marketplace through market or limit orders. A market order authorizes the exchange to make the trade on your behalf. A limit order places the order in an order book waiting
for the order’s criteria to be met. The liquidity of an asset in the exchange can affect the volatility in pricing. Large purchases on exchanges can run up the price from 1% to 10% because the exchange does not have enough liquidity or amount of assets to satisfy the order without bumping up the price. In addition, cryptocurrencies are traded across many exchanges further reducing the liquidity of the asset. Large trades could exhaust
an exchange causing a “flash crash” similar to the one experience by GDAX in June of
2017. On that day, a multi-million dollar sell order caused the price of Ethereum to drop 99.9% within a second. The steep drop triggered cascading stop loss orders until the price reached $0.10 within a second. This price volatility is one of the main barriers to cryptocurrency adoption [13].
Exchanges make money through transaction fees that include converting between assets and supporting the inflow and outflow of assets such as the US dollar fiat from
trader’s exchange wallets. The trader may move their assets off the exchange to other exchange wallets or even their own local wallet.
The exchange of digital assets is performed by digital wallets which is an application that supports storing and sending a digital asset such as bitcoin. Wallets can be single purposed for a single asset or multi-purposed like the Jaxx wallet. Wallets store public and private key pairs. The public key is the address you use to send and receive assets. The private key is used to claim your assets on the blockchain. Transferring money or digital assets is a transfer of ownership between parties on the public blockchain ledger. A major security risk with these wallet is losing your private keys. If these are lost, then you have lost ownership of your assets.
3 Cryptocurrency Market
To determine if Bitcoin can be considered an asset class similar to the world’s
government-backed currencies, Bitcoin would need to satisfy three questions. 1) Can it be used as a medium of exchange? 2) Can it be used as a unit of comparability between two goods, and 3) can store value over time [4]? Price fluctuations in Bitcoin and other cryptocurrencies are dependent on both internal and external factors [4]. The internal factors are supply and demand but since the supply is deterministic this means that the only internal driver on price is the demand for Bitcoin. External factors affecting the price of Bitcoin is its adoption rate and how it is being used as an investment vehicle. In the short-term, Bitcoin acts as a safe-haven investment and in the long run acts as a hedge [4].
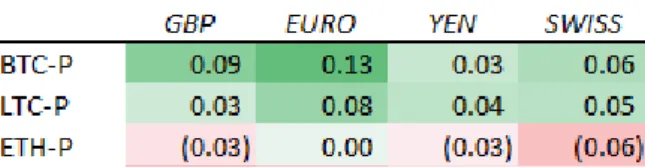
We analyzed correlations between Bitcoin and other assets and modeled various foreign exchange rates to determine their influence on the price of crypto-coins, see Fig. 3. Interestingly, Bitcoin and Litecoin are positively correlated with various fiat
currencies (as compared to the US dollar) while Ethereum is slightly negatively
correlated with the same currencies. Ethereum is a ‘smart contract’ cryptocurrency
while Bitcoin and Litecoin are conventional cryptocurrencies. We also reviewed the correlation of the cryptocurrencies with gold and found that the cryptocurrencies are negatively correlated to the price movements in gold, see Fig. 4. Investors appear to be utilizing Bitcoin more as an asset to hold value to hedge against other markets. Although individuals do use Bitcoin as a currency, on a larger scale it is being used as a hedge asset.
Bitcoin has not yet proven that it can store value, but it is used for exchange of goods or services and is also used as a measure to compare goods. Bitcoin has met two of the three necessary conditions asked when determining if an investment vehicle is an asset class. Future analysis may show that it can also store value but due to the infancy of the currency, it is too early to tell. Market correlations show that crypto-currency may be primed to be an asset class all by itself once it can also be shown that it meets all of the necessary criteria.
Fig. 3. Correlation matrix of cryptocurrencies (Bitcoin, Litecoin and Ethereum Price) and fiat between Jan. 2017 and Mar. 2018.
Fig. 4. Correlation matrix of cryptocurrencies (Bitcoin, Litecoin and Ethereum Price) and gold between Jan. 2017 and Mar. 2018.
4 Sentiment Analysis
Our research has not found a significant work in sentiment analysis focused on the cryptocurrency market. Therefore, we leveraged knowledge from numerous sentiment analysis papers focused on the stock market index. “As more and more personal opinions are made available online, recent research indicates that analysis of online text such as blogs, web pages, and social networks can be useful for predicting different economic trends [16].” Sentiment analysis is performed using various data sources such as Twitter, Google and Yahoo search trends, or message boards/blogs such as Reddit. These studies look for trends from publicly available tools to understand the public’s
sentiment in order to directionally predict the stock market. Similarly, we desired to use a similar approach to predict the cryptocurrency market.
Each sentiment analysis design follows a very similar maturity pattern. First, it seeks to gather a consistent data source that meets the frequency in which the prediction method requires. This feed typically comes from an application program interface (API)
provided by the data source. Modern API’s makes it somewhat trivial to capture transactional data through the API subscription.
Second, the data retrieved through the API is filtered using terms that identify the different exchanges such as names, IPO ticker symbols, or associated businesses. This allows for a much more efficient processing because it only processes transactions that are relevant to the data requirements of the research. At his point in the maturity process one can utilize the change in overall traffic at any point in time as an indicator of sentiment change. This is what we consider to be a simple sentiment measure.
Third, comes the identification of opinion and weighting of each sentiment instance within the social traffic. There are various ways to identify and weight each instance, but a common theme is to utilize a lexicon of financial terms to determine whether the opinion/text should be reviewed as positive or negative. This is necessary because as
noted, “the Harvard dictionary is not structured for the vocabulary of traders. [15].” The researcher can use other attributes provided by the API for times searched, number of followers of the poster, etc. We now have a mature sentiment measure.
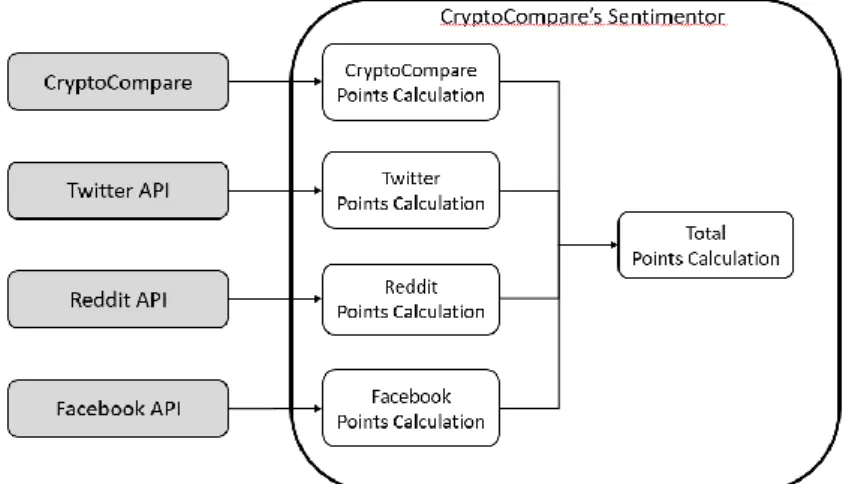
Due to challenges faced with sourcing necessary amounts of data from the public social tool APIs especially Reddit, our research relied on CryptoCompare’s sentiment engine, see Fig. 5. This sentiment engine falls into the “simple sentiment” measure
classification as it measures traffic without weighting the content within the traffic. The implementation of the sentimentor is left as a future work item.
Fig. 5.Sentimentor diagram: CryptoCompare’s Social Analysis
5 Cryptovisor
–
A Cryptocurrency Advisory Tool
Machine learning cryptocurrency markets is hard because they are inherently unpredictable and lack fundamentals [24]. Hype around cryptocurrency, follow the herd7, liquidity, and large investors play a major role in price fluctuation. This wild
fluctuation causes inconsistent data distribution making it near impossible for the train
and test datasets to have similar distributions8. Other factors come into play when the
data is at various scales; e.g., daily, hourly, or minute. Data sampling less than a day is influenced by high frequency trading or algorithmic trading. Opening and closing prices have their own patterns. News and rumors happen at any time and are a driving force to multi-day horizons. In the end, you do not know what will happen tomorrow as no one has a complete picture at any point in time. With ever changing data and partial information, we chose not to predict price but instead develop a tool to recommend or advise a trade decision based on historical observable buy and sell signals. We call such a tool, Cryptovisor.
Cryptovisor is an advisory or recommendation tool for a cryptocurrency investor to query current or past periods for a buy, sell, or hold position regarding one to many cryptocurrencies. The tool is trained on past historical pricing and volume information and labeled for ideal buy, sell, and hold positions based on an algorithm(s) utilizing leading and lagging financial technical indicators.
A technical indicator is any class of metrics whose value is derived from generic price activity in a stock or asset [19]. There are two kinds of technical indicators, leading and lagging, that try to predict the future or general price direction of a security by looking at past patterns. Leading indicators signal future events. Lagging indicators follows an event. The importance of a lagging indicator is its ability to confirm that a pattern is occurring. There are many, many indicators. For this paper, two popular indicators, relative strength indicator (RSI) and Bollinger bands (BB), are used to determine a trading strategy [20]. Through trial and error, the indicators were adjusted to fit the pattern of Bitcoin close price for a one-hour data sampling resolution. An algorithm was developed to incorporate both indicators to determine a trading strategy of buy, sell, or hold. This strategy was then applied to buy or sell the asset and the result compared to a buy and hold strategy.
The resulting labeled data for one-hour closing price trading strategy was then used to train a stochastic gradient boosting machine learning algorithm [21] to predict buy, sell, or hold strategy based on the time series closing price and volume plus derived data. In addition, a feature ranking and example decision tree plots are provided for deeper understanding [22].
8 If the test data distribution is very different than train, then you will be challenged to accurately
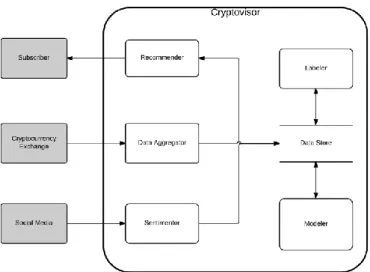
Fig. 6. Cryptovisor system diagram.
The Cryptovisor tool is an envisioned system comprised of six main components, see Fig. 6. This paper focuses on two components: labeler and modeler. The labeler
component reads in the cryptocurrency data and up samples or down samples it appropriately. In this particular case, the data was already at the desired frequency of a one-hour time period. Next, the data is time sliced for modeling and fitted with Bollinger Bands (BB) technical indicators. BB are volatility lines created from a close price moving average (1) and its standard deviation (2). The bands are defined by (3), (4), and (5). N is the number of days to compute the moving average. Next, Relative Strength Indicator (RSI) is calculated. RSI is a momentum oscillator that measures speed and change of price movements between zero and 100, see (6). N is the average days up or down closes. Next, lags are calculated for each attribute and the trading algorithms (7) and (8) are applied. The trading signals are generated followed by the returns and compared with a buy and hold strategy to ensure trading signals yield comparable results. A comprehensive chart is generated to allow for results investigation. Finally, the labeled data plus calculated data is saved for input into the modeler. . (1) . (2) . (3)
. (4) . (5) . (6) . (7) . (8)
The modeler component reads in labeled data, cleans it, and separates out features from the labels. A stochastic gradient boost classifier, XGBoost, is then trained with a stratified 5-fold cross validation to determine accuracy. Next, the importance of the features is plotted for examination. Features are then pruned to yield the simplest model without sacrificing accuracy for maximum usability. This simplified model is then used to provide a trading strategy for past and current time period for the desired cryptocurrency.
After a recommender is defined, the process is repeated for other cryptocurrencies. With a set of recommenders, the investor can request a batch recommendation for today or past days. Next, a subscription service can be built allowing investors to subscribe to recommendation services to notify them at set time intervals. An aggregator would read exchange data at hourly intervals and stored the data in the data store for modeling or prediction. For maximum performance, each recommender would require regular training and evaluation to ensure it is performing as well or better than a buy and hold strategy.
6 Data
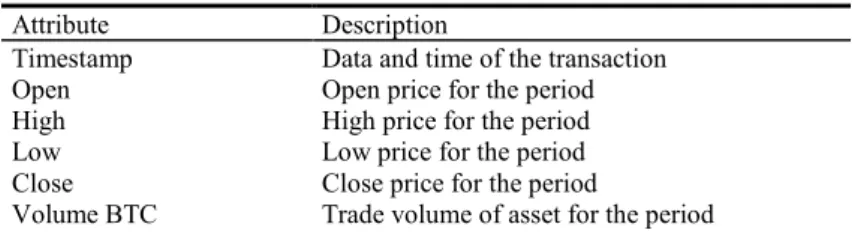
The historical pricing data for Bitcoin was obtained from CryptoCompare’s API from October 3, 2016 to February 10, 2018 at one-hour resolution [18]. The hourly sampling allowed us to sample 82 days of data yielding 12,001 data points at maximum time span. The raw Bitcoin data in Table 1 is read by the labeler component generating Table 2 output data. The modeler component reads in the data from Table 2 and fits a model to it and classifies a record as buy, sell, or hold.
In an effort to determine the optimal set of parameters for the labeler, a scenario grid was established to run through many scenarios and output results. See Table 3 for the bear market scenario grid used and the best parameter. This scenario grid in
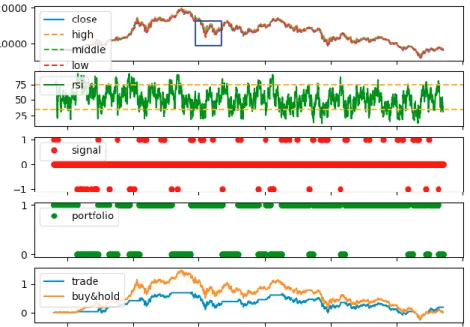
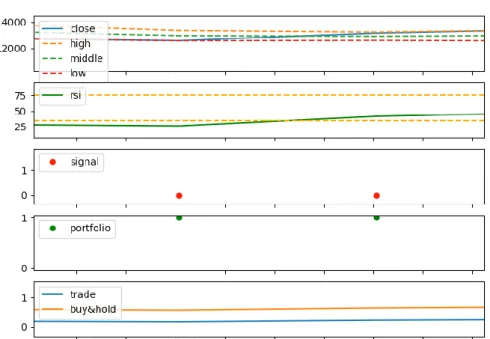
combination resulted in 323 scenarios. The output from the trading algorithm was visually inspected and tuned to ensure maximum accuracy against the historical close price, see Fig. 7 and Fig. 8. The following time span data sets were used for modeling: bear market – November 20, 2017 to February 2, 2018, bull market – July 1, 2017 to October 31, 2017, and both markets – July1, 2017 to February 2, 2018.
Table 1. Exchange dataset read into labeler component. Attribute Description
Timestamp Data and time of the transaction Open Open price for the period High High price for the period Low Low price for the period Close Close price for the period
Volume BTC Trade volume of asset for the period
Table 2. Calculated dataset by labeler component. Attribute Description
Bollinger High BB mid plus standard deviation Bollinger Mid BB n-periods moving average Bollinger Low BB mid minus standard deviation RSI Relative strength indicator for n-periods Close Lag 1 Close price for previous period Bollinger High Lag 1 BB high for previous period Bollinger Mid Lag 1 BB mid for previous period Bollinger Low Lag 1 BB low for previous period RSI Lag 1 RSI for previous period Close Lag 2 Close price two periods back Bollinger High Lag 2 BB high two periods back Bollinger Mid Lag 2 BB mid two periods back Bollinger Low Lag 2 BB low two periods back RSI Lag2 RSI two periods back Signal Buy, sell, or hold indicator Portfolio Bought or sold asset
Trading Return Trading period return on asset Buy & Hold Return Buy & sell period return on asset Trading Cum Return Trading cumulative return on asset Buy & Hold Cum Return Buy & sell cumulative return on asset
Table 3. Bear market scenario grid.
Parameter Values Best Value BB Period 3, 4, 5 4
RSI Period 7, 8, 9 8 BB STD DEV 1.3, 1.4, 1.5 1.3 Buy RSI Trigger 30, 35, 40, 45 35 Sell RSI Trigger 70, 75, 80 75
Fig. 8. Zoom in area of the close price from labeler component showing close price with BB in the top row, RSI with buy and sell targets in the second row, buy and sell signal points in the third row, portfolio strategy in fourth row, and strategy results in fifth row.
7 Results
For bear market data set, there was around 2,000 trading signals over a three-month period, the labeler component identified 1.31% of them as sell signals and 2.62% of them as buy signals, see Table 3. The labeler then used these trading signals to build a portfolio and compared its returns with a buy and hold strategy, see Table 4. Our trading strategy for the bear market beat the buy and hold strategy in an annualized return by 1.173 and Sharpe Ratio by 0.43.
The generated data and label set from the labeler was then read into the modeler
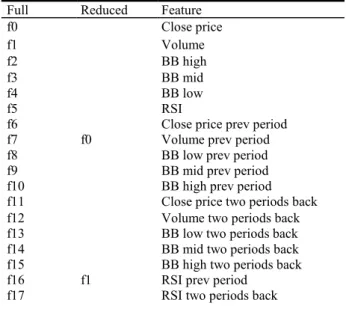
component to learn the trading signals through a 5-fold cross validation. The modeler was trained with an accuracy of 94.89% and a standard deviation of 1.95%. The contribution of the features and their importance to classifying the label is shown in Fig. 9. In an effort to determine the minimal features required to recommend, the features were then pruned from 18 down to two. This step yielded an accuracy of 95.50% with a standard deviation of 0.54%. This is an improved accuracy of 0.61%. See Fig. 10 for final features and Table 5 for translation of f{#}. See Fig. 11 for the
modeled classifier’s decision tree used to classify feature data f0 and f1 into a buy, hold, or sell class.
Table 3. Bear market signal results from labeler component.
Attribute Total Percentage
Hold 1,908 96.07%
Buy 52 2.62%
Sell 26 1.31%
Table 4. Bear market portfolio results from labeler component.
Summary Trade Buy & Hold
Return 1.18 0.007
Sharpe Ratio9 (Rf=0%) 1.26 0.83
Table 5. Features used to model the classifier for full model and reduced model. Full Reduced Feature
f0 Close price f1 Volume f2 BB high f3 BB mid f4 BB low f5 RSI
f6 Close price prev period
f7 f0 Volume prev period
f8 BB low prev period
f9 BB mid prev period
f10 BB high prev period
f11 Close price two periods back
f12 Volume two periods back
f13 BB low two periods back
f14 BB mid two periods back
f15 BB high two periods back f16 f1 RSI prev period
f17 RSI two periods back
9 Sharpe ratio is a way to normalize returns for the risk that was taken to achieve them, with
higher values being better. It is calculated here as the annualized return divided by the annualized volatility, so we are using a zero-risk free rate.
Fig. 9. Full list of features used to model signals for bear market data set. F16, RSI previous period, is the most important feature.
Fig. 10. Reduced list of features used to model signals for bear market data set. F1, RSI previous period, is the most important feature.
Fig. 11. Reduced features classifier decision tree created by the classifier for a bear market. The decision tree is interpreted as follows: if (Prev RSI)<75.2086, then label else if (Prev Vol)<6000.81 then if (Prev RSI)<75.4507 then label else classify else if (Prev Vol)<6523.07 label else label.
8 Analysis
We performed an analysis of the cryptocurrency market and portfolio results. For market analysis, we analyzed cryptocurrencies with market indices, gold, and fiat for correlation to determine the behavior of Bitcoin. For portfolio, we analyzed our bear market results against bull market and both market data sets. We did not perform an analysis of sentiment as we were unsuccessful in creating a mature sentiment measure.
8.1 Market Analysis
Cryptocurrencies currently behave like a separate asset class, although closer to a hedge such as gold. Market movements of the S&P 500 and NASDSAQ indices are far removed from being similar with cryptocurrencies. This is also true with fiat currencies, investors do not appear to utilize them in the same manner as cryptocurrency. In comparison, gold moves closely with cryptocurrencies while not directly related. The Nikkei market shows a slight connection to Ethereum which is a smart contract-type cryptocurrency. The Nikkei has a slight relation to the price of Ethereum (ETH-P) and
gold’s price movement is somewhat related to cryptocurrencies. Fiat currencies are
completely unrelated which would be expected. The correlation between these assets are shown in Fig. 12. See Fig. 13 for a zoomed in view of the relationship between cryptocurrencies, treasury, gold and crude oil prices. In this view, you can see that there is no direct correlation with commodity asset classes to cryptocurrencies. The thicker the line, the stronger the correlation. In Fig. 14, the relationship between fiat currencies and cryptocurrencies is mapped emphasizing the point that investors view cryptocurrency more like gold and not fiat currencies at this point in time. Because gold is used to hedge volatile markets, it would make sense that gold too is not correlated with fiat currencies. In Fig. 15, the relationship between the markets and cryptocurrency shows a slight relationship between the Nikkei index and Ethereum and the dissimilarity between the main markets. Finally, in Fig. 16, the relationship between various sentiment indicators and cryptocurrencies shows that the price of the coins does not appear to be related to the various sentiment movements, their trade volumes are close but not directly related.
Remark 1. BTC-P = Bitcoin price, LTC-P = Litecoin price, ETH-P = Ethereum price, BTC-V = Bitcoin volume, LTC-V = Litecoin volume, and ETH-V = Ethereum volume. Line colors indicate clusters and the thickness of the lines indicate the strength of the correlation.
Fig. 12. Cryptocurrencies correlation with fiat currencies and market indices.
Fig. 13. Zoomed in view of the relationship between cryptocurrencies, treasury, gold and crude oil prices.
Fig. 14. Relationship that fiat currencies have with cryptocurrencies.
Fig. 16. Modeler sample decision tree for minimal features.
8.3 Portfolio Analysis
The work performed for bear market yielded promising results. Therefore, the exercise was repeated for bull market and both markets effectively creating a back-testing strategy. Data sets for all exercises are listed in Table 6. Each exercise was parameterized creating hundreds of scenarios. The best parameter for each exercise is shown in Table 7. Best set of parameters were determined if the trading strategy produced at least 1% buy signals and Sharpe Ratio was as good or better than buy and hold strategy leveraging algorithm (7) and (8). The best results for each exercise is
shown in Table 8. For bull market exercise, trading strategy’s Sharpe Ratio beat buy and hold’s Sharpe Ratio by 0.13. For bear market exercise, trading strategy’s Sharpe
Ratio beat buy and hold’s Sharpe Ratio by 0.43. For both markets, trading strategy’s
Sharpe Ratio was as good as buy and hold strategy at (0.01). Table 6. Market time periods.
Market Time period
Bull 2017-07-01 to 2017-10-31 Bear 2017-11-20 to 2018-02-10 Both 2017-07-01 to 2018-02-10
Table 7. Bull, bear and both bull and bear market best parameters. Parameter Bull Bear Both
BB Period 5 4 5
RSI Period 9 8 7
BB STD DEV 1.3 1.3 1.5 Buy RSI Trigger 45 35 40 Sell RSI Trigger 80 75 80
Algorithm 1 1 1
Table 8. Bull, bear and both bull and bear market best results.
Summary Bull Trade Bull B&H Bear Trade Bear B& H Both Trade Both B&H
Return 13.66 16.78 1.18 0.007 5.17 5.96 Sharpe Ratio (Rf=0%) 3.67 3.54 1.26 0.83 2.16 2.17
9 Ethics
Determining how to govern/steward cryptocurrencies is an evolving topic involving multiple ethical concerns. As noted in previous research, the adaption of this technology by nature brings the global society into a "new era of openness, decentralization, and global inclusion [7]." What does governance/stewardship look like for this open, global, decentralized resource with various levels of transaction anonymity? This collective challenge is of concern to us in this research. We intend to give a better understanding of the ethical concerns pertaining to each listed component of the challenge equation (open, global, decentralized, and anonymous transactions), as well as inform on current efforts to address these concerns.
9.1 Financial Action Task Force (FAFTA)
One organization that has taken notice of this collective challenge is the Financial
Action Task Force (FATF). This organization “is an independent inter-governmental body that develops and promotes policies to protect the global financial system against money laundering, terrorist financing and the financing of proliferation of weapons of mass destruction. The FATF recommendations are recognized as the global anti-money laundering (AML) and counter-terrorist financing (CFT) standard [8]. FATF published its first report in 2013 providing an initial guidance to online alternative currencies. In
the report, the organization notes that “given the developing nature of alternate online
9.2 Open
Cryptocurrencies are “open” because of their public, decentralized ledgers. “Because
the blockchain is massively replicated by mutually-distrustful peers, the information it contains is public [10].” The source code for these currencies are open source meaning they are readily available to the public and the ledgers themselves are maintained by
public miners. “No one can hide a transaction, and that makes Bitcoin more traceable than cash [14].” This openness is where the ethical risk comes into play. With the
“secret sauce” of each cryptocurrency being open it is far easier to reverse engineer to
deduce information such as account balances and spending habits of the identities within the blockchain. With this public information, entities could learn about these transactions and try to exploit the market for their gain.
9.3 Global / Decentralized
Bitcoin’s network is not hindered by international borders. FAFT who are focused on
money laundering and terrorist financing abuse prioritized this characteristic when noting potential risks because cryptocurrencies allow for cross-border payments and
funds transfers. In their report, they state, “customer transaction records may be held
by different entities, often in different jurisdictions, making it more difficult for law
enforcement and regulators to access them”. Today, criminals will locate their business in “jurisdictions with weak AMF/CFT regimes” to money launder [15]. With cryptocurrencies, criminals just need to worry about converting fiat to crypto-coin and onto the network. The distributed ledger allows users to access their funds anywhere as long as they can access the internet.
A decentralized network means there is no central oversight body for cryptocurrencies. The current maturity level of governance/stewardship of this technology is similar to the early days of the internet as noted by the Tapscotts. FATF
is concerned that lack of a central “trusted” authority to regulate and generate currencies
will lead to exploits.
9.4 Anonymity
Anonymous transactions mean “the participants in transactions are not explicitly
identified: both the sender(s) receiver(s) are identified solely by a pseudonym, and participants in the system can use many different pseudonyms without incurring any meaningful cost [9].” This capability of the system makes it very challenging for an organization to govern the financial industry from money launderers and terrorists not to mention capital gains tax evaders.
10 Conclusions
The crypto-currency market is volatile and in its infancy. This environment is risky for individual investors and the current tools these investors have to employ to help them
make crypto-currency investment decisions is limited. In this paper we have presented a tool, Cryptovisor, that is 95.5% accurate in determining the buy, sell or hold trading strategy for Bitcoin in a bear market and outperformed baseline buy and hold strategy in both bear and bull markets. The tool performed as well as buy and hold strategy for both markets. Cryptovisor uses a stochastic gradient boost classifier trained from a model labeled by an algorithm using multiple technical indicators to identify buy, sell and hold positions. While the tool shows promise, it has not been fully tested across a range of data windows to ensure it is not biased.
The crypto-market lacks market fundamentals because it is a very young asset with limited tools and market history. Through our research we have seen that the crypto market behaves differently than any other market. It is different from traditional commodities or equity market assets. Bitcoin and other crypto-currencies show signs of being a hedge against the equity market, similar to the commodity gold. Investors are utilizing the crypto-market differently and need tools to navigate the investment field of crypto-currency.
We have also seen that sentiment analysis shows signs of being a key indicator in Bitcoin trends. The chatter in the social online environments tend to precede large spikes or valleys in Bitcoin. In the future, adding sentiment trend analysis to the
Cryptovisor investment tool will further enhance the tool’s capabilities.
11 Future Work
Future work in this project would include adding additional technical indicators10 to
determine which ones provide the most value in determining a trading strategy. In addition, modeling other cryptocurrencies would be interesting to determine the difference in parameters for between currencies. The decision tree output was different between markets. What would be the effect if the sample windows were many? How would the decision trees change? Is there a common pattern between all these models? Once a best algorithm is determined, automating the data flow is important to track the success of the prediction against the actual market.
For the sentimentor component, we propose to expand on the scope of
CryptoCompare’s sentiment sources to include search engine trends. In addition, we would focus on enhancing the Points calculation scope to include a “mature sentiment”
measure by weighting the instances within the sentiment traffic.
References
1. Shah, D., Zhang, K.: Bayesian regression and Bitcoin. Department of EECS, MIT. (2014) 2. Coin Market Cap. https://coinmarketcap.com.
3. Stern, H: Fidelity Labs Tests Digital Asset Wallet On Fidelity.com. April, 25, 2018. https://www.reuters.com/article/us-fidelity-investments-bitcoin/fidelity-allows-clients-to-see-digital-currencies-on-its-website-idUSKBN1AP0AO
4. Poyser, O.: Exploring the Determinants of Bitcoin’s price, an application of Bayesian
Structural Time Series. June 2017.
5. Cazalet, Z., Roncalli, T.: Facts and Fantasies About Factor Investing. October 2014.
6. Fletcher, T., Hussain, Z., Shawe-Taylor, J.: Currency Forecasting using Multiple Kernel Learning with Financially Motivated Features. NIPS 2010 workshop: New Directions in Multiple Kernel Learning (2010).
7. Tapscott D., Tapscott A. (2017). Realizing the Potential of Blockchain. A Multistakeholder Approach to the Stewardship of Blockchain and Cryptocurrencies: Whitepaper. Retrieved from World Economic Forum website:
8. Financial Action Task Force on Money Laundering. FATF report (2014). http://www.fatf- gafi.org/media/fatf/documents/reports/Virtual-currency-key-definitions-and-potential-aml-cft-risks.pdf
9. Meiklejohn, S., Pomarole, M., Jordan, G., Levchenko, K., McCoy, D., Voelker, G. M., & Savage, S.: A fistful of bitcoins. Proceedings of the 2013 conference on Internet measurement conference - IMC '13. doi:10.1145/2504730.2504747
10. Sasson, E. B., Chiesa, A., Garman, C., Green, M., Miers, I., Tromer, E., & Virza, M.: Zerocash: Decentralized Anonymous Payments from Bitcoin. 2014 IEEE Symposium on Security and Privacy. doi:10.1109/sp.2014.36
11. Narayanan, A., et al.: Bitcoin and Cryptocurrency Technologies. Princeton University Press (2016).
12. Nakamoto, S. Bitcoin: A Peer-to-Peer Electronic Cash System. Bitcoin.org (2009).
13. “International Journal of Business Management and Commerce”, “An Analysis of
Cryptocurrency, Bitcoin, and the Future” Vol 1 No 2, Sept 2016
14. Biryukov, A., & Pustogarov, I. (2015). Bitcoin over Tor isnt a Good Idea. 2015 IEEE Symposium on Security and Privacy. doi:10.1109/sp.2015.15
15. Gholampour, V.: What Can We Learn from Stock Market Tweets? SSRN Electronic Journal (2017). doi:10.2139/ssrn.3041880
16. Smailović, J., Grčar, M., Lavrač, N., & Žnidaršič, M.: Predictive Sentiment Analysis of
Tweets: A Stock Market Application. Human-Computer Interaction and Knowledge Discovery in Complex, Unstructured, Big Data, 77-88 (2013). doi:10.1007/978-3-642-39146-0_8
17. Buntinx, JP.: Digital Assets vs Cryptocurrencies. May 17, 2017.
18. Zielak. Coinbase Bitcoin Historical Data. Kaggle, https://www.kaggle.com/mczielinski/bitcoin-historical-data/data.
19. Troiano, L., & Kriplani, P. (2011). Supporting trading strategies by inverse fuzzy transform. Fuzzy Sets and Systems,180(1), 121-145. doi:10.1016/j.fss.2011.05.004
20. Stock Technical Analysis with Python, https://www.udemy.com/stock-technical-analysis-with-python/.
21. Chen, T., & Guestrin, C. (2016). XGBoost. Proceedings of the 22nd ACM SIGKDD International Conference on Knowledge Discovery and Data Mining - KDD 16. doi:10.1145/2939672.2939785 .
22. F. Pedregosa, G. Varoquaux, A. Gramfort, V. Michel, B. Thirion, O. Grisel, M. Blondel, P. Prettenhofer, R. Weiss, V. Dubourg, J. Vanderplas, A. Passos, D. Cournapeau, M. Brucher, M. Perrot, and E. Duchesnay. Scikit-learn: Machine learning in Python. Journal of Machine Learning Research, 12:2825–2830, 2011.
23. What Is a Stock Market Correction? - The New York Times. (n.d.). Retrieved from https://www.bing.com/cr?IG=37DE2F1BC5B64BD2906EE06A8E320C63&CID=2D0266A FD49963E824216D72D5366229&rd=1&h=6E4ijyT7g_uEbjmuDLcTNh0adiKXNeMohrZf
H9Lc9z8&v=1&r=https://www.nytimes.com/2018/02/08/business/stock-market-correction.html&p=DevEx.LB.1,5069.1
24. Vo, N. N., & Xu, G. (2017). The volatility of Bitcoin returns and its correlation to financial markets. 2017 International Conference on Behavioral, Economic, Socio-cultural Computing (BESC). doi:10.1109/besc.2017.8256365