PREDICTING
METHANE
EMISSION OF
DAIRY COWS
USING MILK
COMPOSITION
PREDIC
TING METHANE EMIS
SION OF D
AIR
Y C
O
W
S U
SING MILK C
OMPOSITION
SANNE VAN GASTELEN
SANNE V
AN GAS
TELEN
PROPOSITIONS
1. A ‘one-size fits all’ indicator for methane emission that can be measured in bovine milk
is not achievable. (this thesis)
2. Counterintuitively, combining indicators for methane emission that can be measured
in bovine milk does not result in a better estimation of methane emission of dairy cows fed a wide range of roughage-based diets.
(this thesis)
3. The second challenge of interdisciplinary research is understanding each other’s jargon,
concepts, and reasoning.
4. Reviewers of scientific articles are sometimes like children – you should not want to
win every battle.
5. Introducing yourself as a biologist comes with unrealistic expectations.
6. To derive more robust conclusions from animal research, stimulating their natural
behavior is needed, which counteracts with the reduction in the number of animals used.
7. Typical driving behavior is contrary to evolutionary beneficial behavior.
Propositions belonging to the thesis, entitled
Predicting methane emission of dairy cows using milk composition Sanne van Gastelen
Predicting methane emission of
dairy cows using milk composition
Thesis committee Promotor
Prof. Dr W.H. Hendriks Professor of Animal Nutrition Wageningen University & Research Co-promotors
Dr J. Dijkstra
Associate professor, Animal Nutrition Group Wageningen University & Research
Dr K.A. Hettinga
Associate professor, Food Quality and Design Group Wageningen University & Research
Other members
Prof. Dr B. Kemp, Wageningen University & Research
Dr H. Soyeurt, University of Liège, Gembloux Agro-Bio Tech, Belgium Dr E. Negussie, Natural Resources Institute Finland (Luke), Finland Dr J. Heck, FrieslandCampina, the Netherlands
This research was conducted under the auspices of the Graduate School of Wageningen Institute of Animal Science (WIAS).
Predicting methane emission of
dairy cows using milk composition
Sanne van Gastelen
Thesis
submitted in fulfillment of the requirements for the degree of doctor at Wageningen University
by the authority of the Rector Magnificus, Prof. Dr A.P.J. Mol,
in the presence of the
Thesis Committee appointed by the Academic Board to be defended in public
on Friday 22 December, 2017 at 1.30 p.m. in the Aula
Sanne van Gastelen
Predicting methane emission of dairy cows using milk composition, 266 pages.
PhD thesis, Wageningen University, Wageningen, the Netherlands (2017) With references, with summaries in English and Dutch
ISBN 978-94-6343-709-7 DOI 10.18174/425382
Tables of contents
Chapter 1 General introduction 7
Chapter 2 Prediction of methane emission from lactating dairy cows using milk fatty
acids and mid-infrared spectroscopy
19
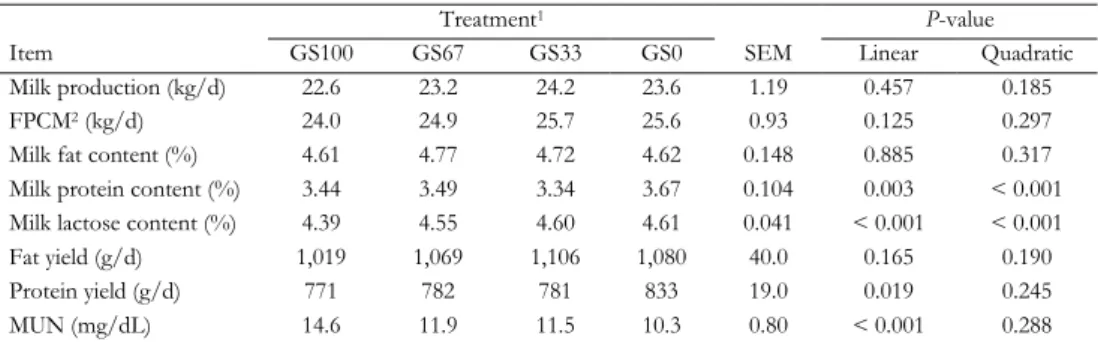
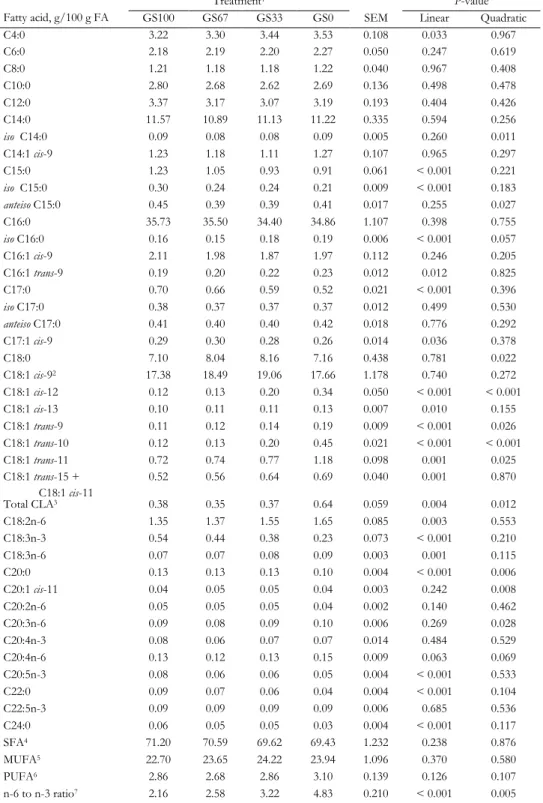
Chapter 3 Enteric methane production, rumen volatile fatty acid concentrations, and
milk fatty acid composition in lactating Holstein-Friesian cows fed grass silage- or corn silage-based diets
33
Chapter 4 Milk metabolome relates enteric methane emission to milk synthesis and
energy metabolism pathways
53
Chapter 5 Relationships between methane emission of Holstein Friesian dairy cows
and fatty acids, volatile metabolites and non-volatile metabolites in milk 79
Chapter 6 The relationship between milk metabolome and methane emission of
Holstein Friesian dairy cows – metabolic interpretation and prediction potential
101
Chapter 7 Linseed oil and DGAT1 K232A polymorphism: effects on methane
emission, energy and N metabolism, lactation performance, ruminal fermentation, and rumen microbial composition of Holstein-Friesian cows
147
Chapter 8 Short communication: The potential of milk fatty acids to predict enteric
methane production in dairy cows – the effect of linseed oil and DGAT1 K232A polymorphism
181
Chapter 9 Predicting enteric methane emission of dairy cows with milk
Fourier-transform infrared spectra and gas chromatography-based milk fatty acid profiles
191
Chapter 10 General discussion 217
Summaries 241
English summary 242
Nederlandse samenvatting 245
List of abbreviations 249
Acknowledgements 253
About the author 259
Curriculum vitae 260
Overview of scientific publications 261
Chapter 1
ENTERIC FERMENTATION
The rumen harbors a diverse microbial population comprising mainly bacteria, protozoa, fungi, and archaea. These microbes reside in the rumen symbiotically with the host and grow through the process of microbial fermentation of feed ingested by the host, also called enteric fermentation. With this process, ruminants are able to effectively turn human inedible biomass, such as coarse plant material, into high quality protein in the form of milk and meat for human consumption (Gerber et al., 2015).
Enteric fermentation occurs in the gastrointestinal tract of ruminants, predominantly within the rumen (~87%) and to a small extent in the large intestines (~13%) (Murray et al., 1976). Microorganisms in the rumen hydrolyze protein and carbohydrates into amino acids and sugars, which in turn are fermented into amongst others volatile fatty acids (VFA), hydrogen
(H2), and carbon dioxide (CO2). The VFA are partly absorbed through the rumen wall and are
the main energy supply required for maintenance and productive functions of the ruminant (Boadi et al., 2004). As a final step, methanogenic archaea generate metabolic energy in the form
of ATP for their maintenance and growth, by forming methane (CH4) using mainly CO2 and H2
(Ellis et al., 2008; McAllister and Newbold, 2008). This process of methanogenesis is essential for a good performance of the rumen because it assures a low concentration of H2 in the rumen, allowing the ruminal microbial population to function under optimal conditions to support the continuation of substrate fermentation (McAllister and Newbold, 2008). Van Lingen et al. (2016) however demonstrated that not all main fermentation processes, viz. glucose fermentation pathways, are controlled by the ruminal concentrations of H2. The CH4 produced by the ruminal methanogens is predominately released into the environment through eructation and breath, and as a greenhouse gas (GHG) significantly contributes to global warming.
THE ENVIRONMENTAL IMPACT OF ENTERIC FERMENTATION Methane is, together with CO2 and nitrous oxide, one of the three main GHG and has a global warming potential of 28 CO2 equivalents (Myhre et al., 2013). Methane originates from natural sources, such as wetlands, and from anthropogenic sources, such as natural gas production, landfills, and agriculture (Lassey, 2008). The livestock sector was estimated to be responsible for approximately 14.5% of total global anthropogenic GHG emissions (Gerber et al., 2013). Enteric fermentation is the main source of GHG emissions from dairy cattle, representing 46% of the total emissions in the dairy supply chain (Gerber et al., 2013). Furthermore, based on the expected farming and consumer lifestyle practices, global CH4 emissions from enteric fermentation is expected to increase by 70% in 2055, compared with 1995 (Popp et al., 2010). This makes enteric CH4 emission one of the main targets of the GHG mitigation objectives of the dairy cattle sector (Hristov et al., 2013a). At present, there are several strategies to mitigate CH4 emissions. For example, increased animal productivity, which can be achieved through improvements in animal genetics, feeding, reproduction, health, and overall management, may allow a reduction of the number of animals needed to maintain constant output with a reduced CH4 emission (Hristov et al., 2013a). Additionally, several altered feeding strategies as well as other farm management practices are available to mitigate CH4 emissions, which have been extensively reviewed by, for example, Hristov et al. (2013a,b), Montes et al.
GENERAL INTRODUCTION (2013), and Knapp et al. (2014). The effect of a mitigation strategy may vary depending on the unit in which enteric CH4 production can be expressed. See Textbox 1 for a description of the different units to express enteric CH4 production.
TECHNIQUES TO QUANTIFY AND MEASURE ENTERIC METHANE PRODUCTION
Accurate and repeatable measurements of CH4 emission from individual dairy cows are required to assess the efficacy of possible mitigation strategies, to decrease uncertainties associated with national GHG inventories, and to develop protocols for genetic selection for cows with reduced CH4 emission (Hammond et al., 2016). There are several techniques to estimate or measure enteric CH4 production of dairy cows, including mathematical models, the in vitro gas production technique, and several in vivo measurement techniques.
A wide range of mathematical models have been developed to estimate CH4 emission from ruminants using nutrient intake data as input. These include dynamic mechanistic models, which estimate CH4 emission based on a representation of microbial fermentation processes that occur in the rumen and hindgut, and empirical (or statistical) models, which relate nutrient intake to CH4 emission directly (Bannink et al., 2011). Dynamic mechanistic models may be more successful in predicting observed variation in CH4 emission than empirical models, but they require detailed dietary inputs which may not be commonly available at the national level or at the individual farm level (Alemu et al., 2011). Because mechanistic models have, in comparison with empirical models, a more detailed representation of the underlying mechanisms of microbial activity and methanogenesis, they have an advantage in terms of evaluating the effectiveness of CH4 mitigation options that may be implemented on farm. Empirical models are however very useful because of their simplicity and ease of use. The accuracy of empirical models to evaluate specific dietary mitigation measures is generally lower than that of mechanistic models because no diet specific information is included. Subsequently, use of empirical models may introduce errors into the accounting of mitigation measures in inventories of GHG emissions and lead to incorrect mitigation recommendations (Ellis et al., 2010).
Various techniques are available to measure CH4 emission. The in vitro gas production technique has been widely used to evaluate the nutritive value of feeds for ruminants, and in the last decade to assess the CH4 production potential of different feeds as well (Yáñez-Ruiz et al., 2016). As recently reviewed by Yáñez-Ruiz et al. (2016), in vitro and in vivo results, however, are poorly related. Therefore, in vitro CH4 production results with well-buffered and standardized fermentation conditions should be interpreted with care and may not reflect the in vivo CH4 production. According to Yáñez-Ruiz et al. (2016), for the in vitro gas production technique, one should only use rumen fluid from donor animals that were fed the same diet as incubated or should be of similar nutrient composition, because using rumen fluid from adapted versus non-adapted animals significantly affects in vitro CH4 production. The importance of using rumen fluid of adapted animals has also been demonstrated by Klop et al. (2017). However, as demonstrated by Hatew et al. (2015), even inoculum obtained from specifically adapted animals may still lead to a large difference between CH4 production observed in vitro and in vivo.
Text box 1. Different units to express enteric methane production
There is currently limited consensus on which unit of CH4 emission to use for evaluating the CH4 mitigation potential of altered feeding strategies or for lowering the carbon footprint of milk production through genetic selection (Negussie et al., 2017). It could be either of the three units CH4 production, CH4 yield, or CH4 intensity. When referring to CH4 production, the typical unit is mass (g) or volume (L) per unit of time (e.g., day), per animal. The obvious problem with this unit of CH4 emission is that it is highly correlated with the dry matter intake (DMI) of the animal (De Haas et al., 2017). Most of the CH4 production originates from enteric fermentation, hence more fermentation due to a higher DMI will increase the total CH4 production per day. Additionally, CH4 production is also highly correlated with the production trait of interest: in sheep or beef, meet production; in dairy, milk production (De Haas et al., 2017). A higher milk yield is often associated with a higher DMI (Garnsworthy et al., 2012), and, as already explained above, a higher DMI is often associated with a higher daily CH4 production (e.g., Hristov et al., 2013). Hence, a positive association between milk yield and CH4 production exists in dairy cows.
For breeding purposes, CH4 production might be the best phenotype of CH4 emission to breed for (Lassen and Løvendahl, 2016; De Haas et al., 2017; Negussie et al., 2017). Not only does it represent the direct goal, namely the trait of interest which needs to be improved (Herd et al., 2013), but also the most correct way to breed for reduced CH4 emission, because the relationship with feed intake or milk production could be accounted for by including these in the final selection index or scheme (De Haas et al., 2017; Negussie et al., 2017). It is however questionable whether it might be more effective or accurate to directly use feed intake-corrected CH4 emission or milk production-corrected CH4 emission (e.g., CH4 yield or CH4 intensity) as the breeding goal.
When referring to CH4 yield, the typical unit is g or L of CH4 per kg DMI. To exclude the effect of feed intake in the expression of CH4 emission, Dijkstra et al. (2011) proposed that the evaluation of nutritional mitigation strategies should be based on CH4 production relative to feed intake as this avoids the confounding effect of DMI. There are, however, uncertainties in measuring DMI at the farm level, making an accurate relation of CH4 to DMI difficult in practice (Bannink et al., 2011). In addition, the nutritional value of feed can affect animal productivity despite a similar DMI. Therefore, another unit of expression refers to CH4 intensity (g or L of CH4 per unit of product yield). The CH4 intensity for dairy cattle is usually expressed as CH4 production per unit of fat- and protein-corrected milk. As clearly demonstrated by Warner et al. (2015), CH4 intensity takes the value and characteristics (i.e., digestibility) of gross energy intake by dairy cows into account, illustrating that this unit of CH4 emission has great value. In the context of global food supply and efficient use of resources it is important to consider the latter two units, CH4 yield and CH4 intensity, in particular.
GENERAL INTRODUCTION The need for high throughput measurements of enteric CH4 emission has led to the development of a variety of approaches for measuring this emission in vivo, many of which have been reviewed by Hammond et al. (2016). Enclosure techniques, tracer gas, and short-term measurements are among those techniques and are briefly described below. The open-circuit respiration chambers are a 'gold standard' in terms of accuracy and precision under the condition that they are routinely calibrated and gas recovery approximates 100% (Hammond et al., 2016). However, CH4 measurements are conducted under highly controlled conditions which do not exist under practical farming. Additionally, the costs of construction and operation are high and the throughput capacity of the system is limited, making this technique unsuitable for large scale measurements. Therefore, alternative high throughput measurement techniques have been developed.
A commonly used CH4 measurement technique is the sulfur hexafluoride (SF6) tracer
technique; a technique suitable for penned as well as free ranging and grazing animals (Hammond et al., 2016). Although the SF6 tracer technique allows for measurement of CH4 emission from many individual animals whilst in their natural environment, the SF6 tracer technique provides a mean CH4 emission that can differ from that obtained for the same animals in respiration chambers (Hammond et al., 2016). Also, within- and between-animal variation is larger when using the SF6 tracer technique for dairy cattle compared to the respiration chamber technique (Grainger et al., 2007). More recently, however, Deighton et al. (2014) demonstrated that a modified SF6 tracer technique (e.g., a constant sample collection rate) reduced errors associated with SF6 release, sample collection, and analysis. Therefore, these authors concluded that their modified SF6 tracer technique can be an accurate and versatile research tool for
measuring CH4 emission of ruminants. Relative to the climate respiration chambers, the SF6
tracer technique has a higher throughput in terms of animal measurements obtained relative to time and cost, but this technique is labor intensive and dependent on implementation and technical skill to minimize experimental error (Hammond et al., 2016).
Other techniques that have been developed involve the short-term measurement of CH4 emission with spot measurements of exhaled CH4 at certain time points (e.g., at milking or during feeding). These techniques are usually automated, non-invasive, and non-intrusive, allowing a high throughput of animals, such as the GreenFeed system, so-called ‘sniffer’ techniques, CH4:CO2 ratio techniques, and the handheld laser CH4 detector (Hammond et al., 2016). Methane emission from an animal is, however, not constant throughout the day, with diurnal patterns affected by the diet, feed allowance and feeding pattern. The timing and duration of sampling of the short-term measurement techniques is therefore critical for accuracy as well as precision, and there is in principle a high potential of biased measurement (or estimates derived from those measurements) of CH4 emission. Hence, serious concerns regarding the accuracy, repeatability, and precision of the data obtained with such short-term measurement techniques exist (Hammond et al., 2016).
PROXIES
As described above, in the last few years efforts have been made to develop direct, reliable, and low-cost measurement techniques for CH4 emissions of individual animals. However, progress has not been as fast as desired, mainly because direct measurement of CH4 on an individual-animal basis is still difficult and expensive (Pickering et al., 2015). This has stimulated researchers to look for proxies for CH4 emission of dairy cattle as alternatives for direct CH4 measurement techniques.
Proxies for CH4 emission of dairy cows are indicators or indirect traits that are correlated with enteric CH4 production. There are several criteria that a proxy needs to adhere to, in order to actually be valuable. From a technical point of view, it is important that a proxy is both accurate and precise when estimating CH4 emission. Accuracy refers to how closely the model-predicted value(s) is (are) to the true observed value(s). If a proxy is not accurate, it could result in a biased prediction (over- or underprediction) of CH4 emission and thus systematically deviates from the reality (Tedeschi, 2006). Precision refers to the magnitude of the scatter around the average mean. If a proxy is not precise, the proxy is most likely not able to detect differences among model predictions (Tedeschi, 2006). Ideally, in terms of accuracy and precision, the proxy should be able to estimate CH4 emission of both individual cows and of dairy herds, with a certain level of robustnesst (also accurate and precise CH4 estimates under different dietary regimes, environmental condition, farming systems, and so on), to support farmers in their management to reduce CH4 emission. If the precision and accuracy of such proxies is satisfactory, they might serve as the much-needed alternative to expensive direct CH4 measurements. To achieve this, a proxy should also be valuable from a practical points of view, such as easy to measure at relatively low costs on a large scale. These practical issues can be assigned to the attributes simplicity, costs, invasiveness, and throughput (Negussie et al., 2017). Simplicity refers to the ease with which proxies can be measured. Costs refer to all costs associated with the measurement of the proxy, including the costs of construction, operation, and analysis. Invasiveness is the intensity of animal handling that is required to measure the proxy, and throughput is the number of observations within in a given period per animal.
Negussie et al. (2017) assessed existing potential proxies for CH4 emissions of dairy cows both in terms of statistical and practical aspect, including proxies related to (1) feed intake and feeding behavior, (2) rumen function, metabolites, and microbiome, (3) milk production and composition, (4) hindgut and feces, and (5) measurements at the level of the whole animal (e.g., body condition score, body weight, and lactation stage). To illustrate, results of Negussie et al. (2017) indicate that proxies based on samples from the rumen or related to rumen sources are poorly to moderately related to enteric CH4 production (i.e., statistical aspect). Moreover, these proxies were considered too costly and difficult for routine on-farm implementation (i.e., practical aspect). Proxies related to body weight, milk yield, and milk composition (e.g., milk fatty acids) appeared to be moderately to highly accurate predictors of enteric CH4 production (i.e., statistical aspect) and are relatively simple, inexpensive, and easy to implement in practice (i.e., practical aspect). Hence, one can imagine that latter type of proxies are more suitable proxies for CH4 emission than the rumen related proxies. In particular, milk mid-infrared spectroscopy is a promising proxy; accurate, cheap, and easily implemented in routine milk analysis at no extra
GENERAL INTRODUCTION cost (Negussie et al., 2017). The latter authors emphasized that no single proxy may accurately predict enteric CH4 production, and that combining proxies may be the best way forward. Combining proxies for CH4 emission will allow improved description of independent sources of variations in CH4 emissions and result in the most accurate prediction of CH4 emissions in dairy cows (Negussie et al., 2017). Examples of combinations of proxies include prediction of CH4 emission based on diet-specific milk fatty acid composition or milk mid-infrared spectroscopy combined with lactation stage.
It is important to note though that enteric CH4 production is influenced by many factors, including dietary factors (such as the type and the amount of feed), animal factors (such as milk yield, body weight, activity, lactation stage, and genetic traits), management factors (such as feeding frequency), and environmental factors (such as seasons and temperature) (e.g., Hristov et al., 2013a,b). These factors together result in large variation in CH4 emission of dairy cattle, making it a challenge to develop a universal CH4 proxy.
RESEARCH OBJECTIVES
As outlined above, proxies might serve as a good alternative to quantify CH4 emission of dairy cattle. Therefore, the general objective of the PhD study described in this thesis was to develop a proxy for CH4 emission that can be measured in milk of dairy cows. To this end, a large range of chemical analyses was performed on milk samples obtained from cows fed a wide range of roughage-based diets while housed in climate respiration chambers. These data on milk composition were subsequently used to examine relationships between the chemical composition of milk and the CH4 emitted by the cows. This PhD study builds further on a CH4 prediction model recently proposed by Dijkstra et al. (2011) which is exclusively based on the fatty acid composition of milk. It is hypothesized that the addition of other metabolites in this prediction model will enhance its predictive power and thus will lead to a better indicator in milk for enteric CH4 production of dairy cows. For the identification of these components (i.e., fatty acids, volatile metabolites, and non-volatiles metabolites) in milk, gas chromatography, gas chromatography-mass spectroscopy, and nuclear magnetic resonance equipment, respectively, were required. These techniques are, however, not suitable for large-scale measurements. Therefore, to apply the indicator in practice, a method based on Fourier-transform infrared spectroscopy has been used in this PhD study as well. Overall, the specific objectives of this PhD study were:
1. to quantify the relation between enteric CH4 production and individual milk fatty acids,
volatile metabolites, and non-volatile metabolites based on data of dairy cows fed diets with increasing amounts of corn silage at the expense of grass silage;
2. to determine the CH4 prediction potential of milk fatty acids alone, volatile metabolites
alone, non-volatile metabolites alone, and the combination of these three component groups;
3. to determine the CH4 prediction potential of milk Fourier-transform infrared
4. to evaluate the robustness of the established relationships between enteric CH4 production and milk fatty acids, volatile metabolites, and non-volatile metabolites upon linseed oil supplementation in the diet of dairy cows with a different DGAT1 K232A polymorphism.
The research presented in this thesis was part of the TI Food and Nutrition project entitled 'Reduced methane emissions of dairy cows' (see Textbox 2 for a brief project description).
Textbox 2. TI Food and Nutrition program Reduced methane emissions from dairy cows: towards sustainable dairy cattle production by increased understanding of genetic variation and rumen functioning
This multi-disciplinary project aimed to increase our knowledge regarding CH4 emission by dairy cows in order to decrease the ecological footprint of dairy production and to contribute to the goal of a 30% decrease in greenhouse gas emission from the Dutch dairy sector by 2020. For this purpose, a proxy for CH4 emission from individual cows based on milk metabolite composition was developed, with the use of data from climate respiration chamber experiments originating from the Dutch 'Low Emission Animal Feed' research program. Another proxy was developed based on gases expelled by cows, and was used to explore the genetic variation in CH4 emission between cows. These two proxies can be used as simple and inexpensive quantification tools for estimating enteric CH4 emissions from dairy cattle under field conditions. The understanding of processes related to CH4 production has increased by characterization of the composition and functioning of micro-organisms and the metabolites produced in the rumen of the cow in response to feed composition and diurnal patterns of feed intake. The interaction between diet, microbiome composition, and genotype of animals has been explored to obtain a more holistic understanding of factors affecting ruminal CH4 production. Various modeling approaches have been applied to improve the systematic understanding of rumen fermentation. These approaches and their results provided a profound basis for relating CH4 production to feeding regime and feed composition.
The multidisciplinary project team was comprised of experts in Animal Breeding and Genetics, Animal Nutrition, Dairy Science and Technology, and Microbiology. The team was based at Wageningen University and collaborated with researchers from the industrial parties CRV, Lely Industries, and Qlip. Financial support was obtained from the Centraal Bureau Levensmiddelenhandel (CBL), Cooperative cattle improvement organization CRV, Federatie Nederlandse Levensmiddelen Industrie (FNLI), Lely Industries NV, Dutch Ministry of Economic Affairs, Qlip BV, Wageningen University & Research, and ZuivelNL.
GENERAL INTRODUCTION OUTLINE OF THE THESIS
The research in this thesis focuses on the development of a proxy for CH4 emission that can be measured in milk of dairy cows. Chapter 2 provides an overview of recent research that relates milk fatty acids with CH4 emission, and discusses the opportunities and limitations of using milk mid-infrared spectroscopy to estimate CH4 emissions of dairy cattle. Chapter 3 describes the effects of replacing grass silage with corn silage on enteric CH4 production, rumen VFA concentrations, milk production, and milk composition including the fatty acid profile. Based on the data from the experiment described in Chapter 3, the relation between enteric CH4 production and individual volatile metabolites and non-volatile metabolites is quantified and described in Chapter 4. Chapter 5 describes the CH4 prediction potential of milk fatty acids alone, volatile metabolites alone, non-volatile metabolites alone, and the combination of these three (also using data from the experiment described in Chapter 3). In Chapter 6, the relation between enteric CH4 production and the individual milk metabolites as well as the CH4 prediction potential of the milk metabolites is described, using a larger dataset comprising 6 experiments and a wide range of roughage-based diets. Chapter 7 describes the effect of dietary linseed oil, the DGAT1 K232A polymorphism, and their interaction, on enteric CH4 production, rumen VFA concentrations, milk production, and milk composition including fatty acid profile. In Chapter 8 the robustness is evaluated of the relationship between enteric CH4 production and the fatty acids, volatile metabolites, and non-volatile metabolites in milk, upon linseed oil supplementation in the diet of dairy cows with a different DGAT1 K232A polymorphism. In Chapter 9, the CH4 prediction potential of milk Fourier-transform infrared spectroscopy is determined and compared with the prediction potential milk fatty acids. Finally, Chapter 10 comprises a general discussion of the results in this thesis, including suggestions for future research, and providing general conclusions on the applicability and development of milk proxies for enteric CH4 emission.
REFERENCES
Alemu, A. W., J. Dijkstra, A. Bannink, J. France, and E. Kebreab. 2011. Rumen stoichiometric models and their contribution and challenges in predicting enteric methane production. Anim. Feed Sci. Technol. 166-167: 761-778.
Bannink, A., M. W. van Schijndel, and J. Dijkstra. 2011. A model of enteric fermentation in dairy cows to estimate methane emission for the Dutch National Inventory Report using the IPCC Tier 3 approach. Anim. Feed Sci. Technol. 166-167:603-618.
Boadi D, C. Benchaar, J. Chiquette, and D. Masse. 2004. Mitigation strategies to reduce enteric methane emissions from dairy cows: update review. Can. J. Anim. Sci. 84:319-335.
De Haas, Y., M. Pszczola, H. Soyeurt, E. Wall, and J. Lassen. 2017. Invited review: Phenotypes to genetically reduce greenhouase gas emission in dairying. J. Dairy Sci. 100:855-870.
Deighton, M. H., S. R. O. Williams, M. C. Hannah, R. J. Eckard, T. M. Boland, W. J. Wales, and P. J. Moate. 2014. A modified sulphur hexafluoride tracer technique enables accurate determination of enteric methane emissions from ruminants. Anim. Feed Sci. Technol. 197:47-63.
Dijkstra, J., S. M. van Zijderveld, J. A. Apajalahti, A. Bannink, W. J. J. Gerrits, J. R. Newbold, H. B. Perdok, and H. Berends. 2011. Relationships between methane production and milk fatty acid profiles in dairy cattle. Anim. Feed Sci. Technol. 166-167:590-595.
Ellis, J. L., J. Dijkstra, E. Kebreab, A. Bannink, N. E. Odongo, B. W. McBride, and J. France. 2008. Aspects of rumen microbiology central to mechanistic modelling of methane production in cattle. J. Agric. Sci. 146:213-233.
Ellis, J. L., A. Bannink, J. France, E. Kebreab, and J. Dijkstra. 2010. Evaluation of enteric methane prediction equations for dairy cows used in whole farm models. Glob. Change Biol. 16:3246-3256.
Garnsworthy, P. C., J. Craigon, J. H. Hernandez-Medrano, and N. Saunders. 2012. Variation among individual dairy cows in methane measurements made on farm during milking. J. Dairy Sci. 95:3181-3189.
Gerber, P. J., H. Steinfeld, B. Henderson, A. Mottet, C. Opio, J. Dijkman, A. Falcucci, and G. Tempio. 2013. Tackling climate change through livestock: a global assessment of emissions and mitigation opportunities. Food and Agriculture Organization of the United Nations (FAO), Rome.
Gerber, P. J., A. Mottet, C. I. Opio, A. Falcucci, and F. Teillard. 2015. Environmental impacts of beef production: Review of challenges and perspectives for durability. Meat Sci. 109:2-12.
Grainger, C., T. Clarke, S. M. McGinn, M. J. Auldist, K. A. Beauchemin, M. C. Hannah, G. C. Waghorn, H. Clark, and R. J. Eckard. 2007. Methane emissions from dairy cows measured using the sulfur hexafluoride (SF6) tracer and chamber techniques. J. Dairy Sci. 90:2755-2766.
Hammond, K. J., L. A. Crompton, A. Bannink, J. Dijkstra, D. R. Yáñez-Ruiz, P. O’Kiely, E. Kebreab, M. A. Eugène, Z. Yu, K. J. Shingfield, A. Schwarm, A. N. Hristov, and C. K. Reynolds. 2016. Review of current in vivo measurements techniques for quantifying enteric methane emission from ruminants. Anim. Feed Sci. Technol. 219:13-30.
Hatew, B., J. W. Cone, W. F. Pellikaan, S. C. Podesta, A. Bannink, W. H. Hendriks, and J. Dijkstra. 2015. Relationship between in vitro and in vivo methane production measured simultaneously with different dietary starch sources and starch levels in dairy cattle. Anim. Feed Sci. Technol. 202:20-31.
Herd, R. M., S. H. Bird, K. A. Donoghue, P. F. Arthur, and R. S. Hegarty. 2013. Phenotypic associations between methane production traits, volatile fatty acids and animal breeding traits. Pages 286-289 in Proc. Assoc. Advmt. Anim. Breed. Genet., Napier, New Zealand. AAABG, Massey University, Palmerston North, New Zealand. Hristov, A. N., J. Oh, J. L. Firkins, J. Dijkstra, E. Kebreab, G. Waghorn, H. P. S. Makkar, A. T. Adesogan, W. Yang, C.
Lee, P. J. Gerber, B. Henderson, and J. M. Tricarico. 2013a. Mitigation of methane and nitrous oxide emissions from animal operations: I. A review of enteric methane mitigation options. J. Anim. Sci. 91:5045-5069. Hristov, A. N., T. Ott, J. Tricarico, A. Rotz, G.Waghorn, A. Adesogan, J. Dijkstra, F. Montes, J. Oh, E. Kebreab, S. J.
Oosting, P. J. Gerber, B. Henderson, H. P. S. Makkar, and J. L. Firkins. 2013b. Mitigation of methane and nitrous oxide emissions from animal operations: III. A review of animal management mitigation options. J. Anim. Sci. 91:5095-5113.
Klop, G., S van Laar-Schuppen, W. F. Pellikaan, W. H. Hendriks, A. Bannink, and J. Dijkstra. 2017. Changes in in vitro gas and methane production from rumen fluid from dairy cows during adaptation to feed additives in vivo. Animal 11:591-599.
Knapp, J. R., G. L. Laur, P. A. Vadas, W. P. Weiss, and J. M. Tricarico. 2014. Invited review: Enteric methane in dairy cattle production: Quantifying the opportunities and impact of reducing emissions. J. Dairy Sci. 97:3231. Lassen, J., and P. Løvendahl. 2016. Heritability estimates for enteric methane emissions from Holstein cattle measured
using noninvasive methods. J. Dairy Sci. 99:1959-1967.
Lassey, K. R. 2008. Livestock methane emission and its perspective in the global methane cycle. Aust. J. Exp. Agric. 48:114-118.
McAllister, T. A., and C. J. Newbold. 2008. Redirecting rumen fermentation to reduce methanogenesis. Aust. J. Exp. Agric. 48:7-13.
Montes, F. R. Meinen, C. Dell, A. Rotz, A. N. Hristov, J. Oh, G. Waghorn, P. J. Gerber, B. Henderson, H. P. S. Makkar, and J. Dijkstra. 2013. Mitigation of methane and nitrous oxide emissions from animal operations: II. A review of manure management mitigation options. J. Anim. Sci. 91:5070-5094.
Murray, R. M., A. M. Bryant, and R. A. Leng. 1976. Rates of production of methane in the rumen and large intestine of sheep. Br. J. Nutr. 36:1-14.
Myhre, G., D. Shindell, F.-M. Bréon, W. Collins, J. Fuglestvedt, J. Huang, D. Koch, J.-F. Lamarque, D. Lee, B. Mendoza, T. Nakajima, A. Robock, G. Stephens, T. Takemura, and H. Zhang. 2013. Anthropogenic and natural radiative forcing. In Climate Change 2013: The Physical Science Basis. Contribution of Working Group I to the Fifth Assessment Report of the Intergovernmental Panel on Climate Change. Cambridge University Press.
GENERAL INTRODUCTION
Negussie, E., Y. de Haas, F. Dehareng, R. Dewhurst, J. Dijkstra, N. Gengler, D. P. Morgavi, H. Soyeurt, S. van Gastelen, T. Yan, and F. Biscarini. 2017. Invited review: Large-scale indirect measurements for enteric methane emissions in dairy cattle: A review of proxies and their potential for use in management and breeding decisions. J. Dairy Sci. 100:2433-2453.
Pickering, N. K., V. H. Oddy, J. A. Basarab, K. Cammack, B. J. Hayes, R. S. Hegarty, J. C. McEwan, S. Miller, C. Pinares, and Y. de Haas. 2015. Invited review: Genetic possibilities to reduce enteric methane emissions from ruminants. Animal 9:1431-1440.
Tedeschi, L. O. 2006. Assessment of the adequacy of mathematic models. Agric. Syst. 89:225-247.
Van Lingen, H. J., C. M. Plugge, J. G. Fadel, E. Kebreab, A. Bannink, and J. Dijkstra. 2016. Thermodynamic driving force of hydrogen on rumen microbial metabolism: a theoretical investigation. PLoS ONE 11:e0161362. Warner, D., S. C. Podesta, B. Hatew, G. Klop, H. van Laar, A. Bannink, and J. Dijkstra. 2015. Effect of nitrogen
fertilization rate and regrowth interval of grass herbage on methane emission of zero-grazing lactating dairy cows. J. Dairy Sci. 98:3383-3393.
Yáñez-Ruiz, D. R., A. Bannink, J. Dijkstra, E. Kebreab, D. P. Morgavi, P. O’Kiely, C. K. Reynolds, A. Schwarm, K. J. Shingfield, Z. Yu, and A. N. Hristov. 2016. Design, implementation and interpretation of in vitro batch culture experiments to assess enteric methane mitigation in ruminants - a review. Anim. Feed Sci. Technol. 216:1-18.
Chapter 2
Prediction of methane emission from
lactating dairy cows using milk fatty acids and
mid-infrared spectroscopy
S. van Gastelen*† and J. Dijkstra†
* Top Institute Food and Nutrition, Wageningen, the Netherlands
† Animal Nutrition Group, Wageningen University & Research, Wageningen, the Netherlands
20
ABSTRACT
Enteric methane (CH4) production is among the main targets of greenhouse gas
mitigation practices for the dairy industry. A simple, robust and inexpensive measurement technique applicable on large scale to estimate CH4 emission from dairy cattle would therefore be valuable. Milk fatty acids (MFA) are related to CH4 production because of the common biochemical pathway between CH4 and fatty acids in the rumen. A summary of studies that investigated the predictive power of MFA composition for CH4 emission indicated good potential, with predictive power ranging between 47 and 95%. Until recently, gas chromatography (GC) was the principal method used to determine the MFA profile, but GC is unsuitable for routine analysis. This has led to the application of mid-infrared (MIR) spectroscopy. The major advantages of using MIR spectroscopy to predict CH4 emission include its simplicity and potential practical application at large scale. Disadvantages include the inability to predict important MFA for CH4 prediction, and the moderate predictive power for CH4 emission. It may not be sufficient to predict CH4 emission based on MIR alone. Integration with other factors, like feed intake, nutrient composition of the feed, parity, and lactation stage may improve the prediction of CH4 emission using MIR spectra.
Keywords: mid-infrared spectroscopy, milk fatty acids, methane emission, dairy cows INTRODUCTION
Enteric methane (CH4) is produced in the gastrointestinal tract of ruminants, mainly
the rumen, by methanogenic archaea. Enteric CH4 comprises 17% of global CH4, and is therefore the single largest source of anthropogenic CH4 (Knapp et al., 2014). In addition to its relevance of environmental impact, CH4 represents an energy loss, making CH4 emission one of the main targets of greenhouse gas (GHG) mitigation practices for the dairy industry (Hristov et al., 2013). The quantification of CH4 emission is important to understand factors that contribute to the variation and to identify effective CH4 mitigation strategies. Several techniques, such as the
climate respiration chambers, the sulfur hexafluoride tracer (SF6) technique, and mathematical
models, have been developed to estimate CH4 emission, many of which have been reviewed by Kebreab et al. (2006) and Storm et al. (2012). However, a simple, robust and inexpensive measurement technique applicable on large scale to estimate CH4 emission from dairy cattle in commercial practice is still missing and would be valuable for the dairy industry (Van Lingen et
al., 2014).Therefore, the potential of various metabolites in milk as biomarkers of CH4 emission
gained interest, including milk fatty acids (MFA; Fievez et al., 2012). The aim of this review is to provide an overview of the recent research that relates MFA with CH4 emission, and to discuss the opportunities and limitations of using mid-infrared (MIR) spectroscopy to estimate, direct and indirect, CH4 emission of dairy cattle.
MILK FATTY ACIDS AND METHANE EMISSION
Several studies have related individual MFA (g/100 g fatty acids; FA) to CH4 emission in dairy cows (Chilliard et al., 2009; Castro-Montoya et al., 2011; Dijkstra et al., 2011; Mohammed et al., 2011; Van Lingen et al., 2014; Williams et al., 2014; Dijkstra et al., 2016; Rico et al., 2016). Straight short- and medium-chain fatty acids (SMCFA) in milk arise almost exclusively from de
MILK FATTY ACIDS AND MID-INFRARED SPECTROSCOPY TO PREDICT METHANE novo synthesis in the mammary gland from acetate and β-hydroxybutyrate produced in the rumen (Bernard et al., 2008). Ruminal acetate and butyrate are positively associated with enteric CH4 emission (Boadi et al., 2004; Ellis et al., 2008). Hence, a positive relationship between CH4 emission and SMCFA can be assumed due to the common biochemical pathway (Ellis et al., 2008; Chilliard et al., 2009). Odd- and branched-chain fatty acids (OBCFA) in milk can also be used to predict CH4 emission (Fievez et al., 2012). Propionate is a substrate for de novo synthesis of C15:0 and C17:0 in the mammary gland, and given the negative relation between propionate and CH4 emission (Boadi et al., 2004; Ellis et al., 2008), a negative relation between CH4 emission and these linear odd-chain FA in the milk can be assumed. In addition, milk OBCFA are of microbial origin in the rumen, which in turn relate directly to CH4 emission. Fibrolytic bacteria are generally enriched in iso FA, whereas amylolytic bacteria contain high amounts of linear odd-chain FA and anteiso FA (Vlaeminck et al., 2006). Hence, a positive relation between CH4 emission and iso FA can be assumed, as well as a negative relation between CH4 emission and linear odd-chain FA and anteiso FA (Fievez et al., 2012).
A higher content of dietary unsaturated fatty acids (UFA) is negatively associated with CH4 emission (Patra et al., 2013; Van Lingen et al., 2014). This CH4 suppressing effect may be related to the intermediary metabolic products resulting from biohydrogenation (BHG) of UFA in the rumen, such as C18:1 and C18:2 isomers (Mohammed et al., 2011). Because several long-chain UFA in milk originate from dietary UFA and their BHG products formed in the rumen, a negative relation can be assumed between long-chain UFA in milk and CH4 emission (Van Lingen et al., 2014).
A negative relation can also be expected between CH4 emission and BHG intermediates in milk, because certain dietary strategies, including low-fiber diets and high-concentrate diets, alter the rumen environment and lower ruminal pH (Boadi et al., 2004). This often results in microbial population shifts, which have been associated with modifications in the BHG pathways. With a lower ruminal pH, BHG becomes more incomplete (i.e., concentrations of BHG intermediates increase) and C18:1 trans-10 replaces C18:1 trans-11 as the predominant trans C18:1 isomer of milk fat (Bauman and Griinari, 2003). Furthermore, a lower ruminal pH reduces the activity of rumen methanogens, and inhibits fiber fermentation, whereas starch fermentation is not reduced. Hence, propionate production is favored, thereby reducing H2 availability for the production of CH4 (Bannink et al., 2008).
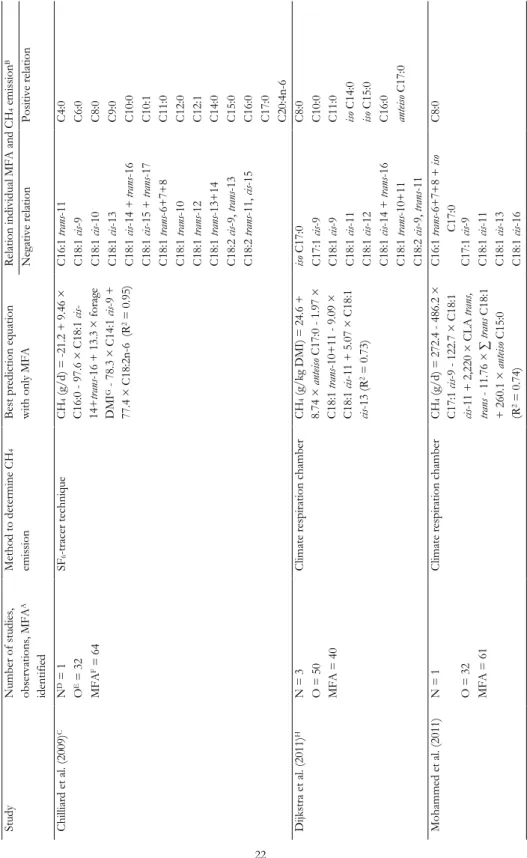
Tabl e 2. 1. T he u se of m ilk f at ty aci ds to pr ed ict C H4 em is si on of da iry co w s St ud y N um ber of s tu di es , ob ser va tion s, MF A A id ent ifi ed Me tho d to de ter m ine C H4 em is si on B es t pr ed ic tion e qu at ion w ith on ly MF A Rela tion ind iv id ual MF A a nd C H4 e m is si on B N egat iv e rel at ion P os iti ve rel at ion C hi lli ar d et a l. (2 00 9) C N D = 1 SF6 -t ra cer techn iqu e CH 4 (g /d ) = -21 .2 + 9 .4 6 × C 16 :0 9 7. 6 × C 18 :1 ci s-14+ tra ns -1 6 + 1 3. 3 × f or ag e D MI G 7 8. 3 × C 14 :1 ci s-9 + 77 .4 × C 18 :2 n-6 (R 2 = 0 .9 5) C 16 :1 tr an s-11 C 4: 0 O E = 3 2 C 18 :1 ci s-9 C 6: 0 MF A F = 6 4 C 18 :1 ci s-10 C 8: 0 C 18 :1 ci s-13 C 9: 0 C 18 :1 ci s-14 + tr an s-16 C 10 :0 C 18 :1 ci s-15 + tr an s-17 C 10 :1 C 18 :1 tr an s-6+ 7+ 8 C 11 :0 C 18 :1 tr an s-10 C 12 :0 C 18 :1 tr an s-12 C 12 :1 C 18 :1 tr an s-13 + 14 C 14 :0 C 18 :2 ci s-9, tr an s-13 C 15 :0 C 18 :2 tr an s-11, ci s-15 C 16 :0 C 17 :0 C 20 :4 n-6 D ijk st ra et a l. (2 01 1) H N = 3 C lim at e res pi ra tion cha m ber CH 4 (g /k g D M I) = 2 4. 6 + 8. 74 × a nt eis o C 17 :0 1 .9 7 × C 18 :1 tr an s-10 + 11 9 .0 9 × C 18 :1 ci s-11 + 5 .0 7 × C 18 :1 cis -1 3 (R 2 = 0 .7 3) iso C 17 :0 C 8: 0 O = 5 0 C 17 :1 ci s-9 C 10 :0 MF A = 4 0 C 18 :1 ci s-9 C 11 :0 C 18 :1 ci s-11 iso C 14 :0 C 18 :1 ci s-12 iso C 15 :0 C 18 :1 ci s-14 + tr an s-16 C 16 :0 C 18 :1 tr an s-10 + 11 an tei so C 17 :0 C 18 :2 ci s-9, tr an s-11 Moha m m ed e t a l. (2 01 1) N = 1 C lim at e res pi ra tion cha m ber CH 4 (g /d ) = 2 72 .4 4 86 .2 × C 17 :1 ci s-9 - 1 22 .7 × C 18 :1 cis -1 1 + 2 ,2 20 × C L A tr an s, tra ns 1 1. 76 × ∑ tr an s C 18 :1 + 2 60 .1 × a nt eis o C 15 :0 (R 2 = 0 .7 4) C 16 :1 tr an s-6+ 7+ 8 + is o C 17 :0 C 8: 0 O = 3 2 C 17 :1 ci s-9 MF A = 6 1 C 18 :1 ci s-11 C 18 :1 ci s-13 C 18 :1 ci s-16
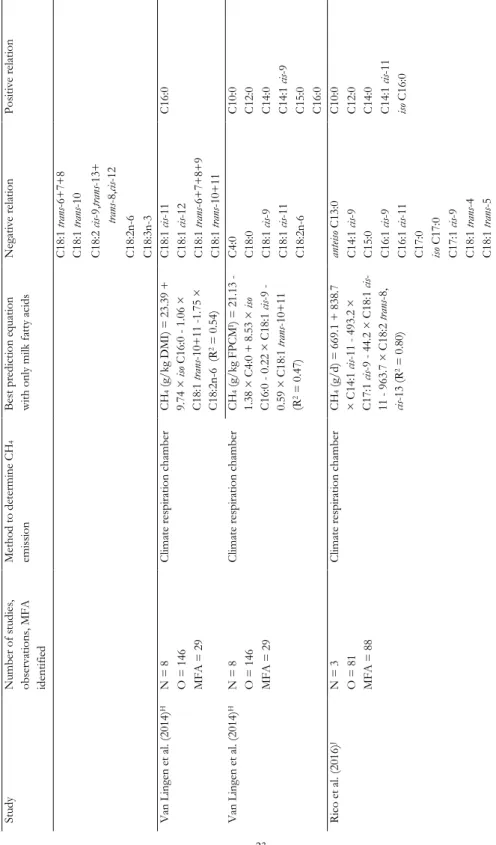
MILK FATTY ACIDS AND MID-INFRARED SPECTROSCOPY TO PREDICT METHANE Tabl e 2. 1. C on tinu ed St ud y N um ber of s tu di es , ob ser va tion s, MF A id ent ifi ed Me tho d to de ter m ine C H4 em is si on B es t pr ed ic tion e qu at ion w ith on ly m ilk f at ty a ci ds N egat iv e rel at ion P os iti ve rel at ion C 18 :1 tr an s-6+ 7+ 8 C 18 :1 tr an s-10 C 18 :2 ci s-9, tra ns -13+ tra ns -8, cis -12 C 18 :2 n-6 C 18 :3 n-3 V an L ingen et a l. (2 01 4) H N = 8 C lim at e res pi ra tion cha m ber CH 4 (g /k g D M I) = 2 3. 39 + 9. 74 × is o C 16 :0 1 .0 6 × C 18 :1 tr an s-10 + 11 -1. 75 × C 18 :2 n-6 (R 2 = 0 .5 4) C 18 :1 ci s-11 C 16 :0 O = 1 46 C 18 :1 ci s-12 MF A = 2 9 C 18 :1 tr an s-6+ 7+ 8+ 9 C 18 :1 tr an s-10 + 11 V an L ingen et a l. (2 01 4) H N = 8 C lim at e res pi ra tion cha m ber CH 4 (g /k g F PC M I) = 2 1. 13 - 1. 38 × C 4: 0 + 8 .5 3 × is o C 16 :0 0 .2 2 × C 18 :1 ci s-9 - 0. 59 × C 18 :1 tr an s-10 + 11 (R 2 = 0 .4 7) C 4: 0 C 10 :0 O = 1 46 C 18 :0 C 12 :0 MF A = 2 9 C 18 :1 ci s-9 C 14 :0 C 18 :1 ci s-11 C 14 :1 ci s-9 C 18 :2 n-6 C 15 :0 C 16 :0 Ri co e t a l. (2 01 6) J N = 3 C lim at e res pi ra tion cha m ber CH 4 (g /d ) = 6 69 .1 + 8 38 .7 × C 14 :1 ci s-11 - 49 3. 2 × C 17 :1 ci s-9 - 4 4. 2 × C 18 :1 ci s-11 - 96 3. 7 × C 18 :2 tr an s-8, cis -1 3 (R 2 = 0 .8 0) an tei so C 13 :0 C 10 :0 O = 8 1 C 14 :1 ci s-9 C 12 :0 MF A = 8 8 C 15 :0 C 14 :0 C 16 :1 ci s-9 C 14 :1 ci s-11 C 16 :1 ci s-11 iso C 16 :0 C 17 :0 iso C 17 :0 C 17 :1 ci s-9 C 18 :1 tr an s-4 C 18 :1 tr an s-5
Tabl e 2. 1. C on tinu ed St ud y N um ber of s tu di es , ob ser va tion s, MF A id ent ifi ed Me tho d to de ter m ine C H4 em is si on B es t pr ed ic tion e qu at ion w ith on ly m ilk f at ty a ci ds N egat iv e rel at ion P os iti ve rel at ion C 18 :1 tr an s-6 C 18 :1 tr an s-10 C 18 :1 tr an s-12 C 18 :1 tr an s-13 + 14 C 18 :1 ci s-11 C 18 :1 ci s-13 C 18 :2 tr an s-8, ci s-12 C 18 :2 tr an s-8, ci s-13 C 18 :2 ci s-9, tr an s-12 C 20 :1 ci s-9 C 18 :3 n-3 C 18 :2 tr an s-10 , ci s-12 C 18 :4 n-3 C 20 :3 n-3 C 22 :3 ci s-13 ,1 6, 19 C 22 :5 n-6 C 22 :6 n-3 A Mil k fa tt y aci ds in g /1 00 g fa tt y aci ds . B T he uni t o f C H4 e m is si on is s im ila r to t he C H4 e m is si on uni t o f th e col um n w ith pr ed ict ion eq ua tion s in t he cor res po nd ing r ow . C O nl y cor rel at ion s > 0. 7 or < − 0. 7 (P < 0 .0 01 ) be tw een in di vi dual M F A a nd C H4, an d no pr ed ic tion eq uat ion w ith o nl y MF A a re repo rt ed in thi s st ud y. D N um ber o f st ud ies (N ). E N um ber of ob ser va tion s (O ). F N um ber of m ilk f at ty a ci ds id ent ifi ed (MF A ). G D ry m at ter int ak e (k g/ d) . H T he rep or ted R 2 is a dj us ted f or s tu dy ef fe ct . I F at - an d P ro tei n-C or rect ed Mil k (F P C M) = (0 .3 37 + 0 .1 16 × f at % + 0 .0 6 × pr ot ei n %) × m ilk yi el d (k g/ d) . J T he rep or ted R 2 is a dj us ted f or co w , p er iod , a nd s tud y ef fec t.
MILK FATTY ACIDS AND MID-INFRARED SPECTROSCOPY TO PREDICT METHANE The relation between MFA and CH4 emission has resulted in the suggestion that MFA composition can be used to predict CH4 emission in lactating dairy cows. Table 2.1 summarizes the studies that have investigated the predictive power of MFA composition for CH4 emission and derived multivariate models to predict CH4 emission (Chilliard et al., 2009; Dijkstra et al., 2011; Mohammed et al., 2011; Van Lingen et al., 2014; Rico et al., 2016). In all studies, MFA profile was elucidated using gas chromatography (GC), and detailed information regarding the GC method used to determine the MFA profile is provided in the respective studies. In general, the significant correlations found between individual MFA and CH4 emission are moderate (correlation coefficient ranging between 0.3 and 0.7), with the exception of the ones reported by Chilliard et al. (2009). Four studies (Chilliard et al., 2009; Dijkstra et al., 2011; Van Lingen et al., 2014; Rico et al., 2016) associated OBCFA with CH4 emission, with varying results; C15:0 was negatively related with CH4 production (g/d) in one study (Rico et al., 2016), positively related with CH4 production (g/d) and intensity (g/kg fat- and protein-corrected milk; FPCM) in two studies (Chilliard et al., 2009; Van Lingen et al., 2014), and not related with CH4 yield (g/kg dry matter intake; DMI) in another study (Dijkstra et al., 2011). All studies have relative similar results for the C18:1 and C18:2 isomers, which were generally found to be negatively related to CH4 emission, and all studies have relative similar results for the SMCFA, which were generally found to be positively related to CH4 emission. However, the specific SMCFA positively associated with CH4 emission differ between studies, with C10:0 and C16:0 having a positive association with CH4 emission in four studies each, but C4:0 having a positive relation with CH4 production (g/d; Chilliard et al., 2009) or a negative relation with CH4 intensity (g/kg FPCM; Van Lingen et al., 2014). Williams et al. (2014) (not included in the table) studied the relation between CH4 production (g/d) and both C8:0 and total C18 FA in milk and concluded that the concentrations of C8:0 and total C18 FA in milk do not enable accurate prediction of CH4 production (g/d). The variation between the studies regarding the SMCFA and individual C18 FA (Table 2.1), may explain why Williams et al. (2014) did not find a significant association between both C8:0 and total C18 FA in milk and CH4 production (g/d). It should be noted here that the studies used different units to express CH4 emission (CH4 production in g/d, CH4 yield in g/kg DMI, and CH4 intensity in g/kg FPCM; Table 2.1), which may affect the relationships as well. For example, Van Lingen et al. (2014) and Dijkstra et al. (2016) found strong negative relations between CH4 yield (g/kg DMI) and certain trans C18:1 FA (e.g., C18:1 trans-10 or C18:1 trans-10+11), but these were not observed for CH4 intensity (g/kg FPCM). This can be explained by the various BHG intermediates in milk being associated with a reduction of CH4 yield (g/kg DMI), as well as with milk fat depression. This negatively affects the amount of FPCM, resulting in the absence of a significant relationship between these various MFA and CH4 intensity (g/kg FPCM) despite a strong negative relation with CH4 yield (g/kg DMI).
Although these studies, with exception of Williams et al. (2014), show that MFA hold potential to reflect changes in rumen fermentation, due to discrepancies between studies, it remains unclear which MFA have the greatest potential as biomarker for CH4 emission. Similar reservations hold for the CH4 prediction equations given in several studies (Chilliard et al., 2009; Dijkstra et al., 2011; Mohammed et al., 2011; Van Lingen et al., 2014; Rico et al., 2016). The predictive power of the prediction equations range between 47% and 95% (Table 2.1), but the MFA included in these equations often differ between studies, with only C17:1 cis-9 (Mohammed
26
et al., 2011; Rico et al., 2016) and C18:1 cis-11 (Dijkstra et al., 2011; Mohammed et al., 2011; Rico et al., 2016) appearing in two or more equations. The discrepancies between the studies might be the result of the different CH4 measurement techniques and analytical methods used to determine the MFA profile, the unit in which CH4 is expressed, and the number of experiments used to determine the relation between MFA and CH4. Overall, the predictive power seems higher when CH4 is expressed as yield (g/kg DMI) or as production (g/d) with feed intake included as explanatory variable. This is because feed intake is a principal predictor of CH4 production (g/d) (Moraes et al., 2014). However, in practice feed intake is usually unknown and therefore CH4 intensity (g/kg FPCM) is of interest.
The most extensive dataset (i.e., number of studies and observations) was used by Van Lingen et al. (2014) with a wide variety of diets in order to assess the potential of MFA as an indicator for CH4 emission (Table 2.1). Despite using a similar CH4 measurement technique and a large number of experiments, Van Lingen et al. (2014) concluded that MFA have moderate potential to predict CH4 emission, because the predictive power of the best CH4 prediction equation was 0.47 for CH4 intensity (g/kg FPCM) and 0.54 for CH4 yield (g/kg DMI). Because these prediction equations were developed on a wide range of dietary treatments, the results of Van Lingen et al. (2014) suggest that one prediction equation for CH4 emission may not be realistic. This is in agreement with independent evaluations (Mohammed et al., 2011; Dijkstra et al., 2016). Mohammed et al. (2011) compared observed CH4 emission with CH4 emission predicted by the equations of Chilliard et al. (2009) and Dijkstra et al. (2011). Estimating CH4 emission using the other equations resulted in overprediction of CH4 emission. Dijkstra et al. (2016) compared observed CH4 emission of dairy cattle fed grass- and grass silage-based diets with CH4 emission predicted by the equations of Van Lingen et al. (2014). It was concluded that these prediction equations could not accurately predict CH4 yield (g/kg DMI) and intensity (g/kg FPCM), indicating that the relation between MFA profile and CH4 emission in dairy cows fed grass- and grass silage-based diets differ from those determined for other types of diets. This suggests that diet specific prediction equations may have to be developed.
Although the relation between MFA and CH4 emission seems moderate and diet specific, it might provide a simple method to predict CH4 emission from dairy cattle on large scale. Because enteric CH4 emission is among the main targets of GHG mitigation practices for the dairy industry (Hristov et al., 2013), it is worthwhile to further explore the application of this biomarker technique.
MID-INFRARED TO MEASURE MILK FATTY ACIDS
Until recently, GC was the principal method for MFA analysis as GC measures a large number of MFA precise and accurately, even those present at low concentrations in milk fat. However, the GC method is unsuitable for routine milk recording (Soyeurt et al., 2011). Infrared spectroscopy techniques are inexpensive, non-destructive, rapid, and multi-parametric (Coppa et al., 2014). Both near-infrared spectroscopy and MIR show good prediction performance for MFA concentrations (either in g/100 g FA or g/kg milk) allowing their use for routine MFA composition recording (Coppa et al., 2014). At present, MIR spectroscopy is routinely used in milk recording systems worldwide to predict fat, protein, lactose, and urea contents in dairy milk
MILK FATTY ACIDS AND MID-INFRARED SPECTROSCOPY TO PREDICT METHANE (Coates, 2000) to assist in farm management decisions and for breeding purposes. Because MIR is already a major tool in dairy science and therefore easily implementable for estimating CH4 emission, this review focuses only on MIR.
Several studies have investigated the potential use of MIR spectroscopy to predict MFA composition in dairy cattle (Soyeurt et al., 2006, 2011; Rutten et al., 2009; De Marchi et al., 2011;
Ferrand et al., 2011; Maurice-Van Eijndhoven et al., 2012),which have been extensively reviewed
by De Marchi et al. (2014). In general, these studies find a clear relationship between MFA concentration (g/100 g FA) and the accuracy of the MIR spectroscopy prediction models; the accuracy of the MIR spectroscopy prediction models for major MFA is higher compared with minor MFA. The accuracy of MIR spectroscopy prediction models is also higher for individual saturated fatty acids (SFA) than individual UFA. When dividing UFA in two groups, namely mono unsaturated fatty acids (MUFA) and poly unsaturated fatty acids (PUFA), good accuracy is achieved for MIR spectroscopy prediction models for MUFA, whereas it is not for PUFA (De Marchi et al., 2014).
The results from these studies (i.e., Soyeurt et al., 2006, 2011; Rutten et al., 2009; De
Marchi et al., 2011; Ferrand et al., 2011; Maurice-Van Eijndhoven et al., 2012)confirm the
potential of MIR spectroscopy for accurate prediction of several individual, in particular major, MFA and groups of MFA, but a considerable number of lower abundant MFA cannot be predicted by MIR. In addition, Eskildsen et al. (2014) investigated whether the predictions of individual MFA using MIR spectroscopy rely on direct association or indirect correlations, which are confined to covariance structures in the dataset. It was concluded that the prediction of MFA with MIR spectroscopy is indirect and based primarily on covariation between individual MFA and total fat content of the milk. This indicates that the implementation of MIR spectroscopy MFA predictions in milk recording systems must account for the universal validity of these indirect correlations, because the ratio between individual MFA and total fat content found in calibration milk samples may not be conserved in future milk samples resulting in incorrect and biased predictions for future milk samples (Eskilden et al., 2014). Therefore, MIR spectroscopy predicted MFA in calibration milk samples always need to be cross validated with the use of an external and independent dataset. Overall, MIR spectroscopy is an interesting alternative in the dairy sector for providing indications of the MFA profile of dairy cows (Soyeurt et al., 2006).
MID-INFRARED TO ESTIMATE METHANE EMISSION
In general, CH4 emission is linked to MFA profile. As MIR spectroscopy reflects the MFA profile, it is logical to assume that MIR spectroscopy could estimate CH4 emission from dairy cows. Van Lingen et al. (2014) evaluated, indirectly via MFA composition, the use of MIR spectroscopy to estimate CH4 emission of dairy cows and developed prediction models with restricted selection of MFA based on the MIR results of Soyeurt et al. (2011) and of Rutten et
al. (2009).The prediction equations for CH4 yield (g/kg DMI) decreased in predictive power
from R2 = 0.54 when using all MFA to R2 = 0.43 when using the accurately MIR determined
MFA reported by Soyeurt et al. (2011) and to R2 = 0.29 when using the accurately MIR
determined MFA reported by Rutten et al. (2009). Similarly, the predictive power for CH4
28
when using the accurately MIR determined MFA reported by Soyeurt et al. (2011) and to R2 =
0.28 when using the accurately MIR determined MFA reported by Rutten et al. (2009). These results indicate that the performance of MIR spectroscopy limits the potential for estimating CH4 emission based on MFA, compared with GC, because several lower abundant MFA that appear in various CH4 prediction equations published (Chilliard et al., 2009; Dijkstra et al., 2011; Mohammed et al., 2011; Van Lingen et al., 2014; Rico et al., 2016). are not available when MFA is determined using MIR spectroscopy (Van Lingen et al., 2014).
Kandel et al. (2015) assessed indirectly whether MIR spectrometry can predict CH4 production (g/d) from dairy cows by the use of four CH4 prediction equations, each developed by Chilliard et al. (2009). The predicted CH4 production (g/d) was within the expected range from 350 ± 40 to 449 ± 65 g CH4/d, and Kandel et al. (2015) concluded that it is feasible to use MIR spectroscopy to predict CH4 production (g/d). However, only the CH4 prediction equations developed by Chilliard et al. (2009) were considered, because these were developed from abundant MFA which have a high MIR prediction accuracy (Soyeurt et al., 2011). This highlights, similar to Van Lingen et al. (2014) that the performance of MIR spectroscopy is limited compared with GC, because lower abundant MFA important for the prediction of CH4 emission are not available when MFA is determined using MIR spectroscopy.
At present, there are two studies that investigated directly with no intermediate steps (i.e., MFA profile) if MIR spectroscopy can predict CH4 emission from individual cows. Dehareng et al. (2012) used two experiments involving 11 lactating Holstein cows and three dietary treatments, in which CH4 emission was measured using the SF6-tracer technique, and MIR spectroscopy prediction models were developed using average milk spectra from morning and evening milk samples. The accuracy of the different developed MIR spectroscopy prediction models for CH4 production (g/d) and CH4 intensity (g/kg milk) on this small dataset is rather high; the cross-validation coefficient of determination ranges from 0.68 to 0.79. However, according to Vanlierde et al. (2015), the predicted CH4 emission using the MIR spectroscopy prediction models from Dehareng et al. (2012) was lowest in early lactation to increase thereafter, which is biologically not meaningful (Vanlierde et al., 2015). Therefore, Vanlierde et al. (2015) developed lactation stage dependent predictions of CH4 emission from MIR spectra, using a total of 446 CH4 measurements of 142 Holstein, Jersey and Holstein-Jersey cows, measured with the SF6 tracer technique. Methane predictions using MIR spectra only were compared with CH4 predictions using MIR spectra and days in milk (DIM). The average CH4 production (g/d) predicted by both models hardly differed (both models, standard error of calibration of 63 g CH4/d; observed mean of 416 g CH4/d). However, in contrast to the predictions based on MIR spectra only, the predictions that included DIM showed biologically meaningful behavior throughout lactation (an increase in CH4 production (g/d) after calving up to some 100 DIM, followed by gradual decline to end of lactation). Both studies (Dehareng et al., 2012; Vanlierde et al., 2015) show the potential to estimate CH4 emission directly using MIR spectroscopy, in particular in combination with other characteristics such as DIM.
The inclusion of other milk constituents may also result in better CH4 emission prediction. Moraes et al. (2014) identified milk fat proportion as key explanatory variable for CH4 emission. This component can be swiftly and easily determined. In addition, there are new
MILK FATTY ACIDS AND MID-INFRARED SPECTROSCOPY TO PREDICT METHANE developments to include other milk constituents. Van Gastelen et al. (2015) show the potential to use volatile and non-volatile metabolites in milk to quantify CH4 emission. However, the techniques for identifying volatile (i.e., gas chromatography-mass spectrometry) and non-volatile metabolites (i.e., nuclear magnetic resonance) are not suitable for large-scale measurements.
IMPLICATIONS AND CONCLUSIONS
The predicted power of MFA-based equations indicates good potential for CH4 emission prediction, but the GC method used to determine the MFA profile is unsuitable for routine analysis. The use of MIR spectroscopy appears to be a promising approach to predict CH4 emission routinely at large scale. MIR spectroscopy is able to predict CH4 emission directly or indirectly by prediction of a number of MFA, which in turn can be used to estimate CH4 emission. The major advantages of using MIR spectroscopy to predict CH4 emission include its simplicity and potential practical application at large scale. Disadvantages include the inability to predict important MFA for CH4 prediction, and the moderate predictive power for CH4 emission, both direct and indirect. It may not be sufficient to predict CH4 emission based on MIR alone. Integration with other factors, like feed intake, nutrient composition of the feed, parity, and lactation stage may improve the prediction of CH4 emission using MIR spectra.
More research is needed, including cross-validation with external and independent data to account for the universal validity of indirect correlations, more observations and a larger variation in dietary treatments, to establish the robustness, accuracy and repeatability of MIR spectroscopy to predict CH4 emission of dairy cows directly and indirectly, and to make MIR spectroscopy more reliable and potentially implementable.
REFERENCES
Bannink, A., J. France, S. Lopez, W. J. J. Gerrits, E. Kebreab, S. Tamminga, and J. Dijkstra. 2008. Modelling the implications of feeding strategy on rumen fermentation and functioning of the rumen wall. Anim. Feed Sci. Technol. 143:3-26.
Bauman, D. E., and J. M. Griinari. Nutritional regulation of milk fat synthesis. Annu. Rev. Nutr. 23:203-227. Bernard, L., C. Leroux, and Y. Chilliard. 2008. Expression and nutritional regulation of lipogenic genes in the ruminant
lactating mammary gland. Adv. Exp. Med. Biol. 606:67-108.
Boadi, D., C. Benchaar, J. Chiquette, and D. Masse. 2004. Mitigation strategies to reduce enteric methane emissions from dairy cows: update review. Can. J. Anim. Sci. 84:319-335.
Castro-Montoya, J., A. M. Bhagwat, N. Peiren, S. De Campeneere, B. De Baets, and V. Fievez. 2011. Relationships between odd- and branched-chain fatty acid profiles in milk and calculated enteric methane proportion for lactating dairy cattle. Anim. Feed Sci. Technol. 166-167:596-602.
Chilliard, Y., C. Martin, J. Roual, and M. Doreau. 2009. Milk fatty acids in dairy cows fed whole crude linseed, extruded linseed, or linseed oil, and their relationship with methane output. J. Dairy Sci. 92: 5199-5211.
Coppa, M., A. Revello-Chion, D. Giaccone, A. Ferlay, E. Tabacco, and G. Borreani. 2014. Comparison of near and medium infrared spectroscopy to predict fatty acid composition on fresh and thawed milk. Food Chem. 150:49-57.
Coates, J. 2000. Interpretation of infrared spectre, a practical approach. Pages 10815-10837 in Encyclopedia of Analytical Chemistry. R. A. Meyers, ed. John Wiley & Sons, New York, NY.
Dehareng, F., C. Delfosse, E. Froidmont, H. Soyeurt, C. Martin, N. Gengler, A. Vanlierde, and P. Dardenne. 2012. Potential use of milk mid-infrared spectra to predict individual methane emission of dairy cows. Animal 6:1694-1701.