Making Autocracy Work
∗
Timothy Besley
Masayuki Kudamatsu
LSE and CIFAR
LSE
The Suntory Centre
Suntory and Toyota International Centres for Economics and Related Disciplines
London School of Economics and Political Science Houghton Street
London WC2A 2AE DEDPS 48
May 2007 Tel: (020) 7955 6674
∗ The first author is grateful for support from CIFAR. The authors received much helpful feedback from members of the Institutions, Organizations and Growth program of CIFAR to which a preliminary version of this paper was presented. Useful comments from Madhav Aney, Fernando Aragon, Peter Evans, Gabriel Leon, Adam Przeworski, Konstantin Sonin,
Abstract
One of the key goals of political economy is to understand how institutional arrangements shape policy outcomes. This paper studies a comparatively neglected aspect of this - the forces that shape heterogeneous performance of autocracies. The paper develops a simple theoretical model of accountability in the absence of regularized elections. Leadership turnover is managed by a selectorate - a group of individuals on whom the leader depends to hold onto power. Good policy is institutionalized when the selectorate removes poorly performing leaders from office. This requires that the selectorate’s hold on power is not too dependent on a specific leader being in office. The paper looks empirically at spells of autocracy to establish cases where it has been successful according to various objective criteria. We use these case studies to identify the selectorate in specific instances of successful autocracy. We also show that, consistent with the theory, leadership turnover in successful autocracies is higher than in unsuccessful autocracies. Finally, we show by exploiting leadership deaths from natural causes that successful autocracies appear to have found ways for selectorates to nominate successors without losing power - a feature which is also consistent with the theoretical approach.
Keywords: dictatorship, democracy JEL numbers: P16, P26.
Development Economics Discussion Paper Series
This series is published by the Economic Organisation and Public Policy Programme (EOPP) located within the Suntory and Toyota International Centres for Economics and Related Disciplines (STICERD) at the London School of Economics and Political Science. The programme was established in October 1998 as a successor to the Development Economics Research Programme. The work of the programme is mainly in the fields of development economics, public economics and political economy. It is directed by Tim Besley, Oriana Bandiera, Robin Burgess, Maitreesh Ghatak and Andrea Prat. Further details about the programme and its work can be viewed on our web site at http://sticerd.lse.ac.uk/research/eopp.
Our Discussion Paper series is available free of charge. To subscribe to DEDPS, please contact Leila Alberici on:
Telephone: UK+20 7955 6674 Fax: UK+20 7955 6951 Email: l.alberici @lse.ac.uk
Web site: http://sticerd.lse.ac.uk/dedps
Tim Besley Oriana Bandiera Robin Burgess Maitreesh Ghatak Andrea Prat
© The authors. All rights reserved. Short sections of text, not to exceed two paragraphs, may be quoted without explicit permission provided that full credit, including © notice, is given to the source.
1
Introduction
One of the goals of political economy is to understand how institutional arrangements shape policy outcomes and human well-being. A large litera-ture has now emerged which studies aspects of this. For the most part this has concentrated on studying democratic institutions where elections are the main institution that shapes policy choices. However, throughout most of human history, elections have served a fairly modest role. Far more common are systems based on coercive power –such as monarchies, military dictator-ships or one party rule where elections are either a veil or non-existent.
Recent history has seen a signi…cant move towards open and free elec-tions as a means of determining who should hold power. The case for such institutional arrangements is partly based on liberal values that emphasize the political freedoms that such institutions embody. Indeed, this intrinsic case for democracy, emphasized by Sen (1999), would stand regardless of whether it delivered concrete policy bene…ts to its citizens. But the case for democracy would be cemented further if there were demonstrable bene…ts in terms of outcomes.
A key observation which motivates this paper is that autocratic govern-ment is not always a disaster in economic terms. Indeed, throughout history there has been growth and development in autocratic systems of government. For example, the British industrial revolution predates the introduction of free and fair elections with mass participation. Modern China is also a case in point with a spectacular growth performance in a non-democratic setting. Whether these observations damage the instrumental case for democracy is moot. After all, it is the counter-factual that matters – growth and de-velopment might have preceded at a greater pace were democracy present. But it is equally clear that whether one looks at democracy or autocracy there is a great deal of heterogeneity in their performance that cries out for explanation.
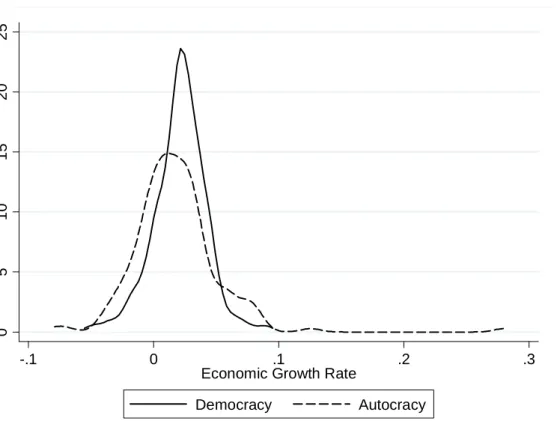
This fact is illustrated in Figure 1, which shows estimated density func-tions for real GDP per capita growth rates among autocratic and democratic regimes that lasted …ve full calendar years or longer.1 A “regime”is de…ned
1The density functions are estimated by using the Gaussian kernel and the bandwidth that minimizes the mean integrated squared error. Including regimes that lasted less than …ve years does not change the distributions substantially except for the inclusion of democratic regimes that existed less than 3 years, which tend to perform very badly (growth rates less than -1 percent).
as a period in which authority characteristics of a country stay the same, ac-cording to the POLITY IV data set.2 Regimes are democratic if the Polity score is positive, and autocratic if it is non-positive.3 The striking fact that we will explore in more detail is that the distribution of autocracies has fatter tails— there are more very good autocracies and more very bad autocracies compared to democracies.4
The key challenge for students of political economy is to extract lessons from historical and contemporary experience about what makes government work in the general interest of its citizens. There is little doubt that building infrastructure, managing macro-economic policy, facilitating private trade and investment and protecting the vulnerable are all facilitated by e¤ective government. In this paper, we will focus somewhat narrowly on the issue of why autocracy can sometimes be successful. This project is not intended as a defense of autocracy, but as means of gaining further insights into the institutional basis of good government. It also contributes to broader discus-sions about the di¤erences in policy and performance between democracies and autocracies.
The main focus of the paper is on the institutions that make government accountable – speci…cally …nding a means of removing poorly-performing leaders from o¢ ce. Democracies organize this through regularized contests for power in elections. However, the means of achieving accountability are more murky in autocratic settings. The analysis emphasizes accountability from a “selectorate” comprising insiders who have the ability to depose a leader.5 We show that autocratic government works well when the power of the selectorate does not depend on the existing leader remaining in o¢ ce. The framework can be used to contrast the performance of autocracy and democracy in terms of accountability of leaders.
We then turn to identifying successful autocracies empirically. We look at a variety of methods and use these to pick out regimes that are robustly high performers. This sample of regimes provides a structured basis for some case study analysis. We are also able to looking statistically at the patterns
2Section 4 provides details.
3The shapes of the two estimated density functions are similar if we de…ne a democratic regime as its Polity score being more than 5, as Fearon (2007) does.
4Rodrik (1997, 2000), Almeida and Ferreira (2002), and Glaeser et al. (2004, Table 8) make similar observations although the unit of observation in their analysis is a country rather than a regime.
of successful autocracies across countries. We then examine the idea that successful autocracies are able to generate accountability mechanisms in the absence of open contests for power.
The remainder of this paper is organized as follows. In the next section, we review some of the voluminous literature on autocracy and democracy by both economists and political scientists to set our paper in context. Section three develops the model. In section four, we look empirically at success-ful autocracies and how far their incidence can be explained. Section …ve explores links between the theory and the characteristics of successful autoc-racies. Section six o¤ers some concluding remarks.
2
Background
The background to this paper is a large body of studies on the way in which government and the economy interact. The key question for this research programme known as political economy (or sometimes political economics) is to understand how policy choices are shaped by institutions. One important institutional category is whether a country’s political institutions are deemed to be democratic. While the e¤ect of democratic institutions on policy choices has been studied for a long time, there has been a surge in interest among economists in recent years.
Whether the analysis is theoretical or empirical, a precondition for in-vestigating whether democracy or autocracy matters is to …nd some way of characterizing their di¤erences. From a theoretical point of view, a lot of attention has been paid to whether a country uses elections to determine who governs. The literature focuses on two main roles of elections: determin-ing the pattern of representation (i.e. which groups of citizens hold political power) and holding politicians to account (i.e. whether the incumbents are punished for bad policy).
The in‡uential work by Acemoglu and Robinson (2005) takes the …rst view, focusing on who controls political o¢ ce and modeling autocracy as a dictatorship of the rich and democracy as a dictatorship of the poor or middle classes. As a result, income redistribution is greater under democracy compared to dictatorship. The second perspective is taken in Bueno de Mesquita et al. (2002, 2003) who are the …rst to model accountability in a framework applicable to non-democratic government. In their theory, given the total amount of government expenditures, the larger is the selectorate
whose support is required for the government to stay in power, the higher the level of public goods provided by the government. Elections imply that the government requires the support from a large number of citizens to stay in power. Hence, democracy increases public goods provision. We follow them in putting weight on the role of the selectorate in shaping policy incentives. However, our theory gives greater emphasis to the interplay of accountability and representation issues in making government work.
Elections are conducted di¤erently depending on who can vote, who is eligible to stand and whether there is open access to institutions like the me-dia. The widely used Polity data base provides a more continuous measure of democracy in several categories: how competitive and open the recruit-ment of chief executives is; to what extent the chief executive is constrained institutionally; and how competitive and regulated political participation is. These continuous measures are then aggregated into the single Polity score, measuring the degree of democracy.6 It is commonplace to use this Polity score to create a discrete cuto¤ between democracies and autocracies. For example, Persson and Tabellini (2006, 2007) use a cuto¤ of zero with democ-racies being those with a positive Polity score. However, Fearon (2007) prefers a cuto¤ of …ve. Since discrete transformations of continuous data series are always somewhat arbitrary, it is important to test the robustness of speci…c empirical results to alternative de…nitions.7
While elections are a central institution in democracies, there are other important institutions. One of the indicators in the Polity data set is con-cerned with the checks and balances on a leader. The executive constraints variable “refers to the extent of institutionalized constraints on the decision-making powers of chief executives” (Marshall and Jaggers 2005, p.23). The political economy literature has so far focused on the role of executive con-straints in con‡ict of interest between policy-makers and citizens (e.g. prop-erty rights enforcement against government expropriation) and used the exec-utive constraints variable in that context (e.g. Acemoglu and Johnson 2005, Acemoglu, Johnson, and Robinson 2005). However, it could also a¤ect how distributional issues are resolved among citizens.
Mindful of the importance of institutional variation in democracies, Pers-son and Tabellini (2000, 2003) have explored how institutional variations
6See Marshall and Jaggers (2005) for more detail.
7See Munck and Verkuilen (2002) for a critical comparison on di¤erent democracy datasets including the Polity data base.
matter within democracies. The main di¤erences that they focus on are parliamentary versus presidential forms of government and proportional rep-resentation versus majoritarian electoral rules. They explore theoretical dif-ferences between these regimes in terms of representation and accountability. They also show that policies di¤er across forms of democracy.
The early theoretical political economy literature on autocracy attempts to explain di¤erent economic performances among autocracies in a model in which an autocrat maximizes his private consumption subject to the proba-bility of staying in power. One recurring theme in this literature is what is known as the “stationary bandits”theory of dictatorship, …rst formalized by McGuire and Olson (1996).8 The theory argues that if a dictator expects to stay in power for a long period of time, he has an incentive to promote economic development because he will then increase his private consump-tion through increased tax revenues resulting from economic growth. This mechanism has been incorporated into some subsequent studies of autoc-racy.9 Our theory does not incorporate the stationary bandits theory in a strict sense; the dictator in our model has no private gain from choosing welfare-enhancing policiesper se. However, successful autocracies emerge in our model if the ruling group of citizens are secure in power. In this sense, we incorporate one feature of the stationary bandits theory— the importance of political stability.
One contentious issue in this literature is how welfare-enhancing policies a¤ect the probability of a dictator’s survival. Grossman and Noh (1994) and Overland et al. (2005) assume that a dictator’s survival is more likely if he adopts welfare-enhancing policies. Grossman and Noh (1994) additionally assume that the probability of survival depends on non-economic factors, ar-guing that successful autocracies are those whose survival does not depend signi…cantly on non-economic factors. Overland et al. (2005) propose that the dictator’s survival chance increases with the level of capital accumula-tion (and therefore depends on growth-enhancing policies). As a result,
8See also section VI of Barro (1990).
9Examples include Overland, Simons, and Spagat (2005) and Acemoglu and Robinson (2006), as discussed below. What Acemoglu (2006) calls “revenue extraction”corresponds to this mechanism. Paltseva (2006) incorporates the stationary bandit theory into the theory of democratization. Azam, Bates, and Biais (2005) argue that autocrats may refrain from predation to build up their reputation as benevolent so that the gain from predation in the future will be larger due to increased economic productivity. Caselli (2006) uses this mechanism to explain the natural resource curse.
autocracies with a low level of initial capital do not perform well because the dictator will be removed anyway, failing to reap the bene…t from increased tax revenues through economic growth. Acemoglu and Robinson (2006) as-sume that welfare-enhancing policies directly reduce the dictator’s survival prospects while increasing the survival chance through competition for power with a challenger. Consequently, successful autocrats are either those who are secure enough (so that the stationary bandits theory applies) or those who face tough competition from a challenger. In the intermediate level of survival chance, autocrats fail to adopt welfare-enhancing policies because such policies increase the chance that the autocrat is overthrown.
Our theoretical model will show that whether welfare-enhancing policies increase the probability of a dictator’s survival depends on the institutional features of autocracy. Autocracy with a strong selectorate as modeled here has some features in common with the notion of a “consensually strong state” of Acemoglu (2005). We emphasize the role of institutions that organize accountability of leaders in the absence of elections.
The political economy literature on autocracy discussed so far fails to explain why poorly-performing autocrats can stay in power for a long period of time (e.g. Mobutu in former Zaire). Acemoglu, Robinson, and Verdier (2004) develop such a theory, arguing that autocrats can exacerbate the collective action problem involved in the ousting of leaders, by bribing loy-alists and punishing coup plotters. This implies that autocracy performs poorly if natural resource abundance or foreign aid provision allows dicta-tors to buy o¤ the pivotal group of people. Padro-i-Miquel (2006) o¤ers an alternative explanation, assuming that only the ruling group of citizens can replace the leader and that once the leader is replaced, there is a chance for citizens outside the ruling group to seize power. Consequently, autocrats expropriate citizens outside the ruling group, and the ruling group cannot replace poorly-performing autocrats for fear of losing power and being ex-propriated under new leadership. Our theoretical model below assumes away the collective action problem in leadership replacement, but incorpo-rates Padro-i-Miquel (2006)’s insight and therefore derives an equilibrium in which poorly-performing autocrats nevertheless stay in power.
While the above studies treat autocracy as a unitary form of govern-ment, more recent studies have focused on the internal organization of au-tocracy. Egorov and Sonin (2006) and Debs (2007) explore the incentive for an autocrat to keep incompetent cabinet ministers in his government while Acemoglu, Ticchi, and Vindigni (2007) examine why rich people in
auto-cratic regimes may want to support a bloated bureaucracy. Myerson (2006) and Svolik (2006) investigate under what condition an autocrat seeks sup-port from members of the political elite instead of establishing personal rule. Egorov, Guriev, and Sonin (2006) examine an autocrat’s incentive to restrict media freedom. These studies all try to endogenize autocratic institutions.10 More sociological approaches in political science have long been aware of institutional heterogeneity among autocracies.11 However, these are not easily translated into the kind of empirical di¤erences which can be used for statistical analysis. Moreover, they are poorly tied into the kinds of theoret-ical categories that shape policy incentives which can inform measurement.12 The literature on the “developmental state” (Deyo 1987, Amsden 1989, Haggard 1990, Wade 1990, Evans 1994) can also be seen as focusing on auto-cratic institutions which are successful in achieving economic growth. These studies identify two seemingly contradictory institutional features as key for understanding economic success: autonomy of the state and constraints that prevent predatory behavior of the state. Our theory may explain why these two features of the developmental state can coexist in autocracy: the state is autonomous only from opposition groups while the ruling group disciplines the state to avoid it from becoming predatory.
There is a growing empirical literature asking whether democracy or au-tocracy is superior in terms of economic outcomes. The evidence that democracy promotes prosperity is neither strong nor robust. Przeworski
10One study close to our model in spirit is Egorov and Sonin (2005), which study how the types of autocracy (hereditary versus non-hereditary) a¤ect the mode of leadership succes-sion. Wintrobe (1990, 1998) is an early attempt of formal modeling to compare di¤erent types of autocracy. Dixit (2006) investigates how the type of an autocrat (benevolent or predatory) a¤ects how public goods are provided.
11This political sociology literature has produced a wide array of terminology to clas-sify autocratic regimes. Examples include totalitarianism (Linz 2000), one-party systems (Huntington and Moore 1970), bureaucratic authoritarianism (O’Donnell 1979), sultanis-tic regimes (Chehabi and Linz 1998), neopatrimonialism (Bratton and van de Walle 1997, chapter 2), the rentier state (Beblawi and Luciani 1987), and, perhaps most recently, com-petitive authoritarianism (Levitsky and Way 2002). Geddes (1999) classi…es autocracies into personal, military, and single-party rules to investigate how the type of autocracy a¤ects its duration and the way it terminates. Haber (2006) attempts to bridge the gap between this political sociology literature and the political economy approach by classi-fying autocracies into three types according to the way dictators stay in power: terror, cooptation, and organizational proliferation.
12An exception is Gandhi and Przeworski (2006), who try to …nd the determinants of institutional choices in autocracy by linking a theory of autocracy to data.
and Limongi (1993) review early empirical research on the e¤ect of democ-racy on economic growth, concluding that the correlation is weak and not robust. Persson and Tabellini (2006) try a novel econometric approach …nd-ing some support for the proposition that persistent democracy is associated with improvements in economic performance. Papaioannou and Siourounis (2005) and Rodrik and Wacziarg (2005) …nd that democratization is associ-ated with subsequent growth. Jones and Olken (2005) …nd that economic growth rates change signi…cantly when autocratic leaders are unexpectedly removed from o¢ ce while such changes are less clear under democracy. Pers-son and Tabellini (2007) …nd evidence of heterogeneity with transitions out of democracy being damaging to growth, while transitions into democracy out of autocracy are less clearly marked by improved growth performance.
Which aspects of policy making and human well-being are promoted by democracies is also a subject of debate. For example, Mulligan et al. (2004) …nd few cross-country di¤erences between socio-economic policies enacted in democracies and autocracies. On the other hand, Persson (2005) …nds that, conditional on country …xed e¤ects, democracy with a parliamentary system of government or a proportional representation electoral system enacts more open trade policy than autocracies. Besley and Kudamatsu (2006) …nd that there is a strong and robust cross-country correlation between democracy and life expectancy while this correlation is not very robust to controlling for country …xed e¤ects. Kudamatsu (2006), in turn, …nds that the mortality of infants born to the same mother drops after democratization in sub-Saharan Africa in the 1990s.
Pretty much all prior empirical e¤orts to contrast the performance of democracy and autocracy treat the latter as a homogeneous institution.13 But, as we have seen, heterogeneity in the working of autocratic institutional arrangements comes out of a broad range of theoretical treatments. A key aim of this essay is to explore one dimension of this.
13An important exception is Gandhi (2003a,b), who …nds that autocracies with legis-latures and/or political parties, compared to those without, have better economic perfor-mance, more spending on education and less on the military. The …nding that a certain degree of institutionalization of autocracy yields better development policies and outcomes is broadly consistent with our theory.
3
The Model
We lay out a simple agency model of autocracy which studies the incentives of an incumbent policy maker to implement a costly action that yields bene…ts to all citizens. It di¤ers from a standard model of democracy as in Besley (2006, chapter 3) in that there is no regularized contest for public o¢ ce. We begin by assuming that such contests only arise when the ruling group replaces its leader. We will show that this institutional feature can lead to autocracy working in the interests of all citizens (section 3.1). After discussing the robustness of our results (section 3.2), we compare the outcome of this model with a stylized representation of democracy where power is contested regularly (section 3.3).
The world comprisesN citizens each of whom belongs to either groupA or B. Group A comprises a fraction of the population. There are two time periods denoted by t 2 f1;2g. In each period, there is a policy maker in o¢ ce who is a member of one of the two groups of citizens. Without loss of generality, we assume that the period one policy maker is from group A.14 The policy maker in o¢ ce in period t makes two policy decisions. The …rst is a discrete “general interest”policy denoted byet 2 f0;1g. This could be thought of as a wealth creation decision for the citizens which requires the policy maker to forego private bene…ts such as bribery by a special in-terest. The payo¤ to citizens and the policy maker from this policy depends on a state of the world, st 2 f0;1g; which is only observed by the policy maker. Each state occurs with equal probability. Citizens and the policy maker receive a payo¤ if et=st and zero otherwise.
The second policy decision is purely distributive. This divides an exoge-nous revenue of size T between the groups. Let J t 2 [ ; ] denote the fraction of this revenue allocated to group J 2 fA; Bg in period t. In the most extreme case = 1 and = 0. However, institutionalized checks and balances may limit this possibility.
As well as having a group identity, each policy maker is either good or bad. This is not observed by the citizens. Let be the probability that a randomly picked individual from either group is good.15 Both types of policy makers receive as a citizen if they chooseet=st. However, a good policy
14Whether groupA is in the majority does not a¤ect our analysis.
15We require that > 0. However, could be very small and many people plainly believe that it is in many practical settings. The key issue, however, is that thepossibility of a good policy maker existing creates a role for signalling.
maker gets the payo¤ of0 by choosinget6=st. We think of this as having a moral stance so that they get no utility from earning rents. Hence, a good politician will always act in the interests of all citizens on the general interest issue. A bad politician gets a private bene…t ofr from pickinget6=st, where r is drawn independently each period from a distribution whose cumulative distribution function is G(r) with E(r) = , G( ) = 0, and G(r) > 0 for r > .16 Denote the realized value of the rent available in periodt by r
t.
A fraction of the citizens in each group is enfranchised, i.e. are endowed with the power to in‡uence the choice of policy maker when there is a contest for power. Letn N be the total number of enfranchised citizens, of which a fraction belongs to groupA. Enfranchised citizens from the ruling group (A) decide whether to retain the incumbent as the policy maker for period two. If they so choose, then the incumbent remains in power. However, if group A’s enfranchised citizens decide to replace the incumbent, there is an "open" contest between two candidates, one from group A and the other from groupB. Following Bueno de Mesquita et al. (2003), we refer to group A’s enfranchised citizens as the selectorate:17
Suppose that in the event of an open contest, group A’s candidate has the support of a fraction of the enfranchised citizens. We allow for a uniformly distributed shock to the popularity of groupB’s candidate to a¤ect the outcome which we denote by 2 1
2; 1
2 : The group A candidate then wins if
>(1 ) + .
Then the probability that a candidate from groupAwins the contest, denoted by ( ), is: ( ) = 8 < : 1 if > 34 2 12 otherwise 0 if < 14:
This model conveniently nests the standard probabilistic voting model of democracy in which all citizens are enfranchised and each citizen has one
16We could think of r as embezzling public funds that are supposed to be spent on public goods provision. Making the lower bound on rents guarantees that it is never possible to motivate a bad policy maker to act in the general interest on the basis of his personal payo¤ at the current period only.
17As we assume the same preference among citizens of each group, we do not allow a faction from the selectorate to join with the opposition to topple the regime. This possibility is interesting as a power struggle within the ruling elite in an autocracy is often cited as a force leading to democratization (see O’Donnell and Schmitter 1986).
vote. Then if all citizens vote along group identity lines, the probability that group A wins is ( ).18
In an autocratic world, not all citizens are enfranchised (e.g. as in South Africa during apartheid), in which case = if all enfranchised citizens sup-port their own group’s candidate. We also allow for group B’s enfranchised citizens being repressed by being denied access to polling stations or because group A monopolizes coercive forces. We represent this simply by a repres-sion parameter( 1)with = =( + (1 )) :If most enfranchised citizens are from group A (a large ) or if there is strong repression (large enough ), then ( ) = 1; i.e. groupA is certain to hold onto power in the second period. This represents the case of an e¤ectively institutionalized autocracy along the lines of (say) modern day China.
Finally, if the period one policy maker is removed from o¢ ce, he receives a period two payo¤ as a citizen from group A.
The timing of the game is as follows:
1. Nature determines (s1; r1)and whether the period one policy maker is good or bad. These are private information to the policy maker. 2. The policy maker picks ( A1; B1; e1) and period one payo¤s are
real-ized.
3. Members of the selectorate decide whether to retain the policy maker. 4. If the policy maker is removed from o¢ ce, then nature determines
whether two candidates in an open contest are good or bad. An open contest then ensues in which enfranchised citizens of groups A and B decide which candidate to support. The group Acandidate wins with probability ( ).
5. Nature determines(s2; r2).
6. The period two policy maker chooses( A2; B2; e2)and period two pay-o¤s are realized.
18The purpose of making the contest outcome probabilistic is to allow the probability of group A’s candidate winning to be between 0 and 1 even if the size of support for candidateAexceeds that forB. With a …nite number of citizens in our model, groupA’s winning probability can be a step function of . This does not a¤ect our analysis because only changes discretely in response to the period one policies in our model (see below).
A key feature of the model is that there is a contest for power only if the selectorate of group A chooses to replace the current leader. It is the absence of a guaranteed contest at the end of period one that characterizes autocracy in the model. Below, we contrast this with a situation where there is an election at the end of period one as in the standard agency model of democracy.
3.1
Equilibrium
We solve for the perfect Bayesian equilibrium of our model. This requires that, in every period, each type of policy maker behaves optimally given the contest rule in place. Members of the selectorate use Bayes rule to update their beliefs on the type of the period one policy maker accordingly and decide optimally whether to replace the policy maker at the end of period one.
It is very easy to work out the equilibrium behavior of policy makers in period two. In terms of the general interest policy, every kind of policy maker takes his short term optimal action. Thus e2 =s2 for a good politician and e2 = 1 s2 for a bad politician. In terms of the distributive policy, the policy maker of groupJ chooses J2 = and K2 = forK 6=J, i.e. giving the biggest reward that he can to his own group.
Given these period two policy choices, consider the decision of enfran-chised citizens in an open contest between two randomly chosen candidates from groups A and B. As the type of candidates is unknown to them, both candidates will produce with probability if elected. Group J citizens prefer their own group’s candidate who will choose J2 = to the other group’s candidate who will choose J2 = . Therefore, all group A enfran-chised citizens support the groupAcandidate while all groupB enfranchised citizens support the group B candidate, implying that the share of support that a groupAcandidate receives is =( + (1 )). The probability that group A retains power in an open contest is therefore:
( =( + (1 ))) ( ; ):
This probability is key to understand whether autocracy is successful. Turning now to period one, the distributive policy is again straightfor-ward. As the period one policy maker is a member of group A, he will set A1 = and B1 = . Good policy makers always make the right decision
on the general interest policy so that e1 =s1. The only issue concerns how bad policy makers behave. To work out the bad policy maker’s incentive to produce , we must compare his payo¤s from the good and bad actions. If he stays in power, his expected period two payo¤ is + T. If he is removed from o¢ ce, then he will get the payo¤ of a group A citizen: + T with probability ( ; ), and + T with probability 1 ( ; ).
Let ( ) be the probability that the period one policy maker will stay in o¢ ce if he produces a payo¤ of 2 f0; g from the general interest policy. The bad policy maker’s period two payo¤ from producing a payo¤ of to the citizens in period one is:19
( ) ( + T) + (1 ( )) [ + ( ; ) T + (1 ( ; )) T]: Using this, it is easy to see that the bad policy maker will produce the good action in period one if:
[ ( ) (0)] [ + (1 ( ; )) ( )T] + > r1:
Consequently, the probability that a bad policy maker chooses the right general interest action in period one, denoted by , is
=G([ ( ) (0)] [ + (1 ( ; )) ( )T] + ).
The bad politician is motivated to choose the right general interest policy by two sources of future rents. The …rst is the personal rent that he earns. The second is the group speci…c rent ( )T. The latter is relevant only if his group may lose o¢ ce in an open contest, i.e. if ( ; )<1:
To understand ( ) (0), we need to examine the behavior of the group A selectorate. Observe that if the policy maker generates , then it is always optimal to retain him. He creates higher group speci…c rents from the redistributive policy (strictly so if ( ; ) < 1), and there is a higher probability of good behavior than would arise in an open contest. To see the second point, the posterior probability that the incumbent policy maker is good having produced the good outcome in period one (by Bayes rule) is:
+ (1 ) ,
19Note that ( ; ) does not depend on . This is because in an open contest both candidates are equally likely to be good. Group B enfranchised citizens, therefore, only care about the distributional policy and always support their own candidate regardless of . This is no longer the case if an open contest ensues even when the selectorate of group
which is at least as large as . Therefore, we have ( ) = 1. If the policy maker does not generate , then the selectorate will …re him if:
(1 ( ; )) ( )T < :
Thus (0) = 0. Poor quality policy makers will be …red as long as the selectorate has a su¢ cient grip on power so that they will keep their group speci…c rents if they decide to replace the policy maker. Otherwise (0) = 1.20
For notational simplicity, de…ne ( )T, which captures the degree of salience of the distributional policy. The above discussion then leads us to the following result:
Proposition 1 In the unique perfect Bayesian equilibrium, the probability that a bad policy maker picks the right general interest action in period one is given as follows:
1. If (1 ( ; )) < then:
=G( + (1 ( ; )) + ): (1)
2. If (1 ( ; )) then:
= 0: (2)
This result says that the selectorate will be able to discipline policy makers in autocracy leading to a good general interest policy choice if their grip on power is su¢ ciently strong. If not, they will fear that removing the policy maker will trigger a contest in which the other group can seize power.21 This suggests that successful autocracies will tend to be those with strong selectorates who can commit to removing bad leaders.
The case where ( ; ) = 0is interesting here and could be thought of as a case of personal rule where the selectorate’s grip on power is dependent on
20We assume that if
(1 ( ; )) ( )T = ;
then the selectorate chooses to retain the incumbent.
21Padro-i-Miquel (2006) uses the same logic to analyze why African dictators have im-plemented ine¢ cient policies.
the speci…c policy maker remaining in power. If , then personal rule in this sense will always result in = 0. This is because the accountability mechanism via the selectorate has no bite. This accords with intuition and often-made empirical claim that personal rule is not conducive to good government. We develop a case study to illustrate this in section 5.3 below. The role of checks and balances ( ) in disciplining autocrats turns out to be subtle. First, if group A retains power for sure ( ( ; ) = 1), there is no role for constraints on the distributional policy making in improving the quality of government. The complete lack of checks and balances could still lead to good policy outcomes if the selectorate is securely in power. Other-wise, improvements in checks and balances have a non-monotonic impact on the incentive of autocrats to make a good policy. On one hand, improve-ments in checks and balances make the case of successful autocracies more likely. On the other hand, once checks and balances start disciplining bad politicians, further improvements in checks and balances actually undermine their incentive to take the good action. This is because a high level of checks and balances makes an autocrat less concerned about the seizure of power by group B as a result of his bad performance. Finally, if we compare two autocracies with the same level of checks and balances, we could see a stark di¤erence in performance between the two, depending on how salient the distributional issue is due to the size of T.
As we observed above, a key feature of our model is the assumption that a contest for power is triggered only if there is a decision to replace the leader in period one. The role of this assumption can now be assessed. Suppose instead that there is a probability that a contest ensues even if the selectorate chooses to retain the incumbent. The incumbent then competes with a challenger from groupBfor o¢ ce in period two. This does not change the optimal strategy of enfranchised citizens in the contest if(1 ) < .22 However, it weakens the incentive of the leader in case 1 of the Proposition since we would now have:
=G([ ( ; ) + (1 )][ + (1 ( ; )) ] + )
22This condition implies that the policy maker’s group membership is the salient issue if there is a contest for power. Were this not the case, then the group B enfranchised citizens would be content to support a groupAincumbent who had taken the good general interest action in period one if there were a contest for power at the end of period one. Thus a guaranteed contest would strengthen incentives for good behavior in an autocracy as it does in the analysis of democracy with low polarization presented below.
which is decreasing in . Thus the model predicts that, conditional on having an e¤ective selectorate disciplining the leader, political stability (low ) is an asset. This o¤ers a perspective on autocracy that is reminiscent of Olson (1993) who put weight on the power of longer time horizons in improving the quality of government within autocracy.23 However, the exact mechanism in which political stability induces a better quality of autocratic government is di¤erent. In Olson (1993)’s theory, political stability allows an autocrat to internalize the bene…t from good economic policies through an increased amount of tax revenue. In our model, political stability allows the selectorate to discipline an autocrat who otherwise chooses bad policies for his private gains.
3.2
Repression and Bribery of the Selectorate
The basic model assumes that the selectorate is powerful enough to replace the leader if they want to. But autocratic leaders frequently take actions to entrench their power. If such actions were costless, then the leader would always would stay in o¢ ce while setting = 0. However, in reality, such tactics –whether repression by force or bribery –are costly. We now explore the implications of this to illustrate how the good performance of autocracy in Proposition 1 is dependent on limits on actions by incumbents to entrench their power.
Assume that the period one policy maker can pay a cost b > 0 to re-press the selectorate when the latter wishes to remove him from power. If
(1 ( ; )) < , then the bad policy maker prefers repression to choos-ing the bad policy and bechoos-ing ousted as long as the cost of repression is not too high, speci…cally:
b < + (1 ( ; )) .
Under this condition, the bad policy maker will choose repression if: r1 b > :
As a result, the probability that the bad leader chooses the good policy is
=G( + minfb; + (1 ( ; )) g):
It is clear from this that possibility of repression (weakly) reduces the inci-dence of good period one behavior under autocracy. Thus if b = 0(costless repression), then = 0 and we are back to the case of bad autocracy (case 2 in Proposition 1).
Bribery to stay in o¢ ce is also a possibility. Suppose that the policy maker can make a transfer to each member of the selectorate in exchange for supporting him to stay in o¢ ce after he has taken the bad action. Then he may prefer this strategy to taking the good action if the bribe that he would have to pay is small enough. The total cost of bribing the selectorate is:
n [ (1 ( ; )) ]:
This makes bribery preferable if:
[ (1 ( ; )) ] (1 +n )< :
This is more likely to be satis…ed when the selectorate is small – the result in Proposition 1 still holds for large enough n . This case, in particular, emphasizes that it need not be the benevolence of the selectorate that drives good autocracy but having a large enough group to make bribery unattrac-tive.
This extension further emphasizes the need for an e¤ective group to man-age leadership transitions. To the extent that prevention of repression and bribery can be institutionalized, we expect autocracy to work better. This analysis also makes clear that (the future value of staying in o¢ ce) is im-portant in shaping incentives. Severe punishments for poorly performing leaders after they leave o¢ ce are doubled-edged. On one hand, they im-prove incentives if repression and bribery are absent. On the other, they increase the incentive to use malign tactics to stay in o¢ ce. Thus the model shows why negotiating attractive exit arrangements for bad leaders could sometimes improve policy outcomes.
3.3
Comparison with Democracy
We now contrast the model above with a stylized representation of democ-racy. This is a non-trivial comparison since it is well-known from the litera-ture on political agency models (see, for example, Besley 2006) that elections are an imperfect way of providing incentives for good policies.
Now assume that all citizens are enfranchised with each having one vote: n =N, = , and = 1.24 The key feature of democracy that we model here is a guaranteed contest for power at the end of period one even when group A citizens prefer retaining the incumbent policy maker. The timing of the game is the same except for steps 3 and 4, which are now as follows:
3. Citizens from groupAdecide whether to support the incumbent policy maker or a randomly picked citizen from groupA whose type (good or bad) is unobservable to citizens (i.e. a primary election).
4. All citizens decide which candidate to support, the groupA candidate chosen in step 3 or a randomly picked citizen from groupB whose type (good or bad) is unobservable to citizens. The groupAcandidate wins with probability ( ).
The remaining structure of the game is otherwise the same as before. If group A citizens decide not to support the incumbent in a primary election, the electoral outcome that follows is exactly the same as that of an open contest in the model of autocracy with group A’s winning probability being ( ;1) = ( ). The di¤erence comes from a case in which group A citizens decide to support the incumbent in a primary election. This case emerges if the incumbent takes a good action in period one, because otherwise group Acitizens are strictly better o¤ by replacing the incumbent with a randomly picked candidate.25 A key issue in a democracy concerns
24If >1, the model of democracy in this subsection can be that of what Levitsky and Way (2002) call competitive authoritarianism, a regime in which elections with universal su¤rage are regularly held with opposition groups systematically harassed so that the number of e¤ective votes per person is less than one for opposition groups.
25To see this, let ( 0) be the probability that the incumbent who did not produce
wins in an election, and ( 00)be the probability that a randomly picked groupAcandidate
wins. GroupAcitizens’expected period two payo¤ is
( 0) T+ (1 ( 0))( + T)
if they let the incumbent run for re-election, and
+ ( 00) T+ (1 ( 00)) T
if they support a randomly picked candidate. Therefore, they prefer kicking out the incumbent in a primary election if
whether citizens from groupB reward the group Aincumbent for taking the general interest action. This depends on how salient is the general interest policy relative to the distributional policy.
We …rst look at the case in which the distributional policy is more salient:
(1 ) < :
This condition says that groupB voters will always support a candidate from their own group even if the groupA candidate is known to be good. In this case, the share of votes the incumbent undertaking a good action in period one obtains will be = . Consequently, if a bad incumbent chooses a good policy so that group A citizens support him in a primary election, his expected period two payo¤ is
( )( + T) + (1 ( ))( + T).
If he chooses a bad policy, he will be removed in a primary election and his expected period two payo¤ is therefore
( )( + T) + (1 ( ))( + T).
Comparing these two payo¤s, it is straightforward to see that the probability that a bad incumbent chooses a good action is
=G( ( )( ) + ): (3) Since group B citizens are not responsive to the policy maker’s reputation, only private rents motivate good behavior. This is because the distribution of group speci…c rents does not depend on which general interest policy is adopted in period one. In addition, private rents are discounted by the probability of re-election, ( ), which can be less than one. The regularized contest for power coupled with the lack of responsiveness by groupB citizens even undermines the motivation of policy makers stemming from private gains.
We next turn to a situation where the general interest policy is more salient:
(1 )
( 00)is always equal to ( ). ( 0)is also equal to ( )if groupAnever supports group
B candidate (i.e. <( )T). If groupAprefers groupBcandidate to a bad group
A politician (i.e. ( )T), ( 0) = 0. Therefore, the above inequality always
We will look at the best performance of democracy that can be sustained in this case. Suppose that all group B citizens will support a candidate from group A who takes the good action in period one. Then, the outcome is equivalent to the good autocracy case in section 3.1. It is straightforward to see that
=G( + (1 ( )) + ): (4) Good behavior by the period one policy maker is now rewarded with personal rents in period two for sure and by an increase in the probability of retaining group speci…c rents. This will be an equilibrium consistent with Bayes rule provided that at this value of :
(1 ) (1 )
+ (1 ) > ,
which will always hold for a su¢ ciently low value of .26
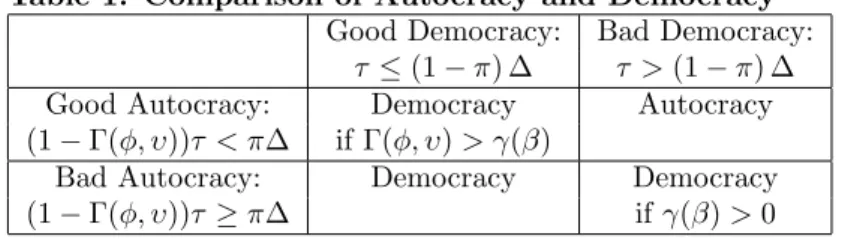
We now compare the performance of autocracy and democracy in terms of the probability of disciplining the bad incumbent. Table 1 shows which political system is better in each of four main parameter regions. When
26If this condition does not hold, then there will be a mixed strategy equilibrium with a lower level of . This is a little tricky as it is not entirely obvious how to put mixed strategies together with probabilistic voting. However, de…ne:
2 4(1 ) 1 ^ + (1 ) ^ 3 5 =
Then we require that ^ is a …xed point of the mapping
^ =G ^ ( ) + ^ ( ) ] +
where ( )<1is the probability of re-election given that the incumbent has produced . Since all group B voters are, by construction, indi¤erent between group Aand group B
candidates at ^, we suppose that a proportion of the groupB voters support the group
Acandidate ex ante (i.e. before the aggregate shock takes place) so that:
^ = ( + (1 ) (1 ) (1 )):
The key observation is that any equilibrium where = ^, must have less good behavior by the leader so that the equilibrium behavior in (4) is an upper bound on the performance of democracy consistent with the level of checks and balances in place.
the distributional issue is of little importance (a very small as in the top-left cell), democracy performs better as long as ( ) < ( ; ) (compare equations (1) and (4)), i.e. power is more contestable in a democracy. Thus democracy is better in so far as it strengthens the power of the opposition and increases the group speci…c rent that motivates a bad politician to stay in o¢ ce.
When the distributional issue is very important (a very large as in the bottom-right cell in Table 1), we see, by comparing equations (2) and (3), that democracy performs better as long as democratic competition does not entirely prevent group A from holding power ( ( ) > 0). When the distributional issue is very salient, the selectorate in autocracy is unable to discipline the policy maker. However, in democracy the fact that group A citizens regularly face competition from groupB allows them to discipline a bad politician.
Which of the o¤-diagonal cells in Table 1 is the relevant parameter region depends on the size of ( ; ). If(1 )(1 ( ; )) , then the bottom-left cell is relevant. In this case, democracy always performs better (compare (2) and (4)). In this case, ( ; ) is not large enough for the selectorate to credibly threaten to remove a bad politician if he behaves badly. On the other hand, in democracy, group B citizens are responsive to the policy maker’s good behavior, giving the incumbent an incentive to behave well. Broader political participation in a democracy is bene…cial in this case.
If ( ; ) is large enough so that (1 )(1 ( ; ))< , we are in the top-right cell in which autocracy performs better than democracy (compare (1) and (3)). In this case, the distributional issue is relatively important, making groupB citizens unresponsive to the good action by the incumbent. In a democracy, this unresponsiveness undermines a bad politician’s incentive for good action. In an autocracy, however, groupB has very little in‡uence on leadership selection due to a high ( ; ). This exclusion of groupBfrom political participation creates an incentive for a bad politician to undertake good policy because group A does not fear losing power after replacing the leader.
The above analysis suggests that, as long as the selectorate has a strong hold over power, autocracy is a better form of government if the distrib-utional issue is neither too salient nor too irrelevant. In all other cases, however, democracy is a better form of government, at least under the plau-sible condition that 0 < ( )< ( ; ). Thus, while the approach that we have taken shows why successful autocracy is a possibility, it is suggestive of
why democracy is broadly superior in promoting general interest policies. While the analysis is very simple indeed, it gives a novel take on the di¤erence between autocracy and democracy in delivering policies. There is no easy ranking between democracy and autocracy— it depends on the institutional setting and the environment in which system of government is implemented. For a given level of the salience of the distributional issue (a …xed ), the model suggests a natural ordering among a cross-section of democracies and autocracies in terms of implementation of general interest policies. Best of all is responsive democracy where general interest poli-cies are salient (a large ). Second best is successful autocracy, requiring an e¤ective selectorate. Next is polarized democracy where elections do not reward good general interest policies. Worst of all is bad autocracy where leaders are able to hold on to power regardless of their performance while in o¢ ce. This could explain the longer lower tail of the performance distribution among autocracies, as seen in Figure 1.
However, Figure 1 also shows that autocracy has a longer upper tail in the performance distribution. Our model can explain this by assuming that the extent of constraints on distributional issues (as proxied by ( )) is lower in a political system without regularized contests for power. Comparing equations (1) and (4) reveals that even if ( ) < ( ; ), autocracy can perform better because the policy maker is motivated more by group speci…c rents. The lack of constraints on autocratic leaders in making distributional policies may explain why some autocracies perform better than the best of all democracies. Thus there are likely to be important interaction e¤ects between the di¤erent dimensions of government institutions as measured in data sets like POLITY IV.
3.4
Discussion
Padro-i-Miquel (2006) is many ways the closest contribution to this paper. Although it is not discussed explicitly, his model also predicts that secure power of the selectorate (high ( ; )) improves the policy-maker’s perfor-mance. What distinguishes our model from his is the e¤ect of institution-alizing participation by the opposition group in leadership selection. In Padro-i-Miquel (2006)’s model, the institutionalized participation by the op-position prevents an autocrat from expropriating them at his will, which in turn reduces the ruling group’s fear of losing power and allows them to dis-cipline the autocrat. In our model, allowing the opposition to participate
in leadership selection may not improve the policy choice if the distribu-tional policy is more salient. The di¤erence stems from our assumption that distributional policy making depends on checks and balances and the group identity of the policy maker. Moreover, the contest for power does not discipline the incumbent in this policy dimension.
The model has deliberately focused on the incidence of common interest policy decisions in democracy and autocracy. This makes sense as the per-formance metric that it invokes is uncontroversial. However, it is clear that the distributional outcomes under all the cases that we have studied may be quite di¤erent. Thus, there could be a preference for one regime or another on distributional grounds. For example, in the case of successful autocracy, power is monopolized by group A and this may not be good from a social point of view. A more complete treatment of the issues would clearly have to widen the perspective that we have taken here by taking a stance on a welfare criterion that pays attention to distributional issues.
We also assumed that the fraction of good politicians is …xed in com-paring across political regimes. However, the model makes clear that can a¤ect the quality of government, both directly in determining whether good actions are taken and indirectly by changing the political equilibrium. Besley (2005) emphasizes the importance of selection mechanisms in politi-cal regimes both in history and comparing contemporary politipoliti-cal regimes. More open access to political life could be an important di¤erence between autocracy and democracy which would a¤ect the comparison in a way that is not modeled in our baseline case.27
Perhaps the most interesting possibility for future work is to appraise the way in which this framework predicts the evolution of institutional choices over time. We should expect autocracy and democracy to prevail when they are successful. Thus there should be a bias (among long-lived regimes) to-wards cases where (in terms of the model) the equilibrium policy outcomes are (1) and (4). But for that democracy requires good checks and balances with general interest policies being more salient. Equally, successful autocracy requires a strong, hard-to-repress or hard-to-bribe, selectorate. However, coping with weak checks and balances (and polarization) should be less of an issue for producing general interest actions in autocracy.
Perhaps the main attraction of the approach taken here is that it gets
27Rauch (2001) can be seen as an attempt to endogenize in our model in the context of autocratic regimes.
the focus on institutional features that shape policy incentives. Within the con…nes of institutional variants such as autocracy and democracy, we have emphasized the sources of heterogeneous outcomes which are typical of the data.
4
Successful Autocracies?
In this section, we look at autocracies empirically. This analysis serves two purposes. The …rst is to show that there are indeed cases of successful au-tocracies according to objective criteria. Although we have some sense of which autocracies are more successful than others (e.g. the Chinese com-munist regime versus African dictatorships), to the best of our knowledge, there has been no systematic analysis to identify good autocracies empiri-cally. The second aim of this section is to identify the cases of successful autocracy which we will use to investigate the validity of our theory in the next section. By relying on objective criteria to identify successful autoc-racies, we avoid arbitrarily selecting only cases that are consistent with our theory.
To identify successful autocracies, we …rst need to decide how to de…ne an autocracy empirically. Ideally, the de…nition should closely follow the char-acterization of autocracy in our theory: the absence of regularized contest for leadership. In addition, to capture heterogeneous institutional features among autocracies, we should separate periods of autocratic rule by the de-gree of constraints on the executive in making distributional policy ( ), the proportion of the selectorate among enfranchised citizens ( ), and the way enfranchised citizens exercise their power ( ).
Due to lack of such data covering a long period of time, however, we rely on the Polity data base (POLITY IV, version 2004) because its coverage of the sample period is the longest among appropriate datasets. We adopt the following procedure to divide country-years into autocratic and democratic regimes. First, for each country, we divide years from 1800 or independence until 2004 between democratic and autocratic periods according to the Polity score. The Polity score, ranging from -10 to 10, measures the degree of democracy.28 If the Polity score is positive, we treat such a year as
demo-28If the Polity score is either -66 (foreign occupation), -77 (anarchy), or -88 (regime transition periods), we see it as a year without a regime.
cratic. Years with a non-positive Polity score are autocratic.29 To capture heterogeneity among autocracies and democracies, we further divide consecu-tive democratic and autocratic years into di¤erent regimes if there is a change in authority characteristics according to the Polity data set: the method of chief executive recruitment (EXREC), the constraint on chief executive (EX-CONST), and political participation (POLCOMP). These three dimensions of authority characteristics measured in the Polity data base loosely corre-spond to institutional features of autocracy in our model: EXREC for the presence of regularized contest for executive power, EXCONST for checks and balances on the distributional policy, and POLCOMP for the proba-bility that the selectorate stays in power when the incumbent is replaced ( ( ; )).
In sum, we de…ne a “regime”as consecutive years with the same authority characteristics. A regime is autocratic if its POLITY score is non-positive. Below, we restrict our attention to regimes that lasted at least …ve full cal-endar years. Autocratic regimes of shorter length may perform very well simply because of luck or just by “inheriting” a good performance from the previous regime.
In the following subsections, we …rst identify autocracies successful in achieving economic growth. We then turn to autocracies successful in hu-man development: health and education. These two investigations identify the core set of successful autocracies, successful in at least two dimensions of performance among the three (growth, health, and education). We check the robustness of the selection of these autocracies to alternative de…nitions of autocracy. Finally, we show that “standard”exogenous characteristics of countries identi…ed by the literature on the quality of government and insti-tutions do not fully predict whether a country has a successful autocracy.
4.1
Economically Successful Autocracies
We measure each regime’s economic performance as follows. Suppose that a regime starts in year sand ends in yeart. We calculate the regime’s annual economic growth rate as
lnYt 1 lnYs
t 1 s ; (5)
where Yt is real GDP per capita in yeart, taken from the Penn World Table version 6.2 (the variable RGDPCH).30
We then obtain the 80th percentile of the distribution of annual growth rates among all regimes, including democratic ones (313 in total). We regard an autocratic regime as successful if its annual growth rate exceeds this 80th percentile of the distribution.31
Table 2 shows the list of economically successful autocracies obtained by the above procedure. There are 35 autocratic regimes whose annual growth rate is above the 80th percentile of the distribution. The list includes East Asian autocracies well-known for high economic growth such as China, In-donesia, Singapore, South Korea, Taiwan, and Thailand. Dictatorships in southern Europe are also in the list. On the other hand, there are lesser-known autocracies as well: a couple of African countries in the 1960s (Gabon and Togo), those in the Middle East (Iraq in the 1970s, Syria in the 1960s), communist regimes in East Europe (Poland, Romania), and a few Latin American countries (Ecuador in the 1970s, Peru and Venezuela in the 1950s). Overall, the table shows that there are indeed successful autocracies in terms of economic growth.
Measuring success based on annual growth rates may not be an accurate way of assessing economic performance of regimes, however. One concern is that a regime’s growth rate may pick up the e¤ect of country characteristics. Whatever regime may exist, it can be that a country’s economy grows any-way. Another concern is that an economy under a certain regime may grow rapidly solely due to the convergence e¤ect if the regime starts with very low per capita GDP. Finally, a regime may perform well simply because it succeeds the previous regime which devastated the economy.
To deal with these concerns, we conduct three alternative assessments of success. First, we subtract the country’s annual economic growth rate from each regime’s growth rate, obtain the 80th percentile of the demeaned growth rates among all regimes, and check whether autocratic regimes in
30We chooset 1rather thantas the end year for calculating annual growth rate because
Yt may re‡ect an economic turmoil caused by the regime change and/or the succeeding regime. In a few cases where the succeeding regime starts on January 1 of the next year, we useYtinstead ofYt 1. If GDP observations are not available for the entire period of
a regime, we use the …rst and/or the last observation to calculate the growth rate. In doing so, we drop regimes with less than …ve years of GDP observations.
31 Note that this procedure would yield very few successful autocracies if most regimes in the top quintile of the growth distribution were democratic.
Table 2 are above the 80th percentile. This procedure removes “country …xed e¤ects” from the measure of performance of each regime. Second, we group regimes into …ve quintiles according to their initial GDP per capita (Ys in equation (5)), obtain each quintile’s average growth rate, subtract it from each regime’s growth rate, calculate the 80th percentile of the demeaned growth rates among all regimes, and check whether autocratic regimes in Table 2 are above the 80th percentile. As a result, the convergence e¤ect is removed from each regime’s performance measure. Finally, we discount a regime’s success if it does not survive ten years or longer and if it follows a three-year period of negative growth (i.e. Ys Ys 3 <0), because such a regime can perform well simply due to a “reconstruction” e¤ect.32
The three columns to the right in Table 2 show the results from these three robustness checks. Among the 35 successful autocracies, 21 survive all the robustness checks that are applicable. The …rst robustness check turns out to be tough for East Asian autocracies since these countries grew consistently over time. Notwithstanding, China since 1976, South Korea in the 1980s, Thailand in the 1960s, and Indonesia since 1967 survive this test, proving to be very successful autocracies.
4.2
Autocracies Successful in Human Development
We now turn to human development. To measure success in this sphere, we …rst remove the e¤ect of real GDP per capita by obtaining the residuals from the following equation estimated for each cross-section of countries in year t: Ht= + Yt+ (Yt)2+"t; (6)
whereHtis either life expectancy at birth in yeart, obtained fromWorld De-velopment Indicators (September 2006 edition), or the gross primary school enrollment ratio in year t obtained from UNESCO Institute for Statistics (through the EdStats web site maintained by the World Bank).33 We include
32Note that this procedure is not applicable to regimes for which Y
s 3 is not available
in the data.
33For life expectancy, years 1960, 1962, 1967, 1970, 1972, 1977, 1980, 1982, 1985, 1987, 1990, 1992, 1995, 1997, 2000, 2002, 2003, and 2004 are chosen because data for a sizable number of countries is available for these years. For primary school enrollment ratio, years 1970, 1975, 1980, 1985, 1990-1996, and 1999-2004 are chosen for the same reason. For Taiwan, we use data taken from the 1987 (for health), 1994 (for education), and 2005 (for both) issues ofStatistical Yearbook of the Republic of China.
the squared term of per capita income as a regressor because health and edu-cation exhibit a strong non-linear relationship with income in a cross-section of countries.34 We can interpret the residuals as partly re‡ecting government e¤orts to promote human development through public health interventions and developing schooling systems.
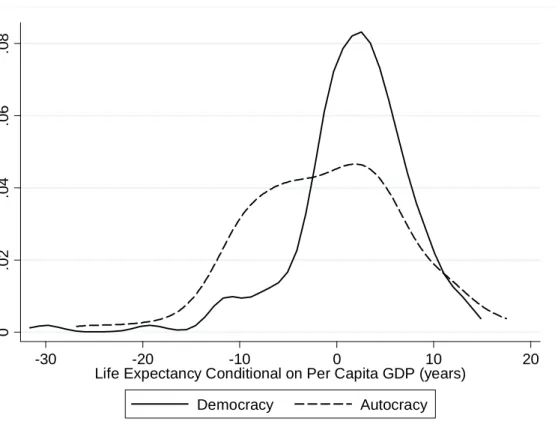
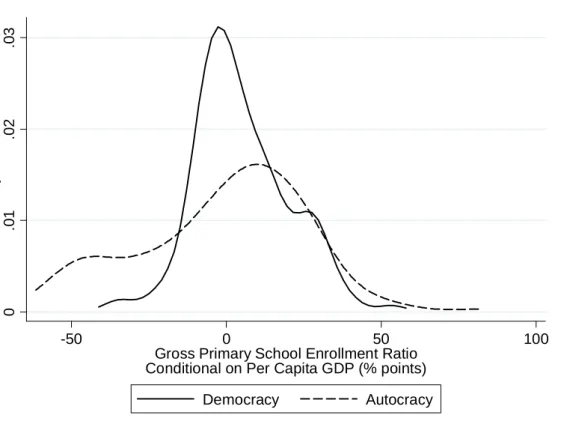
We average the residuals for each regime and calculate the 80th percentile of its distribution among all regimes (307 for health and 275 for education).35 We also perform the …rst of the three robustness checks that we conducted for economic performance (i.e. removing “country …xed e¤ects”). Tables 3 and 4 list successful autocracies in terms of health and education, respectively. Communist regimes in China, Cuba, Poland, Romania, and Vietnam appear in these tables. For health, regimes in the Middle East and North Africa enter the list (Algeria, Iraq, Jordan, Morocco, Syria, Tunisia) while the list for education includes a number of African regimes.
Figures 2 and 3 show the distributions of the mean residuals across demo-cratic and autodemo-cratic regimes for health and education, respectively. Figure 2 con…rms the …nding by Besley and Kudamatsu (2006) that democracies have higher life expectancy than autocracies conditional upon income per capita. In addition, both …gures show that the performance of autocracies is more heterogeneous than that of democracies for human development.36
4.3
Robustness
In order to identify autocracies that are successful in at least two dimensions of performance among the three (economic growth, health production, and education), we assign the score of success to each regime which is equal to the number of the league tables in which a regime appears. If a regime passes all the applicable robustness check in each table, one more point is added to the score in each case. The highest score is, therefore, six. We choose four as the cut-o¤ because this ensures success in at least two dimensions
34Preston (1975) …nds this non-linear relationship for health. It turns out that a similar non-linear relationship can be found for primary school enrollment.
35In calculating the average residual for each regime, we exclude the residuals in the …rst year of each regime because they may re‡ect political instability caused by regime change or the achievement by the previous regime.
36The lower tail of the distribution for democracies in Figure 2 (below -15 years) only includes two regimes: South Africa (since 1994) at -19.3 years and Botswana (since 1997) at -30 years, both of which su¤er severely from HIV epidemics.