STUDY ON STRESS-STRAIN
PROPERTIES OF REACTIVE
POWDER CONCRETE UNDER
UNIAXIAL COMPRESSION
S. LAVANYA PRABHA,
*Ph.D student, JNT University, Hyderabad,India,
J.K.DATTATREYA, Scientist, Concrete Composite Lab,
CSIR-SERC, Chennai,India, M.NEELAMEGAM,
Scientist,
Advanced Concrete Testing and Evaluation Lab, CSIR-SERC,
Chennai.India,,
M.V.SESHAGIRI RAO
Professor & Head of Civil Engineering Department, JNT University,
Hyderabad,India,
Abstract
Reactive Powder Concrete(RPC) which is a new type of improved high strength concrete, is a recent development in concrete technology. Because the material is intrinsically strong in compression, the stress-strain behaviour of RPC under compression is of considerable interest in the design of RPC members and accurate prediction of their structural behaviour. An attempt has been made in the present study to determine the complete strain curves from uniaxial compression tests. The effect of material composition on the stress-strain behaviour and the compression toughness are presented in the paper. The highest cylinder compressive strength of 171.3 MPa and elastic modulus of 44.8 GPa were recorded for 2% 13 mm Fibres. The optimum Fibre content was found to be 3% of 6mm or 2% of 13 mm. A new measure of compression toughness known as MTI (modified toughness index) is proposed and it is found to range from 2.64 to 4.65 for RPC mixes Keywords: RPC, Fibre, Stress, Strain, Elastic modulus, Uniaxial Compression/
1.0 Introduction
in this paper. The effect of material composition on Elastic Modulus and the compression toughness are investigated
.
3.0 Stress-strain Behaviour of RPC
Ultra-High Performance Fibre-Reinforced Concrete (UHPFRC) is a new class of concretes that has been developed in recent years. When compared with high performance concrete (HPC), UHPFRC exhibits superior properties in terms of compressive behavior, tensile behavior, and durability. A research program was undertaken by Graybeal., et., al.,((2007) to characterize many of the behaviors relevant to the use of UHPFRC in the highway bridge industry. Full compression stress-strain response data was also collected for cylinder specimens. The results [Fig. 1] clearly indicated the change in the behavior of for untreated UHPFRC as the curing of the concrete progresses. As the compressive strength increases, the pre-peak nonlinearity and the post-peak strain capacity both decrease. Comparison of responses for steam-treated cylinders indicated that, regardless of the age of the cylinder, after the steam treatment is applied, the basic shape of the ascending branch of the compressive stress-strain response remained unchanged.
Fig. 1 Effect of Age on Stress-strain Response of UHPC [Graybeal 2006]
Fig. 2 Stress-strain Curve of RPC and Failure Pattern [ Jungwirth, 2002]
4.0 Need for the Present Study
Very few investigations reported the complete stress-strain behaviour of RPC. There is considerable difference in the test procedures and the stress-strain pattern reported in the literature. The, effect of different parameters on stress-strain characteristics are not investigated in detail. The toughness index in compression for RPCs and the effect of fibre content on the same has not been reported.
5.0 Experimental Program
5.1 Formulation and properties of RPC
An Ultra High Performance Concrete formulation developed at the Structural Engineering Research Center, Chennai based on extensive investigations [Dattatreya et al(2007)] was used for production of RPC cylinders of 100mm diameter and 200mm height. The stress-strain behaviour of cylinders with various combinations of Fibre content was investigated under uniaxial compressive loading. The various experimental activities involved in this study are presented in the following paragraphs.
5.1.1 Material Used
The materials used in the present investigation are listed below:
1. Ordinary Portland cement of Grade 53 conforming to IS: 12269 : 1987 2. Silica Fume
3. Quartz powder 4. Standard Ennore sand
5. Poly-acrylic ester type Superplasticizer
6. Steel Fibre of dia. 0.16mm and 6mm & 13mm length having tensile strength of 2000MPa.
5.1.2 Mix Composition
The mix proportion per m3 of Reactive Powder concrete mix formulation are shown in
RPC - 3% 13mm 1 0.25 0.4 1.1 0.20 2.5 3%
RPC - 1%+1% 6mm+13mm 1 0.25 0.4 1.1 0.17 2.25 2%
RPC - 1%+2% 6mm+13mm 1 0.25 0.4 1.1 0.20 2.5 3%
Note: C – Cement, SF – Silica fume, Q – Quartz, FA – Fine aggregate, CA – Coarse aggregate, W – Water, SP – Superplasticizers (quantity of SP represented in percentage by weight of cement material), SF – Steel Fibres (quantity of SF is represented in
percentage by volume of the total mixture)
5.1.3 Mixing
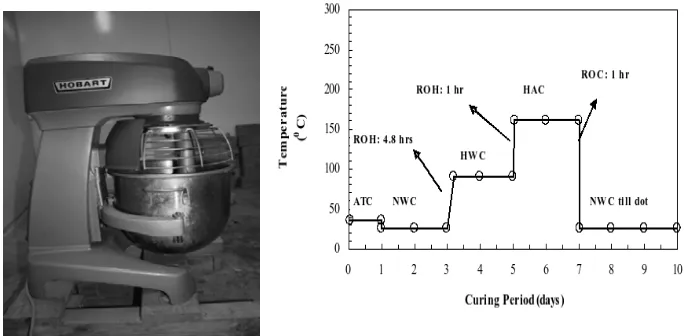
A Hobart Planetary mixer (Fig.3) machine (10 kg capacity) was used to mix the RPC.
Fig-3 Hobart Mixture Machine Fig. 4Curing Regime Adopted 5.1.4 Casting
The RPC cylinders of 100mm diameter and 200mm height were cast with various Fibre content and combinations as shown in Table 1.
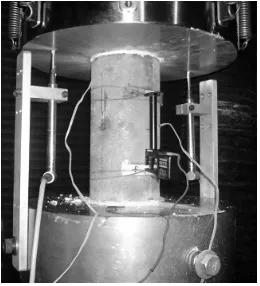
5.1.5 Curing
The curing protocol adopted is indicated in Fig. 4 and is the outcome of a study of different combinations of normal water curing, hot water curing and high temperature curing [Harish, et. al., 2008].
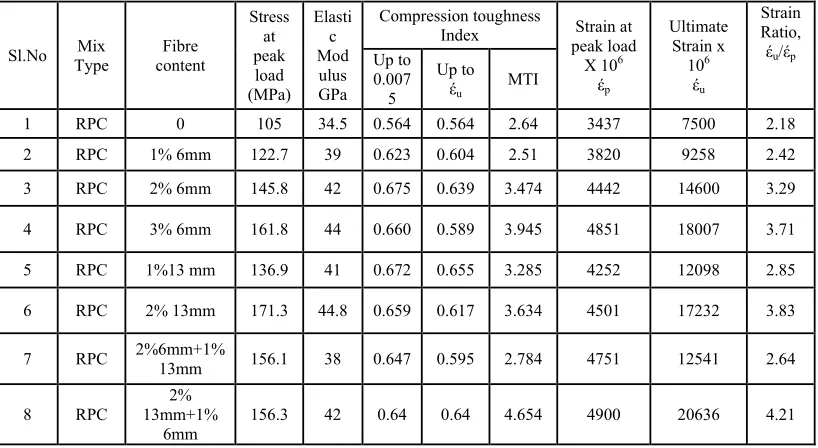
Fig-5 Testing of cylinders for uniaxial compression
at CSIR-SERC, Chennai. The specimen was put on the bottom centre of circular platen of the instrument. The specimen was also instrumented with two LVDTs for measurement of axial deformation (Fig.5), between the platens as recommended by RILEM Technical Committee TC 148(2000), on strain softening of concrete for the post peak strain monitoring. Two electrical resistance strain gauges fixed at the mid-height of the specimen one in horizontal and another one placed vertically, to measure the axial and circumferential strains. The readings were recorded automatically by a HBM data logger connected to the control system. The specimens were tested under cross head control at a constant deformation rate of 0.2mm/minute until the peak load was reached and after that the load started decreasing (post-peak stage), and the deformation rate was reduced to about 0.05 mm/minute. The test was continued till the load dropped to m than 50% of peak load or until failure.
6.0 Test Results and Discussion
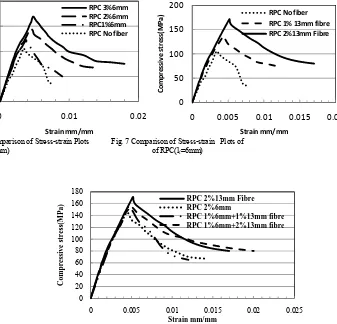
The data on mechanical properties in compression for different mixes were tabulated in Table 2 and typical stress – strain curves for the different mixes are given in Figs. 6-8.The effect of different test parameters are discussed in the following paragraphs.
6.1 Stress-strain Parameters
4 RPC 3% 6mm 161.8 44 0.660 0.589 3.945 4851 18007 3.71
5 RPC 1%13 mm 136.9 41 0.672 0.655 3.285 4252 12098 2.85
6 RPC 2% 13mm 171.3 44.8 0.659 0.617 3.634 4501 17232 3.83
7 RPC 2%6mm+1%
13mm 156.1 38 0.647 0.595 2.784 4751 12541 2.64
8 RPC 2% 13mm+1%
6mm
156.3 42 0.64 0.64 4.654 4900 20636 4.21
6.2 Elastic modulus
The elastic modulus of RPC mixes is found to be 21%(2%6mm) to 24 %(2%13mm) higher than that of RPC with out fibre and the RPC mix with 2%-13mm Fibre recorded the highest elastic modulus of 44.8 GPa. The highest value of 4.65 is obtained for RPC mix with 2% 13 mm + 1% 6mm Fibres which had a reinforcement index RI of 2.[RI=Vf(lf/df)].
6.3Toughness Index
Toughness is a measure of the energy absorption capacity of the material and is used to charcterize the materials ability to resist fracture. The toughness in compression is computed as the area under the stress-strain curve. Many nondimensional toughness indices have been proposed by the reaserachers for Fibre reinforced concrete. Ezeldin and Balaguru(1999), defined the toughness index as the ratio of the area up to a strain of 0.15 to the area of a perfectly plastic material (expressed in MPa. Mm/mm) with an yield strength equal to the peak strength and plastic strain of 0.15 (i.e., σcux0.15). In the present, study, definition of Ezheldin and Balaguru(1999), has been used considering two strain limits 0.0075 and the ultimate strain. Ezheldin and Balaguru(1999), reported toughness index ranging from 0.48 for plain concrete to 0.76 for Fibre concrete. However, as seen from Table 2, the values of toughness indices of RPC mixes as computed by this definition range from 0.561 to 0.675 and do not seem to show any significant variation with increase in Fibre content and aspect ratio. A modified toughness index (MTI) was defined as the ratio of the area of stress-strain curve to pre-peak area of the curve. As seen from Table 2, the value of MTI ranges from 2.64 to 4.65 for RPC mixes and appears to be a better measure of the reinforcing action of Fibres and their crack bridging action.
Fig. 6 Comparison of Stress-strain Plots Fig. 7 Comparison of Stress-strain Plots of RPC(lf=13mm) of RPC(lf=6mm)
Fig. 8 Comparison of Stress-strain Plots of RPC with Fibre Combinations
The stress-strain charcteristics depicted in Figs. 6 to 8 show that RPC mixes have a nearly linear ascending portion and strain at peak stress increases with increase in strength and reinforcement index. The post peak curve is strongly dependent on the Fibre type and Fibre content and it is almost as steep as asending curve for lower Fibre contents and may be more gradually sloping for the higher fibe contents.
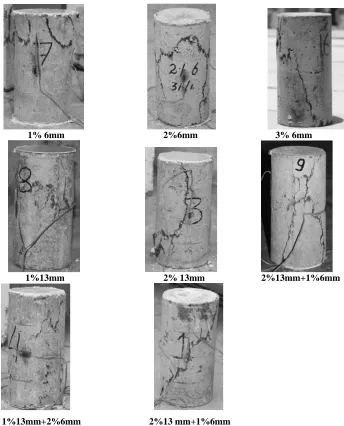
6.4 Crack Pattern
Failure Pattern of typical Fibre reinforced RPC specimens is shown in Fig. 9. As can be seen, the typical failure is by formation of vertical cracks for lower percentage small Fibre reinforcement and diagonal cracks for higher percetages of Fibre reinforcement. It may be noted here that Jungwirth.J(2002), observed that the failure pattern was characterized by a typical diagonal crack. From Fig. 9, it is observed that failure of specimens with higher Fibre volume fractions is associated with multiple cracking and while more localized failure is evident in case of lower Fibre volume fractions. The multiple cracking leads to higher failure strain and the redistribution of stresses leads to higher residual strength.
0 50 100 150 200
0 0.01 0.02
C
o
mpressive
stress(MPa)
Strain mm/mm
RPC 3%6mm
RPC 2%6mm
RPC1%6mm RPC No fiber
0 50 100 150 200
0 0.005 0.01 0.015 0.02
Compressive
stress
(MPa)
Strain mm/mm
RPC No fiber RPC 1% 13mm fibre RPC 2%13mm Fibre
0 20 40 60 80 100 120 140 160 180
0 0.005 0.01 0.015 0.02 0.025
Com pr essi ve st re ss( MP a) Strain mm/mm
RPC 2%13mm Fibre RPC 2%6mm
1% 6mm 2%6mm 3% 6mm
1%13mm 2% 13mm 2%13mm+1%6mm
1%13mm+2%6mm 2%13 mm+1%6mm
Fig. 9Failure patterns of specimens with different Fibre contents in compression
8.0 Conclusions
The following are the observations made from the present study
The RPC mixes showed 38% and 63% higher Compressive Strength Compared with the RPC mix without fibres.
The highest compressive strength of 171.3 MPa was recorded for 2% 13 mm fibres. However, when fibre combinations of 6mm and 13 mm fibre were used, there was a reduction in compressive strength compared to highest compressive strength obtained for single size fibres. This could be attributed to the reduced workability and lower compaction density achieved as indicated by the density ratios.
The elastic modulus of RPC mixes is found to be 21%(2%6mm) to 24 %(2%13mm) higher than that of RPC with out fibre and the RPC mix with 2%-13mm Fibre recorded the highest elastic modulus of 44.8 GPa.
The value of MTI(modified toughness index) ranges from 2.64 to 4.65 for RPC mixes and appears to be a better measure of the reinforcing action of Fibres and their crack bridging action.
The ratio of ultimate to peak strain is the highest for Fibre combination of 2% 13 mm and 1% 6mm(4.65) followed by 2% 13 mm(3.81) mix and 3% 6mm (3.73) mixes.
References
[1] Benjamin A.Graybeal,(2007),“Compressive Behavior of Ultra-High-Performance Fibre-reinforced Concrete” ACI Materials Journal, March/April(2007), pp:146-152.
[2] Chang, T.P., Chen, B.T., Wang, J.J., and Wu, C.S., (2009)“Performance of RPC with Different Conditions and its Retrofitting Effects on cxoncrete members”, Proc., Concrete Repair, Rehabilitation and Retrofitting I, Ed. Alexander et al, Taylor and Francis Group, London, pp1203-1207
[3] Dattatreya, J.K., Harish, K. V. , and Neelamegam,M., “ Use of Particle Packing Theory for the Development of Reactive Powder Concrete”, The Indian Concrete Journal , September (2007), pp 31-45.
[4] Ezheldin, AS and Balaguru, PN, (1999), “Normal and High Strength FRC Under Compression”, Journal of Materials in Civil Engineering, Vol. 4, No. 4, (1999), pp 415-429
[5] Harish,K.V., Dattatreya,J.K., Sabitha,D. and Neelamegam,M.,(2008) “ Role of Ingredients and of Curing Regime in Ultra High Strength Powder Concrete”, Journal of Structural Engineering, Vol.34, No.6, February-March (2008), pp.421-428 [6] Jungwirth J.,(2002) “Underspanned Bridge Structures in Reactive Powder Concrete”, 4th International PhD Symposium in
Civil Engineering, Munich, Germany,2002
[7] Malik, Adnan R, Foster, and Stephen J.,(2010) “Carbon Fibre Reinforced Polymer Confined Reactive Powder Concrete Columns Experimental Investigation”,ACI Structural Journal, May 2010
[8] Richard p. and Cheyrezy M.H., (1995) “composition of reactive powder concrete”, Cement and concrete research 25(7): pp.1501-1511
![Fig. 1 Effect of Age on Stress-strain Response of UHPC [Graybeal 2006]](https://thumb-us.123doks.com/thumbv2/123dok_us/9621551.1490301/2.612.186.423.357.508/fig-effect-age-stress-strain-response-uhpc-graybeal.webp)