Lincoln University Digital Thesis
Copyright
Statement
The
digital
copy
of
this
thesis
is
protected
by
the
Copyright
Act
1994
(New
Zealand).
This
thesis
may
be
consulted
by
you,
provided
you
comply
with
the
provisions
of
the
Act
and
the
following
conditions
of
use:
you
will
use
the
copy
only
for
the
purposes
of
research
or
private
study
you
will
recognise
the
author's
right
to
be
identified
as
the
author
of
the
thesis
and
due
acknowledgement
will
be
made
to
the
author
where
appropriate
you
will
obtain
the
author's
permission
before
publishing
any
material
from
the
thesis.
The Above-Average Effect in an End-User
Computing Context
A Thesis
submitted in partial fulfilment
of the requirements for the Degree of
Doctor of Philosophy
at
Lincoln University
by
Shirley F. Gibbs
Lincoln University
ii
ABSTRACT
Abstract of a thesis submitted in partial fulfilment of the requirements for
the Degree of Doctor of Philosophy
The Above-Average Effect in an End-User Computing Context
by
Shirley F. Gibbs
This thesis investigates how the above-average effect presents in the ubiquitous, fast-changing
domain of end-user computing (EUC). EUC is mandatory in many workplaces but can be performed with different levels of skill. The above-average effect has been the subject of many studies in many different domains, as has end-user computing. This study brings these two areas together using an original approach to understand how processes, such as the above-average effect, interact with personal factors to influence perceptions of EUC skill level in self and others.
The Above-Average Effect is a social bias found in many domains considered routine, or vaguely defined. This bias involves making an unwarranted, positive assessment of the difference between
one’s abilities and knowledge and those of an ‘average person’. Explanations for this effect include
self-enhancement, focalism, ego-centrism and the Dunning-Kruger Effect. The focus of this study was
on the relationship of personal factors, such as age, sex, expertise and personality, with the occurrence of the Above-Average Effect in the context of end-user computing. This context has several characteristics that should make it an ideal setting for the occurrence and investigation of the Above-Average Effect. First, there are few opportunities for end-users to observe directly the ability of others, which contrasts with settings such as driving in which near-continuous observation of
others’ skill level is possible. Second, end-user computing has undergone continuous change that
iii Measures of personal factors, demonstrated skill, self-perceptions of end-user computing skill and
perceptions of the average end-user’s skill were taken from a sample of employed computer end -users. Both objective and subjective measures were used to compare self-reports with demonstrated skill and to test eight hypotheses addressing the Above-Average Effect and the Dunning-Kruger Effect. A results based testing system was developed and validated specifically for assessing end-user skill typical of workplace computing. Measurement of perceptions was undertaken using a visual
analogue scale.
Findings confirmed expectations that the Above-Average Effect is present in the end-user computing domain. In this domain, users often are unaware of the extent of the domain, their own skill level within it or the skill level of other end-users. Unexpectedly, however, it was found that variables that
previous studies had found to be associated with the Above-Average Effect in this study were not significantly associated with the Above-Average Effect when analysed in combination. This suggests the presence of previously unidentified interactions between these variables that lessen the strength of the Above-Average Effect, specific to the domain of end-user computing.
Evidence to support the operation of the Dunning-Kruger Effect as an explanation for the occurrences of the Above-Average Effect was mixed. Findings revealed a significant relationship between self-assessment and estimations of the breadth of the domain. However, there was no
support for an association between a person’s estimation of the breadth of the domain and the
above-average effect. Likewise, there was no support for an association between a combination of
personal and expertise factors and the Dunning-Kruger Effect. As for the Above-Average Effect, this raises questions as to the types of interactions that lead to reduced evidence of the Dunning-Kruger Effect.
It was concluded that (1) the Above-Average Effect is present in end-user computing; (2) interactions between variables individually associated with the Above-Average Effect may moderate the effect;
(3) interactions between variables individually associated with the Dunning-Kruger Effect may moderate the effect, and (4) the domain of EUC has differences that make it stand out from other domains the AAE typically occurs in. Possible explanations for and implications of these findings for theoretical development of the Above-Average Effect and Dunning-Kruger Effect are considered,
iv and its relationship to other variables, especially in ubiquitous, fast changing domains such as
end-user computing.
End-user computing is a vast and fast changing domain that, due to its wide use, is often
misunderstood in terms of complexity and range of use. This study contributes to understanding the AAE in an area not otherwise investigated for this bias. This bias leads to overestimation of skill and knowledge which can present potential problems for accuracy and efficiency of use. This is significant
because these skills are critical to modern workplaces. A further contribution extends to the instrumentation developed. This study has proved the worth of such instruments for use in social settings and shows the VAS provides a more accurate measure of perceptions than do discrete scales.
v
Acknowledgements
Doctoral study is a journey, often not straight forward but one fraught with detours, this one was no different. Throughout what became a long hard road I had immense support from a number of people. The support came in the form of a listening ear when things got difficult, copious cups of coffee, to reading and proof reading or just being there.
I would like to thank my supervision team, Gary Steel, Alan McKinnon and Kevin Moore. The original
team of Gary Steel and Alan McKinnon were there at the beginning guiding and challenging me as required. When Alan retired Kevin Moore joined us (sometimes I am sure Kevin had no idea what he had agreed to). What was meant to be the final sprint to the end soon became an obstacle course, where slow and not always steady became the norm. During this time of particular frustration and
angst Kevin helped me stay strong and instilled a belief that sometimes I found difficult to accept.
My very dear friend Clare was there from the beginning and she rode every wave with me, at the times when it seemed I would never catch a break she was there. Thank you so much. I will never forget the support and love you gave me. Special thanks to Neville for your wisdom and for seeing the ridiculousness of the situation as I saw it. Cindy, your support and friendship is something I will
always cherish. Walt, Pat, Crile and Brad thank you for your concern and support and not running away if I cried.
Thanks also are due to all the participants who gave so willingly of their time to help me in my study. Research of the type I do is impossible without support from willing participants.
vi
Table of Contents
Contents
ABSTRACT ... ii
Acknowledgements ... v
Table of Contents ... vi
Figures ... xi
Tables ... xiii
Glossary and abbreviations ... xvi
Chapter 1 Introduction... 1
1.1 Background ... 1
1.1.1 Social perceptions and social biases ... 2
1.1.2 Workplace end-user computing ... 4
1.2 Thesis statement and aims ... 5
1.3 Research description ... 8
1.4 Thesis Outline ... 9
1.4.1 Chapter 2 –Literature review ... 9
1.4.2 Chapter 3 – Research methods ... 10
1.4.3 Chapter 4 – Results and data analysis ... 11
1.4.4 Chapter 5 – Discussion ... 11
1.4.5 Chapter 6 - Conclusion, Implications, Recommendations and Future research ... 12
1.4.6 Appendices ... 12
Chapter 2 Literature Review ... 13
2.1 Section one - Perceptions of self-ability from a social perspective ... 14
2.1.1 Self-Concept ... 14
2.1.2 Self-Evaluation ... 15
2.1.3 Cognitive Biases ... 17
2.1.3.1 Social biases (in self-evaluation) ... 17
2.1.3.2 Above Average Effect (AAE) ... 18
2.1.3.3 Cognitive mechanisms explaining the above-average effect ... 21
2.2 Individual personal differences ... 25
vii
2.2.1.1 Openness ... 26
2.2.1.2 Agreeableness ... 27
2.2.1.3 Neuroticism ... 28
2.2.1.4 Conscientiousness ... 28
2.2.1.5 Extraversion ... 29
2.2.2 Expertise ... 30
Summary of section one ... 34
2.3 Section two – End-user computing ... 35
2.3.1 Workplace computing requirements ... 36
2.3.2 Evaluating end-user computing competence ... 39
2.3.3 EUC workplace learning and training ... 44
2.3.4 Summary of section two ... 45
2.4 Section three - Summary of literature ... 46
Chapter 3 Method ... 49
3.1 Introduction... 49
3.2 Research paradigm ... 49
3.3 Participants ... 50
3.3.1 Participant age ... 54
3.3.2 Participant gender ... 55
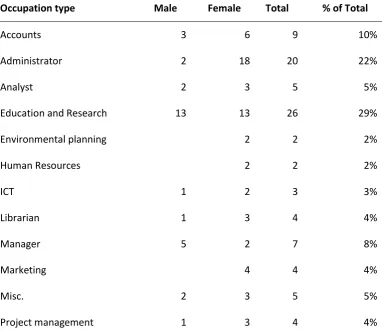
3.3.3 Participant occupation ... 55
3.3.4 Computer usage and number of applications used in job. ... 56
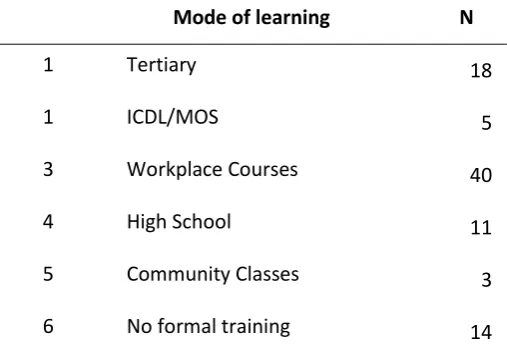
3.3.5 Modes of learning ... 58
3.4 Instrumentation ... 60
3.4.1 Background questionnaire ... 61
3.5 Assessing perceptions of EUC knowledge ... 62
3.5.1 Method used to measure perceptions of EUC knowledge ... 62
3.5.2 Measuring self-assessment and estimations of the average computer end-user’s knowledge ... 65
3.6 Detailed development and evaluation of VAS instrument ... 67
3.6.1 VAS Pilot1 ... 67
3.6.2 VAS Pilot2 ... 68
viii
3.6.4 Implementation of VAS instrument ... 70
3.7 Personality ... 70
3.8 Skill assessment ... 73
3.8.1 Skill-assessment development ... 74
3.8.2 Skill assessment instrument content development ... 75
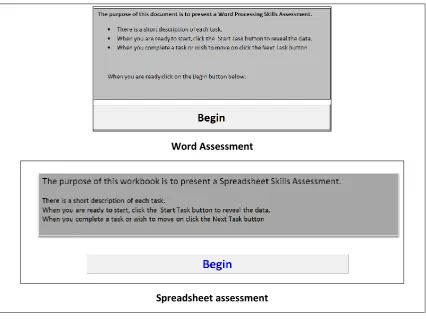
3.8.3 Design of assessment instrument screens ... 83
3.8.4 Implementation of skill assessment instrument ... 85
3.8.5 Evaluation of combined instruments ... 85
3.9 Data Collection ... 86
3.10 Summary of instrument development ... 87
3.10.1 Perception Measure Development and Validation ... 87
3.10.2 Skill Assessment Development and Validation ... 87
3.10.3 Pilot of combined instruments ... 88
3.11 Analysis method ... 88
3.12 Ethical considerations ... 91
Chapter 4 Results ... 92
4.1 Introduction to results ... 92
4.2 Participant characteristics ... 93
4.2.1 Demographic and expertise variables used in analysis ... 93
4.3 Skill assessment results ... 93
4.3.1 Spreadsheet assessment results ... 94
4.3.1.1 Study participants compared with expected average ... 97
4.3.1.2 Spreadsheet assessment result and time taken ... 98
4.3.2 Word-processing assessment results ... 100
4.3.2.1 Study participants compared with expected average ... 104
4.3.2.2 Word-processing assessment result and time taken ... 105
4.3.2.3 Word-processing assessment result and measures of perception ... 106
4.3.3 Combined assessment results ... 107
4.4 Above average effect ... 110
4.4.1 Tests of the above-average effect ... 111
ix
4.4.1.2 Test for H2 ... 114
4.4.1.3 Test for H3 ... 116
4.4.1.4 Test for H4 ... 120
4.4.2 Tests of the Dunning-Kruger Effect ... 121
4.4.2.1 Test for H5 ... 121
4.4.2.2 Test for H6 ... 124
4.4.2.3 Test for H7 ... 126
4.4.3 Bi-variate correlations between predictors of AAE and DKE ... 130
4.5 Summary of results ... 132
4.5.1 Hypotheses developed to test for AAE ... 132
4.5.2 Hypotheses developed to test for DKE ... 134
Chapter 5 Discussion ... 136
5.1 Introduction... 136
5.2 Implications and limitations in understanding the above-average effect ... 137
5.3 The Dunning-Kruger effect ... 147
5.4 End-user Computing ... 153
5.5 Summary of discussion ... 157
Chapter 6 Conclusion, Implications and Future work ... 159
6.1 Introduction... 159
6.2 Contribution of research ... 160
6.3 Theoretical implications of an above-average effect ... 160
6.3.1 Theoretical implications of an above-average effect in an EUC context ... 164
6.4 Methodological implications ... 165
6.5 Implications for computer end-users ... 167
6.6 Recommendations for employers ... 168
6.7 Future research ... 170
6.8 Concluding remarks ... 173
References ... 175
Appendices ... 194
Appendix 1: Participant recruitment ... 194
x
Research consent form ... 196
Research information sheet ... 197
Appendix 2 – Combined Instrument ... 199
Appendix 3: Result data ... 205
Appendix 4: Design and implementation of skill assessment instruments ... 213
Introduction ... 213
Problem Identification... 213
Solution development proposal ... 214
Instrument development ... 214
Software Versions ... 214
Evaluation of approach ... 215
Effectiveness of solution ... 215
Appendix 5: Perception measure development and pilot studies ... 217
Pilot study one ... 217
Pilot study two ... 222
What has pilot 2 told us that pilot 1 did not? ... 224
Limitations of Pilot 2 ... 227
Pilot study three ... 227
Summary of Pilot Study Three ... 231
xi
Figures
Figure 1 - NZ Labour force age group distributions 2011 ... 54
Figure 2 – Distribution of participant ages (years). ... 55
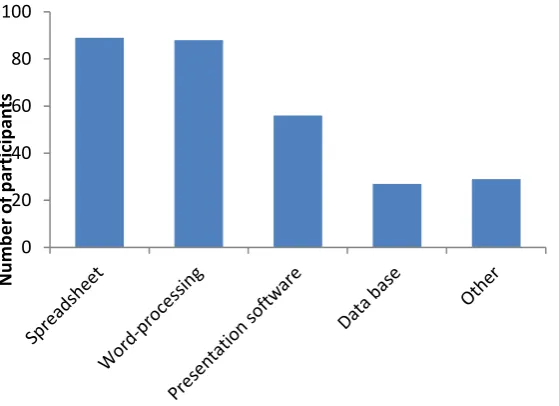
Figure 3 - Software application types used by participants for their employment ... 57
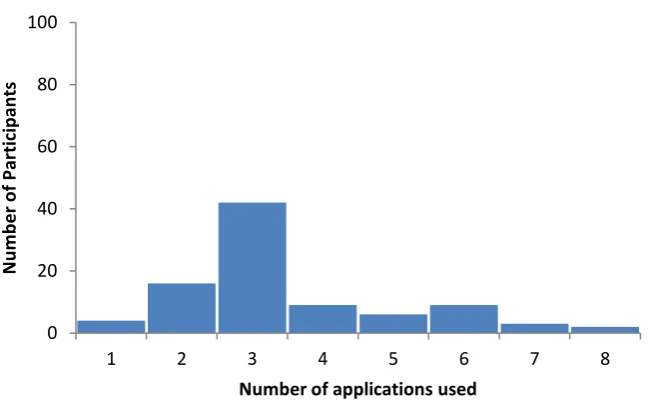
Figure 4 - Frequency distribution for number of applications used by participants ... 58
Figure 5 - Visual Analogue Scales and accompanying questions used in study ... 63
Figure 6 - Example A representation of mark transformations on VAS ... 66
Figure 7 - Example B representation of mark transformations on VAS ... 66
Figure 8- Example C representation of mark transformations on VAS ... 67
Figure 9 - Start pages for the Word and Spreadsheet assessments ... 83
Figure 10 – Task 1 screen for Word assessment instrument ... 84
Figure 11- Task 1 screen for spreadsheet assessment instrument ... 84
Figure 12 - Measure of perception development process ... 87
Figure 13 - Development process of skill assessment instruments ... 88
Figure 14 - Combined instrument ... 88
Figure 15 - Numbers Correct for Spreadsheet Tasks ... 96
Figure 16 - Spreadsheet tasks correct frequency ... 97
Figure 17 - Time taken to complete spreadsheet assessment and number correct ... 99
Figure 18 – Numbers of participants correctly completing each word-processing task ... 103
Figure 19 - Frequency for number of correct word-processing tasks ... 104
xii
Figure 21 - Frequency distribution of total percentage correct... 107
Figure 22- Association between total time taken and combined assessment score ... 108
Figure 23 - Comparison of self-assessment with estimation of average computer end-user ... 111
Figure 24 – Frequencies of self-reported EUC knowledge and that of average computer end-user . 112 Figure 25 - Relationship between self-assessment and measure of AAE ... 114
Figure 26 - Distribution of combined assessment results ... 117
Figure 27 - Frequency distribution of Extent of domain of end-user computing ... 122
Figure 28 - Frequency distribution of self-assessment as a proportion of breadth of EUC ... 123
Figure 29 - Association between perception of EoDEUC and self-assessment ... 124
Figure 30 - Association between perception of EoDEUC and the differences between a self-report and estimations of the AEU. ... 125
Figure 31 - Relationship between assessment results and estimation of breadth of the EUC domain. ... 127
Figure 32 - Version One comparison ... 217
Figure 33 - Version Two comparison ... 217
Figure 34 - Computing Knowledge (Driving as guide) ... 220
Figure 35 - Computing Knowledge (Nature as guide) ... 221
Figure 36 - Pilot Study 2 rating results ... 224
Figure 37 - Percentage of computing each participant considered productivity software ... 225
Figure 38 - Line representing a 1000 page book containing all there is to know about computing .. 228
Figure 39 - Line representing expanded section of knowledge of personal productivity software ... 228
xiii
Tables
Table 1 - Distribution of occupation types ... 56
Table 2 – Frequency of learning approaches ... 59
Table 3-Summary of approaches to learning computer skills ... 60
Table 4 – Descriptive statistics for BFI traits ... 72
Table 5 - Classifications for spreadsheet and word-processing assessments ... 76
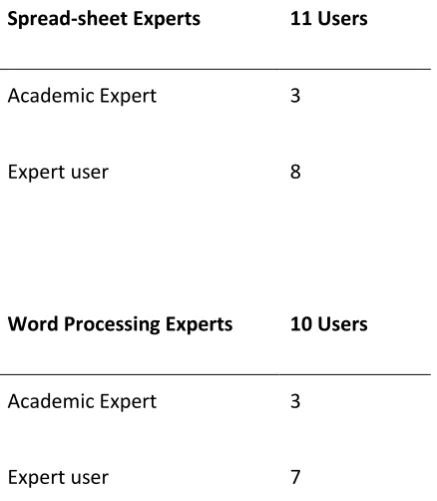
Table 6 - Make-up of SS and WP Expert Panel 1 ... 77
Table 7 - Expert panel 2 ... 77
Table 8 - Spreadsheet assessment tasks for final instrument... 78
Table 9 - Word-processing assessment tasks for final instrument ... 79
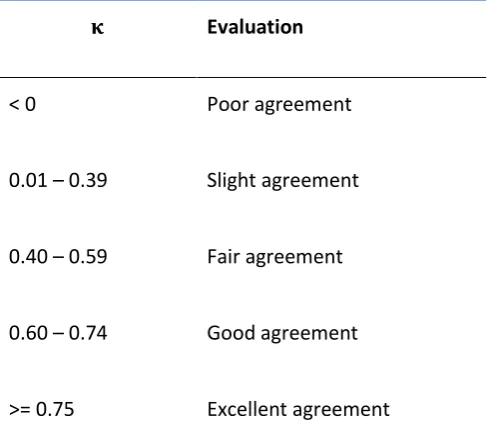
Table 10 –Modified Kappa evaluation (Polit et al., 2007). ... 80
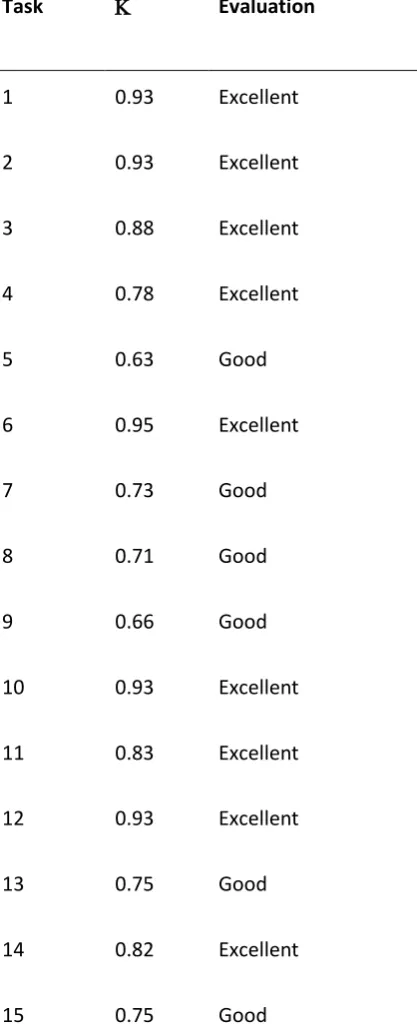
Table 11 - Content Validity Kappa results for Word- processing assessment development testing .... 81
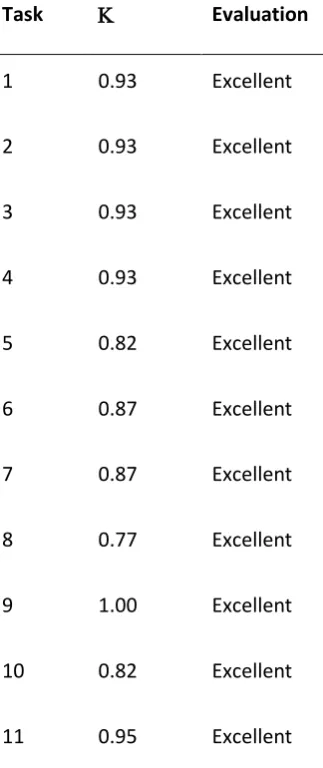
Table 12 - Content Validity Kappa results for spreadsheet assessment development testing ... 82
Table 13 - Summary of spreadsheet results ... 94
Table 14 – Proportion correct for each spreadsheet task ... 95
Table 15- Associations between spreadsheet assessment and measures of perception ... 100
Table 16 – Summary of word-processing results ... 101
Table 17 - Proportion correct for each task ... 102
Table - 18 Assessment results by occupation ... 109
xiv
Table 20 - Self-assessments compared with AEU ... 111
Table 21 - Participant groups showing degree of above-average effect ... 113
Table 22 - Summary for predictors of AAE in end-user computing ... 115
Table 23 - Bootstrap information for relationship between individual differences and the AAE ... 116
Table 24 - Contingency table of self-assessment and combined assessment results ... 118
Table 25- Breakdown of study results compared with panel expectations ... 119
Table 26 - Summary for predictors of AEU's EUC knowledge ... 121
Table 27 - Bootstrap information for association between DKE and AAE ... 126
Table 28 - Results of association between demonstrated ability and EoDEUC ... 127
Table 29 - Bootstrap information for relationship between Estimation of DoEUC and Demonstrated EUC ... 128
Table 30 Predictors of EoDEUC ... 129
Table 31 -Bootstrap information for relationship between expertise, individual differences and demographic factors and the Dunning-Kruger effect ... 130
Table 32 - Significant associations between predictor variables ... 131
Table 33 - Spreadsheet tasks and difficulty ratings ... 205
Table 34 - SS assessment task times (hh:mm:ss) ... 206
Table 35 - Word processing tasks and difficulty level ... 207
Table 36- Summary of times for Word tasks (hh:mm:ss) ... 208
Table 37 Assessment results by occupation ... 209
Table 38 - Bivariate correlations for AAE and DKE predictor Variables ... 210
xv
Table 40 - Pilot one Self-rating and hours by occupation ... 222
Table 41 - Pilot Study 2 summary of results ... 223
Table 42 - Participants by occupation and weekly computer usage ... 226
Table 43 - Participants self-assessment and weekly computer usage by sex ... 227
Table 44 - Summary of results for Pilot 3 ... 229
Table 45 - Summary of Occupations by Self-Rating and EoDEUC ... 230
Table 46 - Participants self-assessment and weekly computer usage by sex ... 231
Table 47 - Bootstrap information for association between demonstrated spreadsheet ability and time taken ... 232
Table 48- Association between demonstrated spreadsheet ability and perception measures ... 232
Table 49- Bootstrap information for association between demonstrated word-processing ability and time taken ... 232
Table 50 - Bootstrap information for associations between Word-processing ability and perception measures ... 233
Table 51 - Bootstrap information for association between self-assessment and estimation of AEU 234 Table 52 - Bootstrap information for associations between perception measures and demonstrated ability ... 234
Table 53- Bootstrap information for associations between Estimation of the AUE and individual differences ... 234
xvi
Glossary and abbreviations
A number of terms that are used continually throughout this chapter have been abbreviated. These terms are explained below.
AAE Above Average Effect
AEU Average computer end-user
Association In statistical terms, an association refers to any relationship between
variables that renders them statistically dependent
BFI Big Five Inventory
DKE Dunning Kruger Effect
ECDL European Computer Drivers Licence*
EoDEUC Extent of Domain
EUC End-user computing
FFM Five Factor Model
ICDL International Computer Drivers Licence*
IITP Institute of Information Technology Professionals
IT Information Technology
MOS
SA
Microsoft Office Specialist
Self-Assessment
xvii TAM Technology Acceptance Model
VAS Visual analogue scale
1
Chapter 1
Introduction
1.1
Background
Bob, who works in a marketing role, is known in his workplace as a spreadsheet expert. This reputation was gained through self-promotion, as Bob truly believes that his spreadsheet skills are at an advanced level. One morning Bob’s boss asks him to review a spreadsheet and to update the analysis sheet to include a pivot table. He looks at the spreadsheet but does not know how to create a pivot table; in fact, Bob is not even sure what a pivot table is. This surprises Bob as he had thought there was not much more to know about
spreadsheets than he already knew, which he believes is more than anyone else does.
This scenario is likely to be familiar to more and more workers in modern economies. In fact, it may be familiar to most people in many areas of their lives as computers, and their use, become
increasingly common. One side effect of the ubiquity of this type of technology is the general
expectation that most people in the workforce will be able to operate it effectively. Relatedly, the expectation by many people who use computers regularly may be that, relative to others, they are skilled users.
Extensive research on social and self-evaluative biases in social psychology, however, suggests that,
often, such self-assessment is overly optimistic, with a person’s demonstrated ability being lower than they perceive it to be. This point is illustrated by the fictitious example of Bob, used above – but its implications are far reaching in today’s world.
The purpose of this study is to investigate relationships between social biases in self-perception and the individual differences of personality and expertise in the context of end-user computing in the
workplace. The context of end-user computing (EUC) has been chosen because this type of
2
In order to achieve the purpose of this study it is necessary to understand why social perceptions are affected by social biases and how these biases are affected by individual differences such as
experience or personality. In the sections that follow an overview of these areas will be provided, as will an outline of how this thesis is structured. The first subject of discussion will be that of social perception, as this type of perception and the biases that may affect perceptions, is at the core of this study.
1.1.1 Social perceptions and social biases
“Whenever two people meet, there are really six people present. There is each man as he sees himself, each man as the other person sees him, and each man as he really is.”
William James
Social perceptions are the perceptions people have about themselves, the social situations they are in and the other people involved in those situations (Hogg & Vaughan, 2008; Markus & Wurf, 1987).
They are formed by a number of cognitive and motivational processes and are based on individual differences (Markus & Wurf, 1987; Sedikides & Strube, 1997).
When people evaluate themselves in social settings they are often subject to cognitive biases (Sedikides & Strube, 1997). A cognitive bias can be described as an error of judgment and is often seen in competitive judgment situations (Haselton, Nettle & Andrews, 2005). Social biases, one type
of cognitive bias, can result in inaccurate judgements being made about oneself, or what is believed about others, are often motivated by a desire to be seen in the best possible light (Sedikides & Strube, 1997). This type of self-report can result in a social bias known as the above-average effect.
The above-average effect is a well-researched social comparative bias found in situations where self-evaluations are required (Brown, 2012; Dunning, Meyerowitz, & Holzberg, 1989; Kruger & Dunning,
2009, 1999). It is present in situations of either direct or indirect comparison resulting in people believing, not always accurately, that their knowledge, skill, or ability is better than that of an average person (Dunning, et al., 1989). Direct comparisons require people to explicitly compare two things or themselves with others (Moore, 2007), whereas indirect comparisons ask for the target
3
focus (focalism or egocentrism) and in situations where the subject area being evaluated is something considered to be easy or has been loosely defined (Krizan & Suls, 2008; Moore, 2007).
Several cognitive and motivational processes are thought to influence occurrences of this bias, including a lack of information about the domain that is the context of an evaluation (Kruger & Dunning, 1999, 2009; Moore, 2007). In an indirect comparison situation, a lack of information about, or expertise in a subject, can mean that a person does not have enough information on which to base accurate estimations of their ability or knowledge (Kruger & Dunning, 1999, 2009; Moore,
2007). Occurrences of overly optimistic self-evaluations in situations where the person making an evaluation has little information about the domain, and is unaware of their lack of knowledge in the domain, are examples of what has become known as the Dunning-Kruger effect (Kruger & Dunning, 1999, 2009). In addition to, and alongside the cognitive and motivational explanations for the above-average effect, are the individual differences of personality and expertise.
“Personality” refers to the differences in characteristics and behaviours that make people different from each other (Markus & Wurf, 1987). After many years of debate over the composition of personality, including the number and types of traits involved, consensus was reached in the 1980’s
with the adoption, by many, of the Five-Factor Model of personality (Barrick & Mount, 1991; McCrae
& John, 1992). The five-factor model proposes five main traits of personality, each with positive and negative sub traits (Barrick & Mount, 1991; McCrae & John, 1992). The traits which make up the five-factor model - openness, conscientiousness, extraversion, agreeableness and neuroticism - each have some influence over how people act in, and react to, different situations (Markus & Wurf, 1987).
People who have high scores in conscientiousness are driven toward self-improvement and studies show that this trait relates positively to job performance (George & Zhou, 2001). Openness to experiences means that people will embrace new situations and probably excel in situations where creativity is welcomed (George & Zhou, 2001). The trait of agreeableness, also known as friendliness or likeability, has been found to be associated with being good-natured, courteous, trusting and
tolerant people (Barrick & Mount, 1991). Overconfidence has been found to be present in people with high scores for extraversion and not for those with low scores on this trait, whereas those with high scores in neuroticism may suffer more negatively in life than others (Barrick & Mount, 1991; George & Zhou, 2001). Personality tests are often routinely completed by job seekers as part of the
4
account in employment situations. Similarly, a person’s expertise or experience in a given domain is also thought to influence a self-report (Kruger & Dunning, 2009, 1999).
Expertise is defined as having superior skills and knowledge in a particular subject or domain (Herling & Provo, 2000). There has been a great of work done on understanding manifestations of expertise and expert knowledge with several different viewpoints proposed (Anderson, 2013; Chi, Glaser & Reese, 1981, Herling & Provo, 2000). A person, known to be an expert in their domain, will have more knowledge and greater problem solving ability than those with less expertise, even those
considered competent in that domain (Herling & Provo, 2000). Experts not only know their domain well, but they can also recognise and solve problems that those with less expertise either miss, or do not have the skill to solve (Herling & Provo, 2000). People considered to have expertise in a domain are thought to be able to make more accurate self-assessments than those with less knowledge (Kruger & Dunning, 1999, 2009). In the context of the above-average effect it is fair to say that
expertise is operationalised as experience in a domain ( Kruger & Dunning, 1999, 2009; Larrick, Burson & Soll, 2007). It has been found that those with little knowledge or experience in a domain and are unaware of their lack of knowledge will not recognise the knowledge that others have (Kruger & Dunning, 1999, 2009).
Social comparisons, specifically situations which require some type of self-report, have been found in a wide range of situations and social settings from driving (Sundstrom, 2008) to academic achievement (Larrick et al., 2007). Inaccurate self-assessments are thought to be more likely in domains that are either poorly defined, or in situations which are considered commonplace and, perceived as easy (Dunning, et al., 1989). Self-evaluations of driving ability, an area in which this bias
is routinely found (Sundstrom, 2008), indicate that this ability is considered easy as driving is something that many people do routinely. Similarly, end-user computing is increasingly commonplace and may be seen, at least by some, as therefore being easy.
1.1.2 Workplace end-user computing
Computers and computer technology have become ubiquitous (Hotzman & Kraft, 2010). People have access to technology at home, in educational settings and in the workplace (Hotzman & Kraft, 2010). Most types of employment now have some type of computing requirement included in them
(Hotzman & Kraft, 2010). However, a mismatch can occur when the end-user computing skill level of
5
skill level without formally assessing it (Gibbs & McKinnon, 2009; Gibbs, Steel & Kuiper, 2010). This can and does occur, because, as computers and associated technology have become more common,
there is an expectation that most people have experience using them (Gibbs et al., 2010). This expectation has included the use of software commonly found in the workplace and has meant that computer skills have made their way into the list of soft skills required for many different jobs in many different workplaces (Hotzman & Kraft, 2010).
Businesses invest large sums of money in information technology and information systems and many
employees require end user computing skills to carry out their daily work (Yoon, 2009). However, there is confusion as to how to rate and assess the end-user computer skills required of those working in a business situation (Yoon, 2009). Gibbs and McKinnon (2009) found that employers, while realizing the need for well-developed computing skills, often did not know how to articulate their computing requirements or how to test for the required skills.
A report commissioned by the New Zealand Computer Society (now IITP) stated that New Zealand businesses could potentially increase productivity by $1.7 billion by increasing the computer literacy of the workforce in general (Bunker, 2010). This report noted that, while computers and associated technology were part of most businesses, those running organisations were often unaware of how
to promote efficient use of technology in the workplace. Partly, this problem could be attributed to the commonly held belief that all people, especially those newly entering the workforce, are competent end-users (Murray et al., 2007). Frequently employers assumed that new employees, especially young people, would have the computing skills required (Gibbs et al., 2010; Murray et al., 2007). This is further exacerbated by job seekers self-assessing their own computer ability at a
greater level than warranted (Gravill, Compeau & Marcolin, 2001, 2006). Inaccurate
self-assessments are not helped by the use of ambiguous labels such as advanced skill or average skill. What is average to one person will be some-one else’s advanced (Gravill et al., 2006). This ambiguity is partly due to the lack of a mechanism by which people can benchmark their own skill level
(Bunker, 2010). Other issues include ever-changing technology. Some people find it difficult to keep
up-to date or to maintain their level of knowledge and skill when software and hardware changes frequently (Gravill et al., 2006).
1.2
Thesis statement and aims
The aims of this research are to determine if the above-average effect is (a) evident in people’s
6
of the average computer end-user and, (c) if this effect is moderated by factors such as dominant personality traits or expertise in the domain.
By addressing these aims this research potentially adds to theoretical knowledge of occurrences of social biases such as the above-average effect. It should also help to inform and aid both employers and employees to support and enhance the increasingly fundamental area of computing skills necessary to succeed in a workplace.
Further, with its focus on inaccurate self-reporting in workplace computing, this research highlights
an issue for many organisations that has been under-researched. In the early days of personal computing much was written about the need for digital or computer literacy; more recently, however, that emphasis has decreased (Leahy & Dolan ,2010; Murray & Perez, 2014). This may be due to the prevalence of computer technology and a general perception that most people have sufficient digital skills to survive in the world and, specifically, the workplace (Gibbs et al., 2010;
Murray & Perez, 2014).
The specific research question that informs the focus of this study is:
What individual differences, if any, are critical in instances of the above-average effect in the context of end-user computing?
This question was chosen for three reasons: (a) to confirm the occurrences of the AAE in the context of end-user computing. (b) To determine if this effect, in this context, is moderated by the influences of a combination of individual factors. (c) To understand more about the domain of end-user
computing, and differences between this domain and other domains in which this effect is routinely found. The answer to this question will help in understanding more about occurrences of the AAE,
the type of contexts in which is evident and if it is influenced by a combination of individual factors, which have previously been found to individually influence this effect in other contexts.
To address this question two sets of hypotheses are proposed. The first set (H1 to H4) is intended to test occurrences and explanations for the above-average effect. A focus of this group of hypotheses is the identification of the affect that individual difference have on occurrences of the above average
7
All hypotheses were developed to be non-directional. That is, the positive or negative nature of associations between the independent and dependent variables was deliberately not specified in the
hypotheses. Previous studies have found that individual differences effect the AAE both positively and negatively. For example, Schaefer, William, Goodie & Campbell (2004) found conscientiousness was negatively associated with over-confidence; they also identified a positive relationship between over-confidence and extraversion. Likewise, Dunning & Kruger say that experience in a domain is more likely to produce a negative relationship with the AAE than lack of domain experience will.
H1 A person who uses end-user software as part of their employment will believe their
computing skills to be better than the average computer end-user.
H2 A combination of age, sex, experience, extraversion and conscientiousness is
associated1 with a person’s self-rating of their own EUC ability in comparison with their
ratings of the average computer end-user.
H3 Self-perceived computing knowledge will be greater than demonstrated computing
ability.
H4 A combination of age, sex, experience, extraversion and conscientiousness are
associated with estimations of the computing ability of the average computer end-user.
The following four hypotheses, directly associated with the Dunning-Kruger Effect are:
H5 A person’s self-assessment of end-user computing skill will be associated with their
awareness of the breadth of the domain of EUC.
H6 The difference between people’s self-reported EUC knowledge and their estimation of
the knowledge of an average computer-end-user is associated with awareness of the
breadth of EUC
1 Associated, in statistical terms, refers to any relationship between measured quantities that renders them
8
H7 Perceptions regarding the estimated breadth of the EUC domain are associated with a
person’s demonstrated computing ability.
H8 Perceptions regarding the estimated breadth of the EUC domain are associated with a
person’s computing ability combined with demographic and expertise factors and levels of
extraversion and conscientiousness.
1.3
Research description
As outlined in the previous section, the main aim of this research is to determine if social biases,
such as the above-average effect, are evident in the context of end-user computing and if this effect is moderated by individual factors such as sex, age, dominant personality traits or expertise in a domain. Although there is an extensive body of literature examining the notion of expertise and manifestations of expertise (Anderson, 2013; Chi et al., 1981; Herling & Provo, 2000), for the
purposes of this study, and in keeping with work on the Dunning-Kruger Effect (Brown, 2012; Kruger & Dunning, 1999; 2009; Larrick et al., 2007), ‘expertise’ is used in relation to indications or measures of the awareness a person has of a particular skill or knowledge domain.
This study takes several approaches to data gathering: collection of demographic and expertise data using a simple questionnaire, self-perception measurement; personality inventory; and a practical
skills assessment exercise.
Included in this study are three measures of perception. These measures include a measure of the estimation of the extent to which end-user computing contributes to the field of knowledge about all areas of computing, for this study labelled as Extent of Domain (EoDEUC). The remaining two are a measure of self-assessment of end-user computing knowledge and a measure of the estimation of
the end-user computing knowledge of the ‘average computer end-user’ (AEU).
The third approach is to measure the personality traits for each participant. The BFI (Big Five
Inventory) personality inventory was used to collect personality data for this study (see Chapter 2 for a more detailed discussion of personality traits, their measurement and selection for this study). This
9
The final approach to collecting data was the skill assessment exercise. This was undertaken using two automated instruments to test spreadsheet and word-processing skill. The tasks assessed using
these instruments were tailored for the purpose after extensive pilot testing which included input from panels of subject matter experts (see Appendix 4).
Data from each of these sources were brought together with the aim of highlighting factors that will
affect a person’s perception of their computing skill and that of others. Each of these instruments
will be described in detail in Chapter 3, the methods chapter.
1.4
Thesis Outline
This thesis is organised into six chapters, including this introductory chapter, plus a number of appendices. Each of the remaining chapters and the appendices are described in detail in the sections that follow.
1.4.1 Chapter 2 –Literature review
This chapter is a comprehensive review of literature presented in two main sections relevant to this study. Section one reviews literature from social science and, specifically, social psychology focussed on biases in self-evaluations and the motivations and cognitive processes that affect or moderate
these. Included is a review of the social comparative judgment bias known as the above-average effect. This well-researched effect, identified in many common domains, is often explained by a number of motivational or cognitive processes and has been found to be affected by individual differences such as expertise and personality, and has been found in many different social settings.
This section of the literature review also reviews literature from the domains of expertise and personality. These areas are included in this study as individual differences that combine in each individual.
Section two of this review focusses on the social setting of workplace end-user computing in which the above average effect may be present in a domain that is becoming increasingly common and
10
1.4.2 Chapter 3 – Research methods
This chapter presents comprehensive outlines of the methods used for data collection including the extensive process of instrument development and participant recruitment. Also included is an outline of the analytic methods used in testing each of the eight proposed hypotheses.
In this study, four separate approaches are taken to collecting data.
The first type of data collected were demographic data. All of the variables were used to test the
effect of a ‘combination’ of individual differences on the AAE.
Information for this study included:
age
sex
occupation
average weekly time spent using a computer
number of software applications used as part of a job approaches taken to learn/expand computing knowledge
The second approach was the creation of three measures of perception: the measure of self-assessment of EUC knowledge; the estimation of the extent of the domain of EUC (EoDEUC); and the estimated knowledge of the average computer end-user (AEU). Each of these measures uses an adapted visual analogue scale. A visual analogue scale is presented as a line with marked end-points on to which a participant places a mark to indicate their estimation of skill or knowledge. For this
study, the scales have been modified to incorporate the analogy of a 1000 page book, with
participants making estimations based on a number of pages in the book. This process is described in full in Section 3.5.
The third approach to the data was the use of a widely used measure of the FFM for personality. As
previously noted, the Big Five Inventory (BFI) was used. This is a 44-item personality inventory, which is a short version of the 240-item Neo-PI-R. This inventory was chosen, as it is a widely used instrument with proven levels of internal validity. Because personality is only one factor for this study and time for participants is important, it was considered that this shorter version would give
11
The final data collection method was that of demonstrated computing ability. This was assessed using two end-user computing instruments created with common workplace spreadsheet and
word-processing tasks. The development and validation of the skill assessment instruments is described in detail in Section 3.8.
Chapter 3 concludes with a description of the statistical methods used to analyse the data.
1.4.3 Chapter 4 – Results and data analysis
This chapter, organised into five sections, presents the results from each of the data collection methods outlined in the previous chapter. Results and statistical tests for each are presented and described in this chapter, with full discussion of the implications of these presented in Chapter 5.
Chapter 4 begins with an introduction of the statistical methods used to analyse the data and then
provides an overview of how the results are presented. Section 2 reports participant characteristics. This includes demographic features, workplace expertise measures, and personality trait results for extraversion and conscientiousness. In section 3 of this chapter, the results from the skill
assessments are outlined in detail. In the fourth section, the above-average effect and the Dunning-Kruger effect are explored in relation to the demographic, expertise and personality variables as
related to the hypotheses. In this section, results from the multiple regression analysis investigating predictors for above-average effects evident in self-assessments are presented. Results from each approach to the data are displayed individually in table and chart format with the final section of this chapter providing a summary of all results.
1.4.4 Chapter 5 – Discussion
The findings from this study presented in the previous chapter (Chapter 4) are discussed in detail with key findings expanded.
Chapter 5 is organised into five sections. Section 1 introduces the discussion. Section 2 discusses the
12
1.4.5 Chapter 6 - Conclusion, Implications, Recommendations and Future research
The thesis concludes with a summary of the contributions of this study, outlines theoretical and methodological implications of this study, makes recommendations for employers and computer users and includes suggestions for future research.
1.4.6 Appendices
Supplementary material has been included in six appendices.
Appendix 1 includes participant recruitment information including the invitation to
participate, the study consent form and the study information sheet.
Appendix 2 contains the combined demographic, personality and self-perception measure
instruments in full.
Appendix 3 has results, in raw data form, from the skill assessments.
Appendix 4 contains the design and implementation approach used in the formation of the
skill assessment instruments. This includes a summary of the pilot studies used to test effectiveness of the instrument.
Appendix 5 contains the design and implementation approach taken to create the measures
of self-perception. Also included in this appendix are results and discussions from each of the three pilot studies undertake in the development of these instruments.
Appendix 6 contains all bootstrap information for the significant regression analysis.
13
Chapter 2
Literature Review
If I don't know I don't know
I think I know
If I don't know I know
I think I don't know
RD Laing (1927 – 1989)
Social scientists have long had an interest in the perceptions that people hold about themselves and how those perceptions influence their views of others and the world around them. Considerable
research has been undertaken in the area of self-perceptions and the biases that influence these.
Biases, which affect self-perceptions have been found in different social situations and may
influence how a person performs, or is perceived, by others. It is believed that such perceptions and subsequent errors in judgments are influenced by individual differences including personality and a
person’s expertise in the domain or area for which a self-assessment is being made.
This chapter is presented in three sections. Section 1 presents a review of literature from social psychology on self-perception, personality and expertise. This section of the chapter is presented in four main parts that consist of a general discussion of the self-concept and how we as individuals evaluate ourselves, the motivations that influence self-evaluation, the social comparative biases of
the above-average effect, which has been found to influence self-evaluations and, finally, the individual differences brought about by personality and expertise. Section 2 of this chapter explores the practical domain of work-place end-user computing where perceptions and biases may affect workplace productivity and self-awareness of skills that are considered necessary in the current
14
2.1
Section one - Perceptions of self-ability from a social
perspective
For any study involving people and the perceptions they have, it is necessary to have some
understanding of how people process information about themselves and others in different social settings (Hogg & Vaughan, 2008). In social psychology, the dominant approach to understanding social behaviour is social cognition, which comprises the various ways people process, use and store information about themselves and others in social situations (Hogg & Vaughan, 2008). Part of the work on social cognition focuses on cognitions people have about themselves. These include beliefs
that constitute the ‘self-concept’, a concept that forms in the social context (Hogg & Vaughan, 2008; Markus & Wurf, 1987).
2.1.1
Self-Concept
The self-concept is a dynamic collection of beliefs one has about oneself and includes perceptions about abilities, expectations, personality traits and motivations (Hogg & Vaughan, 2008; Markus &
Wurf, 1987). Although the concept of self is used to explain an individual’s behaviour, other factors
that work together, can influence how a person may act in different situations (Markus & Wurf, 1987). While behaviour is not solely controlled by how the self is represented, representations of how people feel about themselves or what they think they know about themselves are strong self-regulators in many different behaviours (Markus & Wurf, 1987).
Greenwald (1980) explains the concept of self as being the organisation of knowledge that is characterised by three cognitive biases: egocentricity, beneffecttance and cognitive conservatism. Egocentricity essentially explains how we, as individuals, organise our memories by how we remember our involvement in things or where we were at the time an event occurred. In other
words, we organise our sense of self from our own point of view rather than in an objective manner. Beneffectance, a term coined by Greenwald (1980), is a combination of beneficence (achieving desirable outcomes) and effectance (motivation to act) that describes how individuals selectively accept responsibility for good outcomes but not for bad ones. For example, students who do well in
an exam are willing to take credit whereas those who do poorly are more likely to place blame on the exam being a poor measure of their knowledge (Greenwald, 1980). The third facet is that of cognitive conservatism that Greenwald (1980) describes as a resistance to cognitive change. What Greenwald (1980) is saying is that people accept what fits their current beliefs even to the extent of trying to justify things that make no sense, whereas they are inclined to ignore those things that do
15
The self-regulatory process of the self-concept affects how a person thinks, feels and acts in different situations (Markus & Wurf, 1987). This process includes self-monitoring of behaviour
followed by judgments of how the person executes a particular behaviour against a set of defined criteria (Markus & Wurf, 1987). Markus & Wurf (1987) argue that the growth of the self-concept is driven by information one gains about oneself through self-perception, reflection and social comparison and by one’s ability to process this information. A well-developed self-concept is influenced by self-knowledge (Hogg & Vaughan, 2008; Sedikides & Strube, 1997). As the self-concept
grows so does the need for self-knowledge, which is influenced by self-evaluation through our comparisons with others based on what we believe we know about ourselves (Hogg & Vaughan, 2008; Sedikides & Strube, 1997).
2.1.2
Self-Evaluation
Self-evaluation, “the process by which the self-concept is socially negotiated and modified” (Sedikides & Strube, 1997, p. 209) is considered to have four motivations: assessment; self-verification; self-improvement and self-enhancement. Each of these motivations is concerned with a
person’s desire to enhance, improve, verify or assess information about himself or herself (Hogg &
Vaughan, 2008; Markus & Wurf, 1987; Scholer, Ozaki & Higgins, 2014; Sedikides & Strube, 1997).
Self-assessment motivation is concerned with people’s need for favourable information about themselves (Hogg & Vaughan, 2008; Markus & Wurf, 1987; Sedikides & Strube, 1997). This
motivation drives people to seek indicative information about themselves, positive or negative, that can be used to increase the certainty of self-assessment (Hogg & Vaughan, 2008; Sedikides & Strube, 1997).
The motivation of self-verification proposes that people use social interactions as a method of confirming their self-conceptions by seeking subjectively accurate feedback (Hogg & Vaughan, 2008; Sedikides & Strube, 1997; Swann & Reid, 1980). Self-verification is an interesting process, in that those seeking to enhance positive self-conceptions seek positive feedback, while those with existing
16
Self-enhancement motivation is driven by people’s desire to learn and confirm positive information about themselves (Alicke, 1985; Greenwald, 1980; Hogg & Vaughan, 2008; Sedikides & Strube,
1997). As a means of increasing self-esteem, people like to find new positive aspects of themselves, confirming what they already believe, while reducing the negativity of the self (Hogg & Vaughan, 2008; Sedikides & Strube, 1997; Swann et al., 1989). People seek to affirm the positive traits of who they are. This affirmation may be done publicly and could be interpreted as boasting or arrogance, or might be a more subtle process of rationalising a situation (Hogg & Vaughan, 2008; Sedikides &
Strube, 1997; Swann et al., 1989). Aside from the processes explained here, other possible explanations said to account for self-enhancement include simple wishful thinking (Williams & Gilovich, 2008) or egotistic resolution to ambiguous situations (Dunning et al, 1989). It is possible that any of the processes noted here could account for the self-enhancement motivation (Williams & Gilovich, 2008).
The fourth motivation for self-evaluation is self-improvement. People are motivated to improve their skills, abilities, knowledge, well-being and traits. Somewhat different to the previous three motivations, self-improvement does not necessarily include self-concept positivity (Sedikides & Strube, 1997). Instead of focusing on the differences between old and new information about the
self, this motivation is concerned with self-concept change, and is not necessarily concerned with the accuracy of self-knowledge but rather the betterment of the self-concept (Sedikides & Strube, 1997).
Of these motivations, Sedikides & Strube (1997) found that self-enhancement was the strongest motivator of self-evaluation. The motivation of self-enhancement stems from a general perception
that people are self-encouraging and protective of their concept of self. Studies have found that memory can be self-enhancing, with people remembering situations in a way that their involvement is shown in the best possible light (Greenwald, 1980; Sedikides & Strube, 1997).
People, generally, have the need for accurate information about themselves but this need may, at times, be offset by the equally demanding need to maintain a positive self-concept (Alicke, 1985;
17
2.1.3
Cognitive Biases
A cognitive bias is a general term used to describe a number of processes that can influence the
inclination of a person to make decisions based on cognitive factors rather than fact (Haselton et al., 2005; Hogg & Vaughan, 2008). A person may hold beliefs where logical or evidential support is
insufficient (Haselton et al., 2005). Biases can affect a person’s decision-making process, which in
turn will lead to errors of judgment (Haselton et al., 2005; Hogg & Vaughan, 2008).
Haselton et al. (2005) identified three types of cognitive bias: heuristics (stereotypes); artefact biases
(resulting from placing a person in an unnatural setting) and error management bias (positive illusions). Error management biases include biases in self-judgment that often lead to illusions of superiority (Haselton et al., 2005). Many of the decisions and judgments people make occur in social settings such as workplaces, at home or while at leisure. In these settings, the cognitive biases
evident are known as social biases (Haselton et al., 2005).
2.1.3.1 Social biases (in self-evaluation)
A social bias is a cognitive bias that refers to errors made when people evaluate or try to find reasons for their own and others' behaviours (Haselton et al., 2005). Included in the bias type identified by Haselton et al. (2005) as error management are biases in judgment. Often a self-judgment bias is evidenced through positive illusions where people hold unrealistically optimistic
views of their own qualities, skill or knowledge relative to others in similar positions (Alicke, 1985; Haselton et al., 2005).
Biases occur in situations of social comparison, when a person is trying to understand their own feelings or abilities by making comparisons with others (Larrick et al., 2007; Moore, 2007). Two types
of social desirability were distinguished by Paulhus (1986), impression management, and honest reporting based on a genuine belief. Impression management occurs, according to Paulhus (1986), when people make a deliberate attempt to present themselves in the best possible light, and may be in response to particular social situations such as job interviews (Paulhus & Reid, 1991; Pedregon,
Farley, Davis, Wood & Clark, 2012).
18
In some cases where the effect occurs it is not clear it is indeed a bias or that the people involved are accurate in their estimations. For example, studies have shown that people believe positive events
will occur for them more than for others, but that negative events will occur more often for others than themselves (Moore, 2007). However, other studies have shown a bias where the effect has occurred in situations where measures taken show that a person’s estimations of themselves are
inaccurate. For example, Mattern Burrus & Shaw (2011) found that incoming college students who made the largest overestimation how they would perform in their entrance test in comparison to
others sitting the same test were those whose performance was the poorest.
Williams and Gilovich (2008) said there were two possible accounts for occurrences of the above-average effect. Either participants truly believed they were above above-average or they were motivated by self-enhancement. It is important to understand this effect further as it has implications for
people’s judgments of their own abilities concerning socially significant behaviours in different social
situations (Dunning et al., 1989; Larrick et al., 2007).
2.1.3.2 Above Average Effect (AAE)
The above average effect, variously known as ‘illusory superiority’ or the ‘better than average effect’, is a cognitive bias resulting in people unrealistically, and positively, judging themselves and
their skills relative to others (Alicke, Govorun, Dunning & Kruger, 2005; ; Dunning et al., 1989; Larrick et al., 2007; Mattern, Burrus & Shaw, 2010; Matz & Hinsz, 2000; Moore, 2007; Moore & Healy, 2008; Sedikides & Strube, 1997). This well-researched effect has been found to have wide-ranging
application and implications for people’s judgments of their own abilities in socially significant
behaviours (Larrick et al., 2007; Dunning et al., 1989) and is often considered a product of
self-enhancement (Chambers & Windschitl, 2004). Since it was first defined more than 25 years ago this effect has been demonstrated in a range of domains including studies of driving ability (Sundstrom, 2008), academic achievement (Larrick et al., 2007), health and well-being (Dunning et al., 1989) and social predictions (Brown, 2012).
19
The above-average effect has been illustrated using direct and indirect comparisons (Krizan & Suls, 2008). A direct comparison situation is one where a person is asked to compare himself or herself
with that of a peer using a scale such as “much happier” to “much unhappier”. An indirect
comparison is one where a person makes separate ratings about themselves and their peers or an average person (Krizan & Suls, 2008). A direct comparison is said to produce stronger and more consistent occurrences of the above-average effect than an indirect comparison (Krizan & Suls, 2008). Typically, in a direct comparison situation a person will be asked to make a comparison on a
single scale. For example, a person may be asked to compare their intelligence with that of an ‘average person’ using a scale with a midpoint marked as ‘average’. If self-reports are above this midpoint then an AAE is present (Zell & Alicke, 2011). This suggests that in the case of a direct comparison AAE the average refers to a median average rather than a mean average.
The above-average effect is regarded as a bias because it is statistically unlikely, although not
impossible, that the majority of people would be above average in a given population (Klar & Giladi, 1997; Larrick et al., 2007). Although it is unclear if lay people, in a comparison situation, would be considering an arithmetic mean or a median, studies have found that more than 50% of respondents believe they were above the 50th percentile within a particular population (Larrick et al., 2007).
Evidence shows that people are inclined to see themselves and their skills in the best possible light, especially with what they perceive as being easy or common tasks. Therefore it follows that they see their ability as better than that of others and when asked for a self-assessment people are likely to rate their ability or knowledge as being above average (Mattern et al., 2010; Matz & Hinsz, 2000). For example, Chambers and Windschitl (2004) claimed that most people have a persistent
inclination to believe that negative things such as illness or academic failure are less likely to occur to them rather than to others. They argue, further, that people, who want to be seen in the best possible light, exhibit instances of the above average effect by believing that they are better drivers than other road users, or more polite than other people. In a review of literature on subjective driving skill, Sundstrom (2008) found that in studies where people were asked to rate their skill
against that of the ‘average’ driver the results showed that the majority of people rated themselves as above average. However, in studies where people are asked to rate themselves against a ‘very good’ driver, the results showed that people were more conservative in their self-assessment.
Self-evaluations may be inaccurate not only because people want to be seen in the best possible
20
trait being assessed is ambiguous or difficult to define people are likely to rate themselves optimistically based on their interpretation of that skill or trait (Dunning et al., 1989; Sundstrom,
2008). Conversely, in domains where the skill or trait to be assessed is clearly defined, people are more likely to make a more accurate assessment of their skill or knowledge. For example, when subjects in Dunning et al’s., (1989) study were asked to rate themselves for loosely defined traits, such as ‘sophistication’ and ‘sensitivity’”, and for more defined traits such as being ‘punctual’ or ‘studious’, respondents rated themselves more highly than they rated an average peer for the more
ambiguous (less defined) traits than they did for the less ambiguous (more precisely defined) traits.
Inaccurate self-assessments also occur when people have insufficient information about the domain in which the assessment is being made (Kruger & Dunning, 1999, 2009; Mattern et al., 2010). Therefore, while it is likely that over-estimations are made by people with lower skill than they believe they have, the inverse may also be true. Those with higher skills in a domain may also
incorrectly estimate their skill or knowledge. However this group will more likely under-estimate rather than over-estimate their own skill or knowledge (Kruger & Dunning, 2009, 1999; Mattern et al., 2010). For example, in a study involving university students Mattern et al. (2010) found that only 7% of students with below average mathematics ability believed that they were below average
relative to their peers. On the other hand they found almost 70% of those in the top 10% of mathematics ability believed they were average or below. In their study, Mattern et al (2010) analysed data from two sets of data collected from the Capability Project (see Bridgeman, Pollock & Burton, 2004). In this project data was collected from undergraduate students, both on how they rated their ability in subject areas such as mathematics, chemistry, and actual test scores from these
areas. The data sets utilised by Mattern et al (2010) contained more than 150,000 records from more than 40 colleges. Their findings, they suggested, replicated those from previous research by confirming that those with the least ability are more likely to make the most inaccurate over-estimations of ability.
When originally defined it was thought that the above-average effect was solely motivated by the
self-enhancement motivation of self-evaluation (Brown, 2012; Sedikides & Strube, 1997). This motivation drives people to assess their own ability more than that of others because it makes them feel better about themselves (Brown, 2012; Sedikides & Strube, 1997). Researchers have since offered different explanations for its occurrence including cognitive mechanisms underlying the use