Crowd Density Estimation based on Improved
Harris & OPTICS Algorithm
Cheng Xu1 , Hong Bao1 * , Lulu Zhang1 , Ning He2
Beijing Key Laboratory of Information Service Engineer,Beijing Union University, Beijing, China1
Information Technology College, Beijing Union University, Beijing, China2
Abstract—In this paper, we propose a method to estimate crowd density using improved Harris and Optics Algorithms. We pre-processed the raw images at first and the corner features of the crowd were detected by the improved Harris algorithm, then the formed density point data were used to analyze the corner characters of crowd density by the optics density clustering theory. This theory is related to the distribution of the feature points where the crowd density is estimated by the machine learning algorithm.We used a standard database PETS2009 to do the experiments in this paper and the self-shooting datasets to illustrate the effectiveness of our method. The proposed approach has been tested on a number of image sequences. The results show that our approach is superior to other methods including the original Harris algorithm. Our method improves the efficiency of estimation and has a significant impact on preventing the accidents on crowd area with high density.
Index Terms—density clustering, Harris algorithm, OPTICS algorithm, crowd density
I. INTRODUCTION
With the wide application of surveillance cameras, intelligent video surveillance technology leads to more and more researcher opportunities. It is an important technique to monitor the crowd in the video, and can be used in the public place for crowd management, auxiliary public service design, intelligent security monitoring and auxiliary case detection, virtual people, etc.
People are often in a state of motion and a moving populace is at risk of committing some accidents such as crowd stampede. The various physical information of crowd movement have gradually become the core issue in intelligent monitoring systems. Cameras are visible at traffic intersections, stadiums, stations and other places. Video processing technology on cameras is useful in personal monitoring and it can enhance the efficiency of management by improving the analysis technologies of crowd density. This can also permit real-time monitoring with a mass monitoring device and can analyze the
scenario of crowded intelligent video content [1]. This paper is based on the improved Harris corner detection to detect the crowd characteristics in an image plane. Firstly, we used the Optics algorithm to do the density clustering analysis; then we utilized the reach ability graph for analysis, and then used machine learning to judge the situation of the contemporary crowd density . The results were divided into high and low density crowd.
The crowd monitoring theory mainly focuses on crowd density and statistics as in [2]. Related research methods on crowd density analysis can be divided into two ways which are based on pixels and texture statistics. The pixel method involves a complex calculation. It is suitable only for low crowd densities. V. Verona and A. N. Marana extracted crowd characteristics using gray level co-occurrence matrix, wavelet packet decomposition and other analysis methods [3]. Wavelet packet decomposition provides an effective way to decipher crowd images via multi-scale analysis. Texture analysis method has been used to solve the misclassification due to overlapping in high density crowd to a certain extent
Numerous international universities and research institutes regard the video monitoring system technology as an important research field [4, 7 and 8]. In 1995, the British EPSRC organization also studied crowd density estimation and the potential dangerous situations thereof. In 1997, the Defense Advanced Research Projects Agency (DARPA) has set up a major VSAM video surveillance project. W4 monitoring system has been used in 2000, and achieved the goals of detecting and tracking people who are in their homes, car parks, banks, etc. In 2003 European successively introduced PRISMATICA and ADVISOR system. In 2005, ISCAPS was established by more than a dozen European communications companies and academic organization; it aimed at realizing automatic intelligent monitoring of crowded areas. In 2013, the large-scale separation of pedestrians and portrait retrieval intelligent recognition system have obtained a breakthrough in China. It can carry on the processing of large-scale portrait; identify the key crowd automatically, and therefore provide safety for the public [5,18,19].
Davies proposed image processing methods by statistical pixels [2]. It can estimate crowd density by background subtraction and crowd pixel calculation. This method proved to be simple and effective. Background
Manuscript received 9 2013; revised 2, 2014;
This project was supported by the Project of Construction of Innovative Teams and Teacher Career Development for Universities and Colleges under Beijing Municipality (CIT&TCD20130513), and the National Natural Science Foundation of China (Grant No. 61271370 and grant No.61271369), and the project No. 201411417SJ053
extraction and the real-time realization of crowd density estimation are the most important parts. In some larger monitoring places, the big workload scenario training is often too broad to use pixel statistical method directly for crowd density estimation. It is beyond practical significance [6].
A. Albiol, et. al. proposed a statistical method to study the changing characteristics of a dynamic angular point [9]. The method estimated the behavior of the crowd by the changing rules of dynamic angular point. The advantage of this approach is not affected by illumination changes; but if people gather for a long time,it will cause a static target angular point which will then be deleted. In addition, if there is a small crowd of people appearing a few meters around the target which likewise become individual dynamic angular points, this will cause a large effect on the dynamic angular point area and result in a miscalculation. Moreover, this method only gives the change in the regularity of crowd gathering. There are no details for the identification scheme.
D. Conte, et.al. [10] improves the method of A. Albiol, et.al.[9]. It presents a kind of machine learning method to analyze the monitoring group by considering the various characteristics of different population densities. This method was able to solve certain problems which the direct nor the indirect detection methods can completely solve. This method has good robustness; it is based on a training, hence it is not necessary to set clear prior knowledge. It can be directly used to evaluate the relationship between angular point and density in a dynamic populace. The experimental results showed that this method improved the precision and maintains the robustness of the indirect method as in [9].
D. Conte, et.al.was able to monitor the crowd in efficiently and in real-time [11]. Their system exhibited high precision and high speed in finding the target, and hence can be used for real-time monitoring applications. Its main methods are based on extracting the scale invariant corner features according to the relationship of the camera and the actual population proportion. It divides bottom-up level area to associate angular point characteristics and horizontal zoning for a moving continuity situation. It makes each region obtain the same stereo effect from the same target .The method uses a simple training program with a good real-time performance and robustness. Such program can automatically evaluate the required parameters of the system. It is suitable for people counting applications and crowd behavior analysis, and can also be used to identify the segmented regions in different levels.
There are lots of density clustering algorithms based on image feature extraction; for example, OPTICS (Ordering Pointers to Identify the Clustering Structure) algorithm is a kind of automatic interaction density clustering algorithm which overcomes the strong dependency of parameters like DBSCAN (Density-Based Spatial Clustering of Applications with Noise). OPTICS Algorithm is a relatively advanced clustering method. It starts from arbitrary data objects then expands toward denser regions as far as possible. It finally gets the
reachability-distance and expansion order of each data object. In order to express the expansion order more intuitively, each object data of the expansion will be drawn in 2D coordinates according to order, where the longitudinal axis shows the reachability- distance, and the horizontal axis representing the expansion order sequence (also called clustering sequence). With these, the reachability graph can be obtained. Each tag in the reachability graph represents a cluster. B. Rochau, et.al. [7] and others use OPTICS to observe a massive cluster. Torrecilla et.al. recognized the plankton in a remote sensing image that provided a potential toolto monitor the spatial and temporal variations of marine biodiversity [8].
In this paper, we propose an improved Harris corner detection method to detect crowd feature corners, then we used the coordinates matrix of those feature corners to do clustering analysis. Finally, we can get the information of crowd density by using a reachability graph for machine learning.
The paper is organized as follows: in Section II, we introduce the basic theories of crowd monitoring, the latest methods about crowd density determination, and then we compare the two methods presented in different papers that both use corner detection to analyze crowd density. In Section III, we introduce the improved Harris algorithm and the cluster analysis method of crowd feature corners as well as present the experimental results In Section IV, we summarize the whole work of this paper and present our conclusion.
II CROWD DENSITY ESTIMATION BASED ON DENSITY
CLUSTERING
The whole crowd density estimation flow chart based on density clustering algorithm is shown in Fig. 1. Our method utilizes the improved Harris algorithm for image feature extraction, OPTICS algorithm for density clustering, a reachability graph, and density clustering analysis method by machine learning for crowd density evaluation.
First of all, video data were obtained from the scene, then preliminary image processing was done such as increasing the contrast, reducing image noise, and getting the image gray level in each frame. The main process consists of improving Harris algorithm to calculate all the features of corners in the image and to save feature points into a matrix form. Intermediate process such as reachability graph is used by the OPTICS algorithm to generate clustering characteristic vectors by feature points analysis. In advanced processing, we used Support Vector Machines (SVM) to learn the data characteristics which is a means to train our system.. Finally, we quantified the crowd density and we divided the results into superior or high and low crowd densities. The overall framework is shown in Fig. 1.
A. Harris Algorithm and Its Improved Algorithm
distinguish the crowd stage with additional features. Harris algorithm was presented in 1988 [10]. Now the image corner detection method has two types, namely: extraction of the image edge which is in the form of chain code where the maximum curvature point at the angular point is extracted; the other utilizes the curvature distribution in a gray-scale image, from which the maximum curvature point is also obtained and assigned as the angular point [12]. Harris corner algorithm belongs to the second type. Comparing with the former type, the calculation and the difficulty of Harris algorithm is significantly reduced.
For an image, the angular point is related to the curvature characteristics of the autocorrelation function. Autocorrelation function describes the changes of local gray scale image .The autocorrelation function is given by:
2
, , ,
,
( , ) u v| x u y v u v| [ ] u v
x
E x y w I I x y M
y + +
⎡ ⎤
= − = ⎢ ⎥
⎣ ⎦
∑
(1)The matrix M for approximate Hessian matrix, is:
(1)
( , )
( , )
( , )
( , )
A x y C x y
M
C x y B x y
⎡
⎤
=
⎢
⎥
⎣
⎦
(2)where:
2
( , )
X( , )
A x y
=
I
⊗
G x y
(3)2
( , )
Y( , )
B x y
=
I
⊗
G x y
(4)( , )
XY( , )
C x y
=
I
⊗
G x y
(5)Harris algorithm R (x, y) is defined as:
2
( , ) det( )
(
( ))
R x y
=
M
− ∗
k
trace M
(6)Harris corner detection involves a simple matrix with the first derivative calculation, and it is based on the threshold to extract the local so-called‘interest points’.
2
det( )
M
=
AB C
−
(7)( ) (
)
trace M
=
A B
+
(8)The parameter k is usually between 0.04 and 0.06. When R(x, y) is more than a given threshold, it will treat that point as the angle of the image point.
Using Harris algorithm for corner detection will have some main drawbacks. First, this does not have scale invariance features. Second, this is a pixel-based algorithm for extracting angular points. Finally, its testing time is too long [13].
Harris algorithm is based on Gaussian convolution function; it uses linear differential equation to extract feature points per frame. The corner detection is based on the gradient changes in the gray image. Harris corners are often those with higher changes in gray value as well as in the gradient. The similarity concept for image pixels is described by the difference between the gray values of a center pixel to 8 neighboring pixels in a detection window as shown in Fig. 2. As shown in this figure, it is obvious that the gray value of the center pixel is less than that of its neighboring pixels.
Figure 2. Detection window showing a center pixel of different gray value as compared to its surrounding 8 pixels
scene
picture pick-up system
video data
preprocessing primary treatment
Harris
crowd feature point analysis
intermediate level processing
Optics characteristic points clustering
analysis
advanced treatment SVM
Crowd density estimation
analysis result reachability
graph analysis
If the absolute values of the difference between the center pixel I(i,j) and the neighboring values is in the range of t (where we preset t=20), we can consider that such pixel is similar to the center pixel. At the same time, the similar pixel number of I(i,j) will increase in similarity.
After the 8 neighboring pixels of the center pixel I(i,j)
are operated, we can get the similarity number m of the center pixel with the neighboring pixels using (9).
(
,
)
1
1
(
, 1
1,
0,
0
)
m
R i x j y
x
y
x
y
=
+
+
− ≤ ≤ − ≤ ≤
≠
≠
∑
且
(9)where:
(
,
)
1,
(
(
,
)
)
0,
,
i x j y
t
R i x j y
i x j y
t
Δ +
+
≤
⎧⎪
+
+
=
⎨
Δ +
+
>
⎪⎩
(10)According to the value of m, if m=8, this indicates that the 8 neighboring pixels are the similarity pixels around the center pixel; if m=0, this indicates that there is no neighboring pixels similar to the center pixel. This center pixel is then regarded as a “noise point” or an “isolated point”. If m follows the range 1≤ m ≤ 7, then this pixel can be regarded as a candidate pixel for a corner point. Finally, we use CRF to judge whether the center pixel is a corner and likewise an angular point.
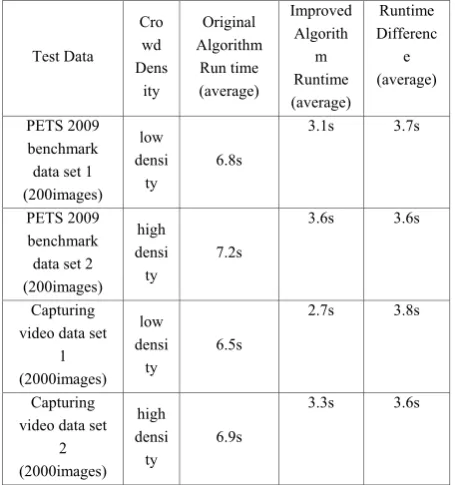
This process not only increases the number of corners and their detection accuracy, but most importantly reduces the runtime thereby improving Harris algorithm. A comparison between the runtimes of the improved and original Harris algorithm is shown inFig. 4 for a series of 100 randomly selected images from the 2009 IEEE Performance Evaluation of Tracking and Surveillance (PETS2009) pedestrian dataset. We utilized MatLab 2012a to perform the experiment.
The original and the improved Harris algorithms are adopted to detect feature points. For every image runtime, it can be seen that the original Harris algorithm takes an average of about 7s for each image, while the improved method takes only about 3s each. This shows that our method is computationally faster .
B. Feature Point Density Clustering Analysis
In this part, we treated the feature points as objects to do clustering analysis after image feature extraction. We then combined the density with the clustering analysis results, as presented in Fig. 5. The OPTICS algorithm based on density just sorts object datasets and outputs an ordered list of them in the form of clusters. As shown in Fig. 5, cluster-ordering cannot only distinguish the three groups A, B, and C but can also extract the sub-groups C1,
C2, and C3. Compared with the traditional clustering algorithms, OPTICS algorithm is insensitive to the input parameters [14].
The core distance and reachability-distance of OPTICS calculation formula is described as follows: [15]
Object p is the core distance:
( )
( )
,
core_ tan
, if N
distance to the MinPtsh point, otherwise MinPts
dis ce p
undefined p MinPts
ε
ε
=
⎧ <
⎪ ⎨ ⎪⎩
(11)
Reachability-distance:
Figure 3. The improved Harris algorithm used in a crowd image
A B
C C1
C2 C3
Figure 5. Different density clustering algorithm Figure 4. Original and improved Harris algorithms’ corresponding
( ) ( )
( ) ( )
,
, ,
reachability_ tan , , if N
max(core_ tan , tan , ), otherwise
MinPts
MinPts MinPts
dis ce p o
undefined o MinPts
dis ce o dis ce p o
ε
ε
ε ε
=
⎧ <
⎪ ⎨ ⎪⎩
(12)
The reachability – distance between objects q and p
refers to the larger Euclidean core distance If p is not the core object, then the reachability-distance between p and
q is meaningless.
To predict the population in the video through feature points in the crowd, we applied the clustering algorithm by constructing the crowd eigenvector. We then used the SVM model which was previously trained by the crowd density method presented in [16,17] to assess the current population density .
III EXPERIMENT AND ANALYSIS
We used PETS2009 pedestrian datasets and the Beijing Union University campus crowd density datasets. The PETS2009 datasets are single camera shot using a fixed down-inclined video. Some of the aims of using these datasets are to estimate the population’s density and quantity, to do target tracking in the crowd, and to perform crowd behavior analysis.
The test results are shown in Figs. 6to 9. Among them,
A1 – A4, and B1 – B4 are from the self-shooting data;
while C1 – C4, and D1 – D4 are from PETS2009 data. Figs. 6 and 8 were obtained using different methods under low density; whereas Figs. 7 and 9 were obtained under high density.
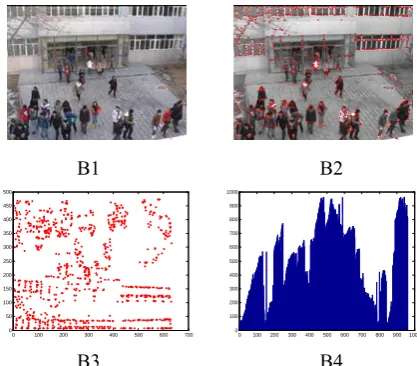
In Figs. 6 – 9, A1, B1, C1, and D1 are the test crowd images; A2, B2, C2, and D2 are the processing results of the improved Harris algorithm;A3, B3, C3, and D3 are the processing results of angular point coordinate vector analysis; and A4, B4, C4, and D4 are the processing results of OPTICS clustering showing the reachability graphs. .
C1 C2
0 100 200 300 400 500 600 700 800 0
50 100 150 200 250 300 350 400 450
0 50 100 150 200 250 300 350 0
50 100 150 200 250 300 350
C3 C4
Figure 8. PETS2009 datum with low crowd density (C1) and the analysis results from the improved Harris algorithm (C2), angular point
coordinate vector (C3), and OPTICS clustering (C4)
B1 B2
0 100 200 300 400 500 600 700 0
50 100 150 200 250 300 350 400 450 500
0 100 200 300 400 500 600 700 800 900 1000 0
100 200 300 400 500 600 700 800 900 1000
B3 B4
Figure 7. Self-shooting datum with high crowd density (B1) and the analysis results from the improved Harris algorithm (B2), angular point
coordinate vector (B3), and OPTICS clustering (B4)
A1 A2
0 100 200 300 400 500 600 700 0
50 100 150 200 250 300 350 400 450 500
50 100 150 200250 300350400450 500 550 0
100 200 300 400 500 600
A3 A4
Figure 6. Self-shooting datum with low crowd density (A1) and the analysis results from the improved Harris algorithm (A2), angular point
It can be seen from the reachability graphs of Figs. 6 - 9 that high density crowd clustering has obvious feature points whose number exceeds that of the low crowd density.
The four data groups: A, B, C, and D were taken in an ideal environment. Here the camera parameters are fixed, and they are almost without obstructions. But if the camera is far from the crowd, it will be subject to several obstructions or interferences such as buildings, trees, etc.. The effect of these are shown in Figs. 10 and 11. It is almost impossible to infer the people’s density condition in the angular point coordinate vectors of E3 and F3; but after using OPTICS particularly in E4, the reachability graph in F4 revealed the gathering of a large crowd.
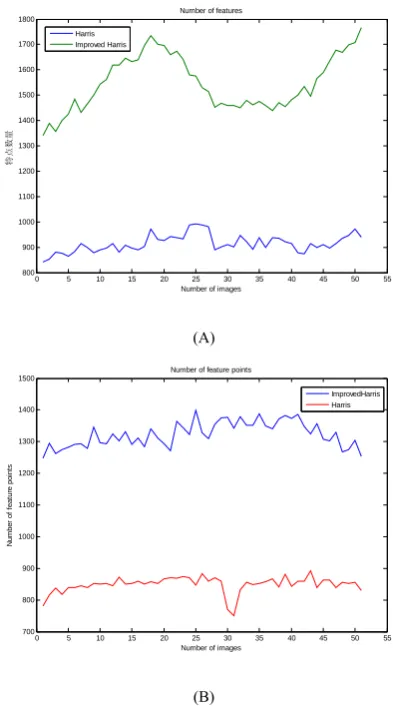
We selected 50 pictures of low and high crowd densities from the PTES2009 standard datasets to do the experiments. We found that the characteristics of the improved Harris corner algorithm is significantly better than the original algorithm as shown in Fig. 12, where low crowd density is seen on the left and the high density D1 D2
0 100 200 300 400 500 600 700 800 0
50 100 150 200 250 300 350 400 450
0 100 200 300 400 500 600 700 0
100 200 300 400 500 600 700
D3 D4
Figure 9. PETS2009 datum with high crowd density (D1) and the analysis results from the improved Harris algorithm (D2), angular point
coordinate vector (D3), and OPTICS clustering (D4)
0 5 10 15 20 25 30 35 40 45 50 55
800 900 1000 1100 1200 1300 1400 1500 1600 1700 1800
Number of images
特特
特特
Number of features
Harris Improved Harris
(A)
0 5 10 15 20 25 30 35 40 45 50 55
700 800 900 1000 1100 1200 1300 1400 1500
Number of images
N
um
be
r of
f
eat
ur
e po
int
s
Number of feature points
ImprovedHarris Harris
(B)
Figure 12. Different density population number of feature points more F1 F2
0 100 200 300 400 500 600 700 800 0
50 100 150 200 250 300 350 400 450 500
0 200 400 600 800 1000 1200 1400 1600 0
200 400 600 800 1000 1200 1400 1600
F3 F4
Figure 11. PETS2009 datum with high crowd density with obstacles (F1) and the analysis results from the improved Harris algorithm (F2),
angular point coordinate vector (F3), and OPTICS clustering (F4)
E1 E2
0 100 200 300 400 500 600 700 800 0
50 100 150 200 250 300 350 400 450 500
0 200 400 600 800 1000 1200 1400 0
200 400 600 800 1000 1200 1400
E3 E4
Figure 10. PETS2009 datum with low crowd density with obstacles (E1) and the analysis results from the improved Harris algorithm (E2),
on the right side. It can be shown that due to the position of the cameras, the improvement of feature point detection is larger in a low crowd density.
Harris algorithm’s speed is significantly improved at around 1.7 times faster than the original . We freely chose low and high crowd density images from PTES2009 datasets and video datasets to compare the performance of the different methods as shown in Table II.
From Table II, we can conclude that when the crowd is far away from the camera, the clustering effect is not apparent, and that the processing result of angular point method is not good. Obstacles within the camera’s periphery, as in the case of a non-ideal environment,cause severe detection errors The detection accuracy of the above method will be high if the distance is moderate.. Furthermore, a moderate situation has an environment that has no buildings nor clutter interferences. To compare the different kinds of methods mentioned in this paper, we did the experiment using the PETS2009 dataset. The results are shown in Tables I and II. The improved algorithm proved to be faster than the original algorithm as shown by the shorter runtime in table I; and it has a relatively higher feature point extraction capability as shown in Table II. . Through the experimental results of crowd density estimation in Table III , we can see that the improved algorithm is feasible.
From Table III, we can see that the overall estimation accuracy is generally higher for the improved method than the original. It can be seen that this has a higher accuracy rate for the different testing sample density, number of images and forecast number. . Based from these results we can therefore say that the proposed
method can be used to estimate the crowd density stage of the rest of the video sequence in the PETS2009 database .
The results in this section infer the following:
(1) The use of a fixed camera to get the images yields good test results. The method also works well without too many corners, obstacles and clutter interferences. However, its prediction error on benchmark datasets with obstacle situations is larger, because the image data characteristics are less and that the overall accuracy of the crowd density estimation is very ideal.
(2) The proposed method is not sensitive to the lighting condition of the environment. As long as there is no overexposure, illumination does not affect its results. (3) The position of the camera is very important. It will impact and cause some errors in the detection results.
TABLE I.
COMPARISON OF THE RUNTIMES OF THE ORIGINAL AND IMPROVED
HARRIS ALGORITHMS
Test Data Cro wd Dens ity
Original Algorithm
Run time (average)
Improved Algorith
m Runtime (average)
Runtime Differenc
e (average)
PETS 2009 benchmark data set 1 (200images)
low densi ty
6.8s
3.1s 3.7s
PETS 2009 benchmark data set 2 (200images)
high densi ty
7.2s
3.6s 3.6s
Capturing video data set
1 (2000images)
low densi ty
6.5s
2.7s 3.8s
Capturing video data set
2 (2000images)
high densi ty
6.9s
3.3s 3.6s
TABLE II.
COMPARISON OF THE EFFECTIVE FEATURE POINTS OF THE ORIGINAL
AND IMPROVED HARRIS ALGORITHMS
Test Data
Original Algorithm
Effective Feature
Points (average)
Improved Algorith m Feature
points (average)
Effective feature
point difference
(average)
PETS 2009 benchmark data sets (S1_L1 200
images)
79% 82% 3%
PETS 2009 benchmark data sets (S1_L2 200
images)
78% 83% 5%
PETS 2009 benchmark data sets (S1_L3 200
images)
76% 80% 4%
PETS 2009 benchmark data sets (S2_L1 200
images)
79% 80% 1%
PETS 2009 benchmark data sets (S2_L2 200
images)
78% 82% 4%
PETS 2009 benchmark data sets (S2_L3 200
images)
78% 80% 2%
PETS 2009 benchmark data sets (S3_MF 200
images) 80% 81% 1%
PETS 2009 benchmark data sets (S3_MF 200
images)
III CONCLUSION
With the development of modern social economy and the speeding up of urbanization, the density of people in a strategic place at a given time has increased greatly over the years. This however can lead to some untoward accidents that need to be prevented, hence there is a need to determine the crowd density and do the necessary management. We have used the medium density clustering method toextract feature points on a crowd video. We have also done data mining in a fixed background scenario for density estimation. The improved Harris algorithm predicts the crowd density by the number of the detected feature points. This further has a reduced runtime and a lower prediction error as compared to the other two methods that have been described also in this paper. This inference is based from the test results that utilize both the PETS2009 dataset and the images in the self-shooting data. The experimental results showed that the overall accuracy of our proposed method is satisfactory, and it is applicable in predicting different population densities most especially for extremely populated areas.
Further testing of our algorithm in a different environmental weather condition shall be one of the foci of our future research. We shall also aim at improving the robustness of our method and further increase its speed.
ACKNOWLEDGMENT
This research was supported by the Project of Construction of Innovative Teams and Teacher Career Development for Universities and Colleges under Beijing Municipality (CIT&TCD20130513), and the National Natural Science Foundation of China (Grant nos.. 61271370 and61271369), and the project no. 201411417SJ053. We thank PETS for sharing its source images, and the reviewers for their insightful comments. We also would like to thank associate professor Xu Guangmeis and He Ning whose guidance and help have been critical in the writing phases of this paper.
REFERENCES
[1] D. Kim, Crowd Density Estimation Using Multi-class Adaboost. Advanced Video and Signal-Based Surveillance (AVSS), 2012 IEEE Ninth International Conference. Page(s):447 - 451
[2] W. Bo, H. Bao, and S. Yang, Crowd Density Estimation Based on Texture Feature Extraction, Journal of Multimedia, 2013, 8(4): 331-337.
[3] V. Verona, and A. N. Marana, Wavelet packet analysis for crowd density estimationl Prnc. the listed International Symposia on Applied Information, Innsbmck,Austria: Aeta Press, 2001: 535—540.
[4] J. Junior, J.C.S., S.R. Musse, and C.R. Jung, Crowd Analysis Using Computer Vision Techniques, IEEE Signal Processing Magazine, 2010,27(5):66–77.
[5] G.T. Bei S.Y. Kwak,, and H.R. Byun, . Motion pattern analysis using partial trajectories for abnormal movement detection in crowded scenes, Electronics Letters, 2013, 49(3): 186-187.
[6] Y. L. Hou, and G.K.H. Pang, People counting and human detection in a challenging situation, IEEE Transactions on Systems, Man and Cybernetics, Part A: Systems & Humans, 2011, 41(1):24-33.
[7] B. Rochau, W. Brandner, and A. Stolte, A benchmark for multiconjugated adaptive optics: VLT-MAD observations of the young massive cluster Trumpler14, Monthly notices of the Royal Astronomical Society, 2011, 418(2): 949-959. [8] E.Torrecilla, D. Stramski, and R.A. Reynolds, Cluster
analysis of hyperspectral optical data for discriminating phytoplankton pigment assemblages in the open ocean, Remote Sensing of Environment, 2011, 115(10): 2578-2593.
[9] A. Albiol, M.J.Silla,and J. M. Mossi, Video Analysis using Corner Motion Statistics, Proceedings of the IEEE International Workshop on Performance Evaluation of Tracking and Surveillance, 2009: 31-38.
[10]D. Conte., P. Foggia, G. Percannella, F. Tufano, and M. Vento, A method for counting people in crowded scenes, Seventh IEEE International Conference on Advanced Video and Signal Based Surveillance (AVSS), 2010 pp. 225–232.
[11]D. Conte, P. Foggia, G. Percannella, and M. Vento, Counting moving persons in crowded scenes, Machine
TABLE III.
CROWD DENSITY ESTIMATION RESULTS
Data sources samples Testing of images Number Forecast number
Original Harris Algorithm
Feature Points Improved Harris Algorithm Feature Points Correct
identification number
Accuracy rate
Correct identification
number
Accuracy rate
Accuracy rate Difference Capturing video
data set 1
low density 10000 2500 2450 98% 2455 98.2% 0.2% high density 10000 2500 2403 96% 2451 98% 2% Capturing video
data set 1
low density 10000 2500 2427 97% 2432 97.3% 0.3% high density 10000 2500 2398 96% 2419 97% 1% PETS 2009
benchmark data set 1
low density 750 150 142 94.7% 145 96.7% 2% high density 310 90 85 94.4% 87 96.7% 2.3% PETS 2009
benchmark data set 2
low density 250 50 47 94% 48 96% 2%
Vision and Applications, July 2013, Volume 24, Issue 5, pp 1029-1042.
[12]J. Wright, A. Yang, S. Sastry S, and Y. Ma, Robust face recognition via sparse representation, IEEE Transactions on Pattern Analysis and Machine Intelligence, 2009, 31(2):210−227.
[13]K. Andrea,and T. Sziranyi, Harris function based active contour external force for image segmentation, Pattern recognition letters, 2012, 33(9): 1180-1187.
[14]B. Zhou, F. Zhang, and L. Peng, Higher - order SVD analysis for crowd density estimation,. Computer vision and image understanding, 2012, 116(9): 1014-1021. [15]X.F.Wang, and D.S. Huang, A Novel Density-Based
Clustering Framework by Using Level Set Method, IEEE Transactions on Knowledge and Data Engineering, 2009, 21(11):1515-1531.
[16]I. Ali, and M. Dailey, Multiple human tracking in high-density crowds, Image and vision computing, 2012, 30(12): 966-977.
[17] Z. Liu, and Z. Wei, Image Classification Optimization Algorithm based on SVM, Journal of Multimedia, 2013, 8(5): 496-502.
[18]J.Li, and W. Gong, Real Time Pedestrian Tracking using Thermal Infrared Imagery, Journal of Computers 5.10 (2010): 1606-1613.
[19]W. Li, Y. Lin, B. Fu, M. Sun and W. Wu, Cascade Classifier Using Combination of Histograms of Oriented Gradients for Rapid Pedestrian Detection, Journal of Software 8.1 (2013): 71-77.