Abstract
Private-sector banks have been functioning in India since the beginning of the banking system. Initially, during 1921, the private banks like bank of Bengal, bank of Bombay and bank of Madras were in service, which all together formed Imperial Bank of India. There are two categories of the private-sector banks: "old" and "new". The old private-sector banks have been operating since a long time and may be referred to those banks, which are in operation from before 1991 and all those banks that have commenced there business after 1991 are called as new private-sector banks.The present research paper is aimed to analyze and compare the physical performance of new private sector banks and offer suggestions for the improvement of Performance. For the purpose of analysis of comparative physical performance, the selected parameters are profit, total business, advances, deposits, number of branches and number of employees.The analysis ofcomparative physical performance for new private sector banksused the statistical tools likemean, standard deviation and correlation.
It indicates that the profit of Axis Bank, HDFC and ICIC Bank is more than the overall profit of private sector banks but other four banks profit is less than the overall average profit of Rs. 1717.6 crores. It clears that all parameter of Axis Bank, HDFC Bank and ICICI Bank SD is above the private sector banks average SD and remaining four banks SD is below. Hence the degree of reliability is less in case of Development Credit Bank (DCB), IndusInd Bank (IB), Kotak Mahindra Bank (KMB) and Yes Bank (YB). Hence we concludes that the ICICI, HDFC and Axis Bank physical performance is good compared with average of overall new private sector banks.Finally, we can also conclude that there is a significant difference among new private sector banks physical performance.
* Principal, KGR Institute of Technology and Management, Rampally, Keesara, Hyderabad, Ranga Reddy -501 301. E-mail : [email protected].
** Senior Lecturer, Sardar Patel College, Padmarao Nagar, Secunderabad. E-mail : [email protected].
Comparative Physical Performance of
New Private Sector Banks in India
Introduction
Private-sector banks have been functioning in India since the beginning of the banking system. Initially, during 1921, the private banks like bank of Bengal, bank of Bombay and bank of Madras were in service, which all together formed Imperial Bank of India.Then from the early 1990s, RBI's liberalization policy came in picture and with this the government gave licenses to a few private banks, which came to be known as new private-sector banks.
There are two categories of the private-sector banks: "old" and "new". The old private-sector banks have been operating since a long time and may be referred to those banks, which are in operation from before 1991 and all those banks that have commenced there business after 1991 are called as new private-sector banks.
Housing Development Finance Corporation Limited was the first private bank in India to receive license from RBI as a part of the RBI's liberalization policy of the banking sector, to set up a bank in the private-sector banks in India. The present private-sector banks equipped with all kinds of contemporary innovations, monetary tools and techniques to handle the complexities are a result of the evolutionary process over two centuries. They have a highly developed organizational structure and are professionally managed. Thus they have grown faster and stronger since past few years.The banks, which came in operation after 1991, with the introduction of economic reforms and financial sector reforms are called "new private-sector banks". Banking regulation act was then amended in 1993, which permitted the entry of new private-sector banks in the Indian banking sector. However, there were certain criteria set for the establishment of the new private-sector banks, some of those criteria being:
1. The bank should have a minimum net worth of Rs. 200 crores.
2. The promoters holding should be a minimum of 25% of the paid-up capital. 3. Within 3 years of the starting of the operations, the bank should offer shares to
publicand their net worth must increased to 300 crores.
Meaning and definition
Bank is an institution that deals in money and its substitutes and provides crucial financial services. The principal type of baking in the modern industrial world is commercial banking and central banking.
"Banking in the most general sense, is meant the business of receiving, conserving & utilizing the funds of community or of any special section of it."
Objectives of the Study
The present paper is aimed to examine the following objectives:
1. To analyze and compare the physical performance of new private sector banks. 2. To offer suggestions for the improvement of performance of new private sector banks.
Methodology
Source of Data
The study is based on secondary data. The data were collected from the official directory and data base of Centre for Monitoring Indian Economy (CMIE) and RBI Reports. The published annual reports of the new private sector banks taken from their websites, magazines and journals on finance have also been used a sources of data.
To assess the comparative physical performance ofnew private sector banks, the study used the statistical tools likemean, standard deviation, correlation and covariance.
Period of Study
The study covers a period of five years from 2008 - 2012.
Hypotheses
From the above objectives of the following hypothesis is formulated to test the financial efficiency of the select banks:
H0 - "There is no significant difference among new private sector banksphysical performance".
Scope of the Study
The research paper covers all new private sector banks i.e., Axis Bank (AB), Development Credit Bank (DCB), Housing Development Financial Corporation (HDFC), Industrial Credit Investment Corporation of India (ICICI) Bank, IndusInd Bank (IB), Kotak Mahindra Bank (KMB) and Yes Bank (YB).
Limitations of the Study
data is not uniform and not properly disclosed by the banks. Hence, this may be taken as another limitation.
Comparative Physical Performance
The present research paper is aimed to analyze and compare the physical performance of new private sector banks. For the purpose of analysis,the following are the sleeted physical parameters like profit, total business, advances, deposits, number of branches and number of employees.Itused the statistical tools likemean, standard deviation and correlation.
Correlation Analysis : To study the degree of interrelationship between the parameters selected for the study, Karl Pearson co-efficient has been calculated. It describes the extent to which one variable is linearly related to another correlation can be used to measure the degree of relationship among two variables, which is usually represented by the symbol "r" Statistical formula for correlation is as below.
Correlation is basically whether or not there is any relationship between two sets of data.
If there is any kind of relationship then a change in one variable can be associated with a change in the other. A lot of relationships are infact linear but very few are actually perfect because there are normally other factors involved. It will not tell you to what extent the two data sets are related. For this you need to use the Covariance component. A coefficient of 1 denotes a perfect positive correlation; a coefficient of -1 denotes a perfect negative correlation and a coefficient of 0 means that there is no correlation.
Profit
Table 1 : Profit after Tax Rs. In Crores
Years AB DCB HDFC ICICI IB KMB YB NPSB Avg 2008 1071 38 1590 4158 75 362 200
2009 1815 -88 2245 3758 148 247 304 2010 2514 -78 2949 4025 350 616 478 2011 3388 21 3926 5151 577 832 727 2012 4242 55 5167 6465 803 1009 977
Avg. 2606 -10.4 3175.4 4711.4 390.6 613.2 537.2 1717.63 SD 1252.84 67.4485 1410.7 1112.96 302.045 316.916 316.638 682.792
The analysis reveals that the mean of private sector banks profit is ranging from -10.4to 4711.4 crores with the overall mean is 1717.63 crores. It clearly indicates that the profit of Axis Bank, HDFC and ICIC Bank is more than the overall profit of private sector banks but other four banks profit is less than the overall average. The highest average profit is ICICI Bank but lowest is DCB average profit, it is negative.
The standard deviation of private sector banks profit is ranging from 67.45 to 1410.7crores with the overall average SD is 682.79 crores. The highest standard deviation is HDFC Bank but lowest is DCB. The table shows that Axis Bank, HDFC Bank and ICICI Bank SD is above the private sector banks average SD and remaining four banks SD is below. The degree of reliability is less in case of Development Credit Bank (DCB), IndusInd Bank (IB), Kotak Mahindra Bank (KMB) and Yes Bank (YB).
Table 2 : Inter Correlation Analysis
X1 X2 X3 X4 X5 X6 X7
X1 1
X2 0.36939 1
X3 0.99521 0.43245 1
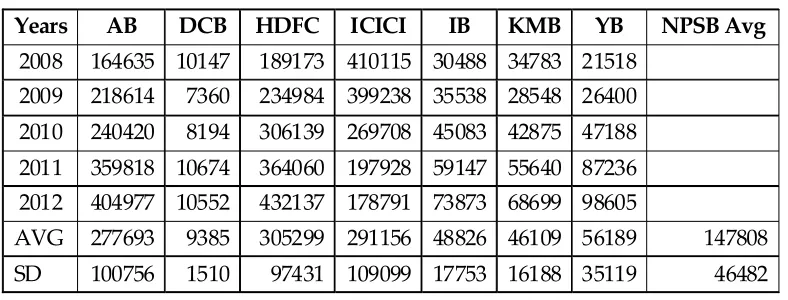
Total Business
Table: 3 Total Business in crores
Years AB DCB HDFC ICICI IB KMB YB NPSB Avg 2008 164635 10147 189173 410115 30488 34783 21518
2009 218614 7360 234984 399238 35538 28548 26400 2010 240420 8194 306139 269708 45083 42875 47188 2011 359818 10674 364060 197928 59147 55640 87236 2012 404977 10552 432137 178791 73873 68699 98605
AVG 277693 9385 305299 291156 48826 46109 56189 147808 SD 100756 1510 97431 109099 17753 16188 35119 46482
Source: Compiled from annual reports of the banks.
The analysis reveals that the mean of private sector banks average total business is ranging from 9385 to 305299 crores with the overall mean is 147808 crores. The highest average total business is HDFC Bank but lowest is DCB. It clearly indicates that the average total business of Axis Bank, HDFC and ICIC Bank is more than the overall average total business of private sector banks but other four banks average total business is less than the overall average.
The standard deviation of private sector banks total business is ranging from 1510 to 109099 crores with the overall average SD is 46482crores. The highest standard deviation is ICICI Bank but lowest is DCB. The table shows that Axis Bank, HDFC Bank and ICICI Bank SD is above the private sector banks average SD and remaining four banks SD is below. The degree of reliability is less in case of Development Credit Bank (DCB), IndusInd Bank (IB), Kotak Mahindra Bank (KMB) and Yes Bank (YB).
Table 4 : Total Business - Inter Correlation Analysis
X1 X2 X3 X4 X5 X6 X7
X1 1
X2 0.967 1
X3 0.956 0.919 1
X4 -0.891 -0.932 -0.951 1
X5 0.9763 0.921 0.993 -0.915 1
X6 0.961 0.929 0.999 -0.954 0.992 1
X7 0.986 0.985 0.973 -0.953 0.974 0.979 1
The above table reveals the correlation matrixes of total business of new private sector banks. It is learnt from the table that there is a close relation between X1 and X3, X5, X6 and X7 at 0.01 level of significance positively correlated but X1 and X4 negatively correlated. In case of X2, there is a highly positive relationship with X3, X5, X6 and X7 at 1% level and variable between X2 and X4 highly negatively correlated. The variable which is significantly correlated at 1% level is X3 with those of X5, X6 and X7 but negatively correlated X3 with X4.It observed that the variable X4 is highly negatively correlated with X5, X6 and X7at 1% level of significance. A penetrating observation of the table brings us to average and infer that X5 is having a close relationship with X6 and X7 at 1% of significance. There exists a significant and close relationship between X6 and X7.
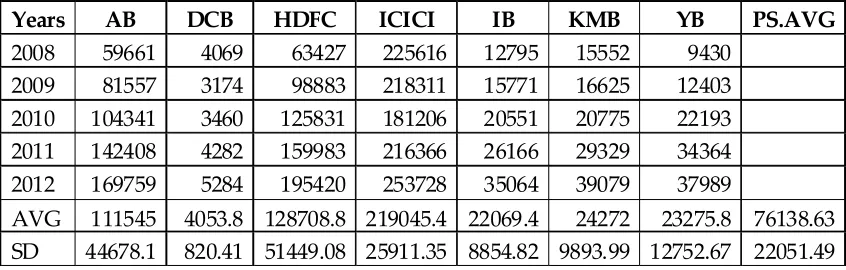
Advances
Table 5 : Advances (Crores)
Years AB DCB HDFC ICICI IB KMB YB PS.AVG
2008 59661 4069 63427 225616 12795 15552 9430 2009 81557 3174 98883 218311 15771 16625 12403 2010 104341 3460 125831 181206 20551 20775 22193 2011 142408 4282 159983 216366 26166 29329 34364 2012 169759 5284 195420 253728 35064 39079 37989
AVG 111545 4053.8 128708.8 219045.4 22069.4 24272 23275.8 76138.63 SD 44678.1 820.41 51449.08 25911.35 8854.82 9893.99 12752.67 22051.49
Source: Compiled from annual reports of the banks.
Table 6 : Advances - Inter Correlation
X1 X2 X3 X4 X5 X6 X7
X1 1
X2 0.982 1
X3 0.997 0.986 1
X4 0.664 0.774 0.663 1
X5 0.986 0.993 0.995 0.702 1 X6 0.991 0.998 0.994 0.738 0.997 1 X7 0.982 0.929 0.972 0.531 0.944 0.947 1 The above table reveals the correlation matrixes of advances of new private sector banks. It is learnt from the table that there is a close relation between X1 and X2, X3, X5, X6 and X7 at 1% level of significance. In case of X2, there is a close relationship with X3, X5, X6 and X7 at 1% level. The variable which is significantly correlated at 1% level is X3 with those of X5, X6 and X7. A penetrating observation of the table brings us to average and infer that X5 is having a close relationship with X6 and X7 at 1% of significance. There exists a significant and close relationship between X6 and X7.
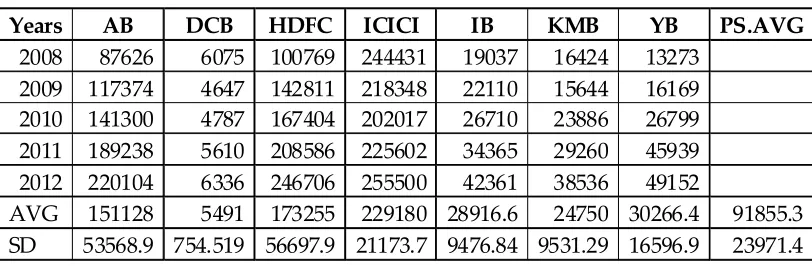
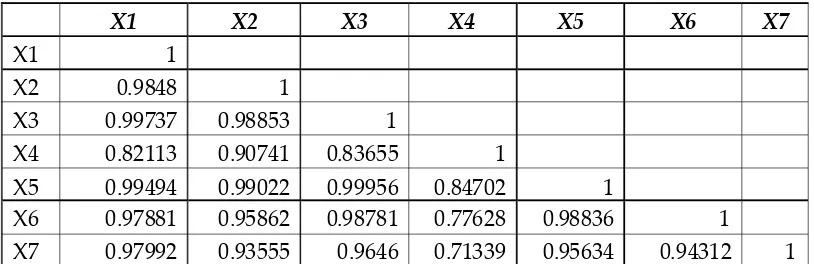
Deposits
Table 7 : Deposits in crores
Years AB DCB HDFC ICICI IB KMB YB PS.AVG
2008 87626 6075 100769 244431 19037 16424 13273 2009 117374 4647 142811 218348 22110 15644 16169 2010 141300 4787 167404 202017 26710 23886 26799 2011 189238 5610 208586 225602 34365 29260 45939 2012 220104 6336 246706 255500 42361 38536 49152
AVG 151128 5491 173255 229180 28916.6 24750 30266.4 91855.3 SD 53568.9 754.519 56697.9 21173.7 9476.84 9531.29 16596.9 23971.4
Source: Compiled from annual reports of the banks.
is HDFC Bank but lowest is DCB. The table shows that Axis Bank, HDFC Bank and ICICI Bank SD is above the private sector banks average SD and remaining four banks SD is below. The degree of reliability is less in case of Development Credit Bank (DCB), IndusInd Bank (IB), Kotak Mahindra Bank (KMB) and Yes Bank (YB).
Table 8 : Deposits - Inter Correlations
X1 X2 X3 X4 X5 X6 X7
X1 1
X2 0.9848 1
X3 0.99737 0.98853 1
X4 0.82113 0.90741 0.83655 1 X5 0.99494 0.99022 0.99956 0.84702 1 X6 0.97881 0.95862 0.98781 0.77628 0.98836 1 X7 0.97992 0.93555 0.9646 0.71339 0.95634 0.94312 1
The above table reveals the correlation matrixes of depositsof new private sector banks. It is learnt from the table that there is a close relation between X1 and X2, X3, X5, X6 and X7 at 1% level of significance. In case of X2, there is a close relationship with X3, X4, X5, X6 and X7 at 1% level. The variable which is significantly correlated at 1% level is X3 with those of X5, X6 and X7. A penetrating observation of the table brings us to average and infer that X5 is having a close relationship with X6 and X7 at 1% of significance. There exists a significant and close relationship between X6 and X7.
Number of branches
Table 9 : Number of branches
Years AB DCB HDFC ICICI IB KMB YB PS.Avg
2008 651 104 745 1271 195 182 68 2009 831 110 1422 1432 195 225 118 2010 1035 110 1725 1719 231 257 151 2011 1460 110 1986 2565 321 329 215 2012 1657 114 2544 2780 397 363 356
AVG 1126.8 109.6 1684.4 1953.4 267.8 271.2 181.6 799.257 SD 422.624 3.57771 667.617 680.036 88.7085 74.2644 111.15 292.568
The analysis reveals that the mean of private sector banks average number of branches is ranging from 110 to 1953 branches with the overall mean is 799branches. The highest average branches are ICICI Bank but lowest is DCB. It clearly indicates that the average branches of Axis Bank, HDFC and ICIC Bank is more than the overall average branchesof private sector banks but other four banks average branchesis less than the overall average.
The standard deviation of private sector banksbranches is ranging from 4 to 680branches with the overall average SD is 293branches. The highest standard deviation is ICICI Bank but lowest is DCB. The table shows that Axis Bank, HDFC Bank and ICICI Bank SD is above the private sector banks average SD and remaining four banks SD is below. The degree of reliability is less in case of Development Credit Bank (DCB), IndusInd Bank (IB), Kotak Mahindra Bank (KMB) and Yes Bank (YB).
Table 10 : Total Branches - Inter correlations
X1 X2 X3 X4 X5 X6 X7
X1 1
X2 0.72294 1
X3 0.95723 0.87498 1
X4 0.99601 0.67277 0.92863 1 X5 0.98967 0.81304 0.98186 0.97747 1 X6 0.99988 0.72911 0.95805 0.99599 0.99114 1 X7 0.93212 0.92404 0.98893 0.90323 0.97345 0.9352 1
Number of employees
Table 11 : Number of employees
Years AB DCB HDFC ICICI IB KMB YB PS.AVG
2008 14739 2235 37386 40686 2869 9058 3150 2009 20624 1942 52687 34596 4251 8227 2671 2010 21640 1591 51888 35256 5383 8804 2906 2011 26341 2174 55752 26929 7008 10400 3929 2012 31738 2053 66076 25253 9370 11207 5642
AVG 23016.4 1999 52757.8 32544 5776.2 9539.2 3659.6 18470.31 STDEV 6388.52 254.436 10288.3 6374.65 2518.2 1226.43 1204.93 4036.49
Source: Compiled from annual reports of the banks.
The analysis reveals that the mean of private sector banks average number of employees is ranging from 1999 to 52758 branches with the overall mean is 18470 employees. The highest average employees are HDFC Bank but lowest is DCB. It clearly indicates that the average employees of Axis Bank, HDFC and ICIC Bank is more than the overall average employees of private sector banks but other four banks average employeesis less than the overall average.
The standard deviation of private sector banks employees is ranging from 254 to 10288 employees with the overall average SD is 4036 employees. The highest standard deviation is HDFC Bank but lowest is DCB. The table shows that Axis Bank, HDFC Bank and ICICI Bank SD is above the private sector banks average SD and remaining four banks SD is below. The degree of reliability is less in case of Development Credit Bank (DCB), IndusInd Bank (IB), Kotak Mahindra Bank (KMB) and Yes Bank (YB).
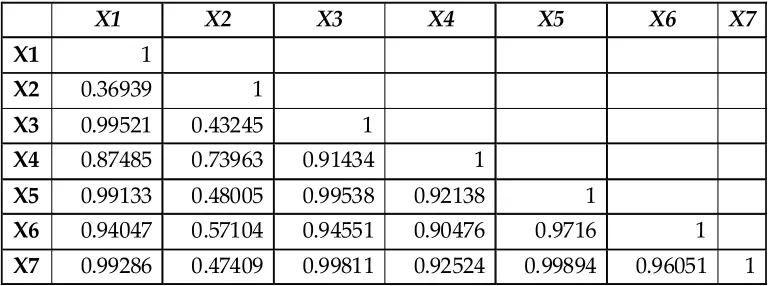
Table 12 : Employees - inter Correlation
X1 X2 X3 X4 X5 X6 X7
X1 1
X2 0.5841233 1
X3 0.9597472 0.509613889 1
X4 -0.941669 -0.793035485 -0.842865102 1
X5 0.9917741 0.49493912 0.937941331 -0.914283 1
X6 0.9753725 0.618314549 0.874237261 -0.969034 0.97698078 1
X7 0.9954062 0.53793871 0.980423589 -0.9091 0.98686514 0.950842201 1
X1 and X3, X5, X6 and X7 at 0.01 level of significance positively correlated but with X4 it is negatively correlated. In case of X2, there is a negative correlation with X4 at 1% level. The variable which is significantly correlated at 1% level is X3 with those of X5 and X7 but X4 negatively correlated.It observed that the variable X4 is highly negatively correlated with X5, X6 and X7at 1% level of significance. A penetrating observation of the table brings us to average and infer that X5 is having a close relationship with X6 and X7 at 1% of significance. There exists a significant and close relationship between X6 and X7.
Conclusions
1. The analysis reveals that the profit, total business, advance, deposits, number of branches and employees of Axis Bank, HDFC and ICIC Bank is more than the average of private sector banks but other four banks is less than the overall average and its degree of variability also less.
2. The correlation matrixes of profit of new private sector banks are positive correlationexcept Development Credit Bank (X2).
3. Finally we conclude that physical parameters among new private sector banks are significance difference. The performance of the Axis Bank, HDFC and ICIC Bank are good compared withthe new private sector banks.
Suggestions
In the light of the above conclusions the following suggestions may be made:
1. The Loss of DCB is not good hence it should be increase the total business otherwise better to merge with other banks.
2. The number of employees of the HDFC bank is more compared with other banksbut compared with ICIC bank its profit and business also low. Hence utilize the employees more profitable way.
3. The profits of IndusInd Bank, Kotak Mahindra Bank and Yes Bank are very low. Hence try to increase the business and control the expenses otherwise very difficult to survive.
References
1. Sathya and Bhattacharya et el (1997): "Impact of Privatization on the Performance of the Public Sector Banks, Journal of Management Review: pp 45-55.
2. K. Srinivas (2010): "Pre and Post Merger Physical Performance of Merged Banks- A Select Study", Indian Journal of Finance, Jan 2010.
4. Sanjay J. Bhayani (2006): "Performance of the New Indian Private Banks - A Comparative Study, Banking Review: pp 55 - 59.
5. Chidambaram R.M and Alamelu (1994): "Profitability in Banks - A matter of Survival, The Banker: pp 1-3 May.
6. Das A. (1997): "Technical, Allocative and Scale Efficiency of Public Sector Banks in India, RBI Occasional Papers, June to September.
7. Barman R. B. and Samanta G. P "Banking Services Price Index: An Exploratory Analysis for India" (www.financialindia.com).
8. Bhadury Prof. Subrato (2007) conducted study on "Commercial banking in India new challenges and opportunities after liberalization" South Asian Journal of Socio-Political Studies (Vol No-2, Jan-June 2007).
9. Board John Sutcliffe, Ziemba Charles, William T.(2003) "Applying Operations ResearchTechniques to Financial Markets" Interfaces; (Mar/Apr2003, vol. 33 issue 2), (Pg12-24).
10. Brown Craig O. and Dinc I. Serdar (2005) "The Politics of Bank Failures: Evidence from Emerging Markets" Quarterly Journal of Economics, (November 2005) (Pg-1413-1443).
11. Batra Mr. Sumant & Dass Kesar (2003) "Maximising value of Non Performing Assets" Forum for Asian Insolvency Reform (FAIR) (Seoul, Korea 10 - 11 November 2003).
12. Chhikara Dr. Sudesh (2007) " Causes and Impact of Non Performing Assets in Public Sector Banks : A state level Analysis" Amity Management Analyst ( Vol 1, No 2) (2007) ( Pg. No. 48-56).
13. Chen Ping, Yang Hailiang ,Yin George (2008) "Markowitz's meanvariance asset-liability management with regime switching: A continuous209 time model" Insurance, Mathematics & Economics. Amsterdam: (Dec 2008.Vol. 43, Issue. 3);(Pg. 456-461).
14. Chipalkatti Niranjan , Rishi Meenakshi (2007) "Do Indian banks understate their bad loans?" The Journal of Developing Areas. Nashville: (Spring 2007. Vol. 40, Issue. 2) ;( Pg. 75-91).
15. Chakrabarti Rajesh and Chawla Gaurav (2005) "Bank Efficiency in India since the Reforms: An Assessment" Money & Finance ICRA Bulletin, ( July-Dec'05) (Pg.-31-42).
16. Deolalkar G.H "The Indian Banking Sector On the road to progress" Article from (www.fedral.co.in) 15. Derviz Alexis and Podpiera Jiri "Predicting Bank CAMEL ad S&P ratings: The Caste of Czech Republic" Working Paper Series, printed and distributed by Czech National Bank ( http://www.cnb.cz.).
17. Demirgüç-Kunt Asli and Detragiache Enrica (1998 ) "The Determinants of Banking Crises: Evidence from Developed and Developing Countries" IMF staff papers( Vol.45, No.1) (March,1998).
18. Das, Abhima, Ghosh, Saibal (2006) "Financial Deregulation and Efficiency: An Empirical Analysis of Indian Banks during the Post Reform Period" Review of Financial Economics; ( Sep2006, Vol. 15 Issue 3), (Pg193-221).