Page 127 www.ijiras.com | Email: [email protected]
Design And Implementation Of A Wireless Microcontroller Based
Heart Pulse Meter With Liquid Crystal Display
Paul Inuwa Adamu
Hamza Abba
Department of Electrical and Electronic Engineering, Federal Polytechnic Damaturu, Yobe State, Nigeria
Harrison Oyibo Idakwo
Department of Engineering Services, UMTH, Maiduguri, Borno State, Nigeria
I. INTRODUCTION
This work is aimed at designing a microcontroller based device that can read the heart pulse rate through the finger. The signal thus obtained is very week and consist of noise. In order to design the pulse rate monitor, there is need to understand the basic principles behind how the pulse is generated in the heart in order to gain an idea on how to approach the task.
The heart functions as a dual pump, sending and receiving blood all the time to and from various tissues in the body through the veins [1], [2] . Whenever the heart beats or pumps blood, it releases along with it weak electrical signals which flows through the body tissues. This signals can be picked up, filtered, amplified and processed to detect the rate of heart beat. The device that does this is known as the pulse rate monitor [3], [4], [5].
It is envisaged to employ the use of a sensor designed by sparkfun known as pulse sensor for this work. This sensor employs the utilization of an LED (Light Emitting Diode) and
LDR (Light Dependent Resistor) to sense the blood pulse at the finger tips [3], [6], [7]. However, before one can clearly understand the whole process, there need to explain what is known as an ECG (electrocardiographs).
An ECG (electrocardiograpgh) is a heart monitoring technique mostly used on patients who show possible symptoms of heart disoreder [2], [8]. The ECG records electrical signals produced by each heartbeat and display it graphically.
Basically, the heart needs three types cells to beat according to [3]:
Rythms generators which produce an electrical signal {sinoatrial (SA) node or normal pacemaker}
Contractors responsible for spreading the pacemaker Contarctile cells (mycocardium) whose functions is to
mechanically pump blood.
Also the autor in [3] stated that When the heart beats, it pumps blood through two major circuits:
Abstract: This work involves the use of locally sourced materials to design and implement a device capable of reading heart pulse rate for humans. The system is microcontroller based and contains a transceiver which is used to wirelessly transmit data from one end to another. Arduino microcontroller was used to achieve this task simply because of its friendly and open sourced programming platform. Heart related conditions are rampant in the society and early detection of such conditions can significantly reduce the mortality rate from such ailments. Hence, the need to have a relatively cheap device that can detect such conditions.
The device employs the use of fingertip sensors which detects the blood pulse at the finger tips and sends it to the microcontroller for onward processing and transmission. It contains a filter and an amplifier. The wireless system was employed to remotely monitor a patient were necessary.
The system was successfully designed and implemented and it gave a satisfactory result.
Page 128 www.ijiras.com | Email: [email protected] Pulmonary circuit: which involves the flow of blood
through the lungs to oxygenate it and also remove carbon dioxide.
Systemic circuit: which involves the delivery of oxygen and nutrients to tissues.
The elctfrical signals read by an ECG are generated in the haert by the sinoatrial node (SA node) and are spread to the ventricular muscle through particular conducting paths: internodal pathways and atrial fibres, the atrioventicular node (AV node), the bundle of His, the right and left bundle branches, and Purkinjie fibres. The whole process is initated by the hearts specialised pacemaker cells which are resposible for depolarisation (contraction) and repolarisation (relaxation) [3], [9].
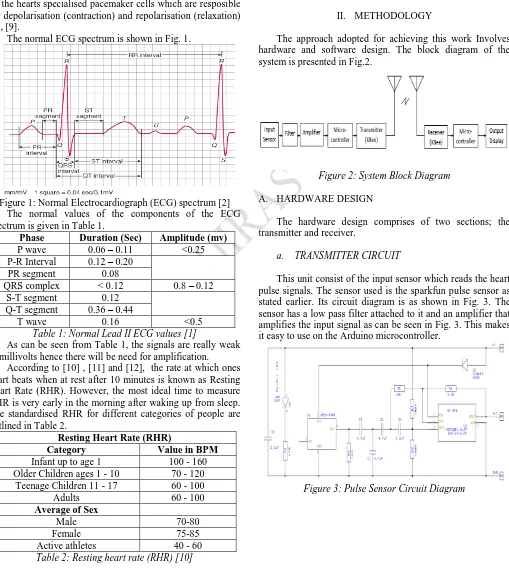
The normal ECG spectrum is shown in Fig. 1.
Figure 1: Normal Electrocardiograph (ECG) spectrum [2] The normal values of the components of the ECG spectrum is given in Table 1.
Phase Duration (Sec) Amplitude (mv)
P wave 0.06 – 0.11 <0.25
P-R Interval 0.12 – 0.20
PR segment 0.08
QRS complex < 0.12 0.8 – 0.12
S-T segment 0.12
Q-T segment 0.36 – 0.44
T wave 0.16 <0.5
Table 1: Normal Lead II ECG values [1]
As can be seen from Table 1, the signals are really weak in millivolts hence there will be need for amplification.
According to [10] , [11] and [12], the rate at which ones heart beats when at rest after 10 minutes is known as Resting Heart Rate (RHR). However, the most ideal time to measure RHR is very early in the morning after waking up from sleep. The standardised RHR for different categories of people are outlined in Table 2.
Resting Heart Rate (RHR)
Category Value in BPM
Infant up to age 1 100 - 160 Older Children ages 1 - 10 70 - 120
Teenage Children 11 - 17 60 - 100
Adults 60 - 100
Average of Sex
Male 70-80
Female 75-85
Active athletes 40 - 60
Table 2: Resting heart rate (RHR) [10]
There are several devices in the local market that reads heart pulse rate, however, this work is aimed at designing a cost effective heart pulse rate meter using locally sourced materials. The device is expected to detect the heart rate (in beats per minute, BPM), transmit it wirelessly from the detecting circuit (transmitter), receive it at the other end (receiver circuit) and display the transmitted data (heart rate in BPM) on a graphical LCD. The essence of wirelessly transmitting the data is for remote sensing which is very useful for closely monitoring the patient.
II. METHODOLOGY
The approach adopted for achieving this work Involves hardware and software design. The block diagram of the system is presented in Fig.2.
Figure 2: System Block Diagram
A. HARDWARE DESIGN
The hardware design comprises of two sections; the transmitter and receiver.
a. TRANSMITTER CIRCUIT
This unit consist of the input sensor which reads the heart pulse signals. The sensor used is the sparkfun pulse sensor as stated earlier. Its circuit diagram is as shown in Fig. 3. The sensor has a low pass filter attached to it and an amplifier that amplifies the input signal as can be seen in Fig. 3. This makes it easy to use on the Arduino microcontroller.
Page 129 www.ijiras.com | Email: [email protected]
Figure 4: Pulse sensor connection to microcontroller
The transmitting XBee is connected to the Arduino microcontroller via the XBee shield as shown in Fig. 5.
Figure 5: Microcontroller and XBee connection
The two XBees at the transmitter and the receiver ends were paired using X-CTU; a platform (software interface) used for configuring XBees to communicate wirelessly.
b. RECEIVER CIRCUIT
An additional circuit was only required for the receiver because all the essential components required for the transmitter were provided. The receiver required a power regulator circuit for the graphical LCD and toggle switches for making selections for additional functionalities while displaying the result.
The circuit was designed using „Proteus 8 Professional‟ which provided the platform for the design, simulation and printing the PCB used for the receiver. The circuit diagram and the PCB layout are presented in Fig. 6 while the 3D view and the Printed Circuit board for the receiver are presented Fig. 7.
Figure 6: Receiver Circuit diagram (Left) and PCB layout (Right)
Figure 7: Receiver 3D View (Left) and Printed Circuit Board (Right)
Three touch bottom switches were used to control the nature of the output data display. This was done to enable better understanding of the received data.
c. SOFTWARE DESIGN
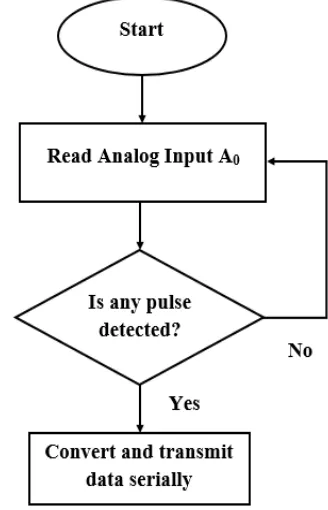
The software aspect of the work took care of both microcontrollers at the transmission and reception ends. The algorithms were written to detect the wanted signals read by the pulse sensor and convert it to a form that can be wirelessly transmitted via the XBee. Since the read data via the Arduino microcontroller analog input A0 is analog, the algorithm converts to digital and is serially transmitted. The Transmitter software flow chart is given in Fig. 8.
Figure 8: Transmitter Software Flowchart
Page 130 www.ijiras.com | Email: [email protected]
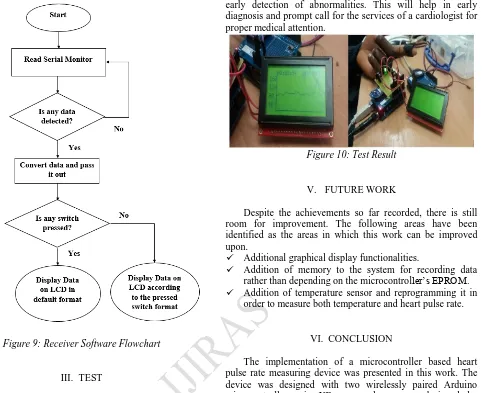
Figure 9:Receiver Software Flowchart
III. TEST
The test was carried out by fixing the pulse sensor on a male adult finger and reading the heart pulse at the transmitting end. The transceivers were reasonably spaced and the clarity of the received data at the receiving end was observed.
IV. RESULTANDDISCUSSION
The following results were obtained after testing the system.
The device read the pulse rate adequately at the transmitter side.
The two Arduino boards were successfully paired wirelessly via the XBees and were used to transmit the read pulse rate data from one end and received at the other end.
The device was able to graphically display the received data on the LCD.
The result in Fig. 10 shows the success recorded in this work. The pulse read is 75 BPM as can be seen from the result in Fig. 10 which falls in line with the expected result for a male adult as stated in Table 2.
Based on the above result, it can be inferred that the work is a success. This device can be used at homes to closely monitor the state of one‟s heart condition and thus can help in
early detection of abnormalities. This will help in early diagnosis and prompt call for the services of a cardiologist for proper medical attention.
Figure 10: Test Result
V. FUTUREWORK
Despite the achievements so far recorded, there is still room for improvement. The following areas have been identified as the areas in which this work can be improved upon.
Additional graphical display functionalities.
Addition of memory to the system for recording data rather than depending on the microcontroller‟s EPROM. Addition of temperature sensor and reprogramming it in
order to measure both temperature and heart pulse rate.
VI. CONCLUSION
The implementation of a microcontroller based heart pulse rate measuring device was presented in this work. The device was designed with two wirelessly paired Arduino microcontrollers via XBee, a pulse sensor designed by sparkfun and an LCD for graphical display of the output. The work was a success as the system was able to read the heart pulse rate in BPM which was within the expected value for a normal male adult. All the materials used were locally sourced. This device can thus be used for routine check of one‟s heart condition however caution should be employed as it does not eliminate the need for routine medical check with one‟s physician.
REFERENCES
[1] F. M. B. S. Mohammed and B. Mouldi, “Microcontroller Based Heart Rate Monitor,” The International Arab Journal of information Technology, vol. 5, no. 4, pp. 153-157, 2008.
[2] “Cardio Products-ECG Knowledge,” [Online]. Available: http://www.jsxzsj.net/lhspzz/e-cp8-add2.htm. [Accessed 14 04 2016].
[3] M. Youseffi, “Laboratory Practicals for the MSc Wireless Embedded Technology in Healthcare,” University of Bradford, Bradford, 2016.
Page 131 www.ijiras.com | Email: [email protected] Journal of Engineering Science and Computing, vol. 7,
no. 4, pp. 6662-6666, 2017.
[5] S. Nisaha and M. Ravi, “Microcontroller Based Wireless Temperature and Heat Beat Read-Out,” IOSR Journal of Engineering (IOSRJEN), vol. 3, no. 1, pp. 1-6, 2013.
[6] “Sparkfun,” [Online]. Available:
https://www.sparkfun.com/products/11574. [Accessed 14 04 2016].
[7] M. Bandana and K. P. Ajit, “Heart Rate Monitoring System Using Finger Tip Through Arduino and Processing Software,” International Journal of Science, Engineering and Technology Research (IJSETR), vol. 5, no. 1, pp. 84-89, 2016.
[8] F. S. Babiker, E. L. Abdal-Khair and M. S. Elbasheer, “Microcontroller Based Haert Rate Monitor using Fingertip Sensors,” University of Khartoum Engineering Journal (UofKEJ), vol. 1, no. 2, pp. 47-51, 2011.
[9] A. L. Mamun, N. Ahmed, M. Alqahtani, O. Altwijri, M. Rahman, N. U. Ahamed, S. A. M. M. Rahman, R. B. Ahmad and K. SundaraJ, “A Microcontroller Based Automatic Heart Rate Counting System Fro Fingertip,” Journal of Theoritical and Applied Information Technology, vol. 62, no. 3, pp. 597-604, 2014.
[10]M. E. Dogo, F. Sado and M. S. Adah, “Design of a Simple and Low-Cost Microcontroller Based Medicare Device for Heart beat Monitoring,” African Journal of Computing and IT, vol. 6, no. 5, pp. 121-128, 2013. [11]S. Dinesh and K. A. Dinesh, “Design of a Low Cost Pulse
Counter,” International Journal of Advanced Technology in Engineering and Science, vol. 2, no. 7, pp. 345-357, 2014.