© 2018 IJSRST | Volume 4 | Issue 2 | Print ISSN: 2395-6011 | Online ISSN: 2395-602X Themed Section: Science and Technology
Graph Theoretic Approach to Social Network Analysis
Krishnendu Dutta
Department of Mathematics, Govt. College of Engineering & Ceramic Technology, Kolkata, India
ABSTRACT
In the last few years, there is a rapid growth of web and various social network sites which have enabled us to easily interconnect people all over the world in a shared platform. A social network is a social structure comprising individuals or organizations which hold dynamic ties between them. Social network can be visualized in terms of connected graph where individuals are represented by vertices or nodes and connections between individuals are represented by link or edges. The tendency of people based on their preferences, choices, likes or dislikes are associated with each other in a shared platform, which forms a virtual cluster or community. In this paper we generate a graph of communication network based on real life data collected from a social network site - Twitter. Several community detection algorithms are in place and our intention is to make a comparative study of these existing algorithms over our graph and detect the communities which cannot be viewed by mere observation.
Keywords: Community Detection, Quality Function, Modularity, Transitivity Index.
I.
INTRODUCTION
Social network analysis is an emerging area of computer science where with n nodes there are
( )
possible networks. These quanta of networks attract researcher as well as industry houses to explore the inner nuances and it becomes an inter-disciplinary research of modern times in the arena of big-data. In social network, social structure made up of individuals or organizations, which are denoted by nodes and special relationship like friendship, common interest or trust etc. are denoted by edges connecting any pair of nodes that are conceptualized as connected graph for purposes of analysing network structure and influence propagation [4,5]. In addition it enables us to analyse structural properties like small-world network [2, 3], community structure [1, 6], power-law distribution [7, 8] etc. Among all other various features the most relevant one in real life network is the community detection or clustering which indicates the organization of vertices in clusters. These
types of clusters in a network can be considered as an independent compartment of a graph which can also be compared with tissues or organs of a human body. Detection of communities is of immense importance in various branches of science and technology, social sciences, behavioural sciences and many more areas where coherences are represented in terms of graphs. In real world networks the nodes trend to clump together within the community i.e., more edge relation between them compare to nodes of the other community. The primary aim of studying community detection is to unfold the potential communities of a network and to prepare a hierarchical structure.
community comprises near family, friends etc., the second community primarily consists of colleagues and neighbours, the third community consists of friends of old days in School or College etc. Now consider the fact that Facebook repeatedly suggests to add a friend of your friend or people on your same profession or people matched in some other way to your declared profile, into your friend list but they never suggest you to add grandmother of your colleague into your friend list. Community detection plays a pivotal role in such a selection. There are several such applications and thus community detection in real world network becomes a fundamental problem in network science.
Several attempts were made by the researchers from diverse fields like Physics, Applied Mathematics, Computer Science and many more to develop a noble algorithm which is reliable and efficient to address any real life applications. The question of reliability is itself tricky and it requires shared definitions of community and partition which are still not defined unambiguously. We believe that a serious assessment of the goodness of the existing algorithm is needed by evaluating their performance on a real world network.
In this paper we present a comparative analysis of some familiar algorithms by evaluating modularity value and clustering coefficient on a data collected from Twitter with 157 nodes. In Section II of this article we have elaborated various parameters of community detection. Section III describes the methodology of collecting data from Twitter. In Section IV we give a brief description of the three familiar community detection algorithms and present their modularity values and transitivity values. In the last section we make a comparative analysis of three algorithms and record our remarks.
II.
COMMUNITY DETECTION
The basic problem of graph clustering is to look for the perfect quantitative definition of community structure. There is no such universally accepted definition and as a matter of fact the definition of community often depends on specific system and/or the application one has in mind. All we can say that there are more and more edges inside the community in comparison to the edges linking nodes outside the community. We shall append below some well-accepted definitions of community and the parameters of our interest.
A. Local Definition
Communities are parts of the graph which hold very few ties with the rest of the system. Sometimes, they can be considered as separate entities with their own autonomy. So it is possible to evaluate them independently of the graph as a whole. Local definitions mainly focus on the subgraph under study which includes its immediate neighbour, but neglecting the rest of the graph. Mainly four types of criteria were identified: complete mutuality, reach ability, vertex degree and the comparison of internal versus external cohesion. The corresponding communities are mostly maximal subgraphs and we cannot enlarge them with the addition of new vertices and edges without losing the property which defines them [9].
case and the condition is really too strict. There exists another problem in which, all vertices of a clique are absolutely symmetric and there is no difference between them. On considering various practical examples, we expect that within a community there is a whole hierarchy of role for the vertices with core vertices coexisting with peripheral part. These vertices may belong to one or more cliques simultaneously, a property which is the basis of the Clique Percolation Method [11].To be very practical, and finding cliques in a graph is an NP-complete problem [12].
B. Global Definition
Communities can also be defined with respect to the graph as a whole. There are several global criteria offered by the researchers to identify communities and most of them are indirect definition in which some global property of the graph is used in an algorithm that delivers communities at the end. However, there is a class of definitions, based on the idea that a graph has community structure if it is different from a random graph. A random graph [13] is not expected to have community structure, because any two vertices have the equal probability to be adjacent, so there should be no preferential linking involving special groups of vertices. Also one can define a null model, i.e., a graph which matches the original one in some of its structural features, but actually a random graph. The null model is basically used as a term of comparison, it is used to verify whether the graph at study displays community structure or not. Null model, which is proposed by Newman and Girvan is the most popular one and consists of a randomized version of the original graph, where edges are rewired at random, under the rule that the expected degree of each vertex matches with the degree of the vertex in the original graph [12]. C. Modularity
Modularity, in which null model is the basic concept is a function which evaluates the goodness of partitions of a graph into clusters. Modularity has the unique privilege of being at the same time a global
criterion to define a community, mainly a quality function and is the key ingredient of the most popular method of graph clustering. In the standard formulation of modularity, a subgraph is a community in which if the number of edges inside the subgraph exceeds the expected number of internal edges then that would have in the null model. This expected number is an average over all possible realizations of the null model.
In community detection we are given a graph and want to find a partition of its vertex set so that each class of the partition can be seen as a separate community. Modularity is the function that is used to measure the quality of such a vertex set partition, when viewed as a set of communities. Unless otherwise stated, the material is based on the review article Community detection in graphs by [Santo Fortunato] [17].
A partition of a graph is a division into disjoint communities such that every vertex is assigned one community. All partitions are not equally good and we need some way to rank them. A quality function is a function that maps each partition of a graph to a number representing the quality of the partition. Higher numbers generally mean better partitions. Most quality functions are additive. A quality function Q is additive if there exists a function that can be applied to each community C of a partition P such that the quality of the partition is the sum of the qualities of the individual communities.
Q(P) = ∑ ( )
input graph called a null model, that keeps some of thie structures of the original graph but that does not display community structure. The modularity function of Newman and Girvan does not depend on a specific null model. The modularity function Q is a sum that runs over all possible pairs of vertices.
Q(C) = ∑ ∑
( ) ( )
where ( ) is the adjacency matrix, and if vertices i and j are adjacent, then ( ) = 1, m is the total number of edges in the whole graph, is the expected number of edges between vertices i and j in the null model, C is a partition of the graph into communities, and are the communities of vertices i and j respectively and (i, j) = 1 if vertices i and j are in the same community( ), and 0 otherwise.
The higher the value of Q, the better the partition is. As there exists several null models, Fortunato claims that it is preferable to choose a null model in which the degree distribution is the same as in the original graph [11].
Modularity has been used as a quality function in many algorithms. In fact Modularity optimization is itself a community detection method which is mainly based on greedy modularity-based community detection methods. The modularity function can easily be extended to graphs with weighted edges. The degrees of vertices i and j, must be replaced by their strengths, where the strength of a vertex is the sum of the weights of the edges adjacent to the vertex.
D.Transitivity
Transitivity is a very important property in social networks and comparatively is of a lesser degree to other networks. If A is connected to B by an edge and B is connected to C then perfect transitivity implies that A is connected to C as well. However it is very rare in real networks, since it implies that each component is a clique, i.e., each pair of reachable
nodes in the graph would be connected by an edge. In real world social networks, transitivity can be represented as friends of friends are friends. Transitivity Index is the measure for transitivity which can be defined as the ratio.
Transitivity Index = .
Sometimes transitivity index is also called a clustering index. The value of transitive index lies between 0 and 1; it is 1 for a transitive graph, whereas in case of random graphs, the expected value of the transitivity index is close to the density of the graph; for actual social networks, values between 0.3 and 0.6 are quite usual.
III.
DATA COLLECTION AND PROCESSING
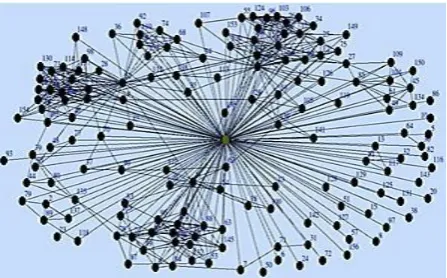
We used real world network by collecting Twitter data. For this, we must have an existing twitter account to collect twitter data. Here we collect data using NodeXL. After twitter login we need to follow some people and it will be better if we get some followers. We will need to use our twitter user id in NodeXL to authenticate the NodeXL to import the twitter data. Now, one can choose to download Twitter User’s network or Twitter Search Network. He also needs to authorize NodeXL to access his Twitter account by selecting the radio button at the bottom and follow the onscreen instructions. Then we can process the gathered data in R using iGraph. After processing the gathered data we got this network structure as in Figure 1.
Figure 1. EGO Network-community without applying any algorithm
IV.
COMMUNITY DETECTION ALGORITHM
A.Edge Betweennees Algorithm
The Girvan–Newman algorithm [14], which is also known as Edge Betweennees algorithm detects communities by progressively removing edges from the original network. The components which are still connected of the remaining network are the communities.
The Girvan–Newman algorithm focuses on edges that are most likely "between" communities, instead of trying to construct a measure that tells us which edges are the most central to communities. Edge is an indicator of highly central nodes in networks. For any node i, edge betweenness can be defined as the number of shortest paths between pairs of nodes that run through that particular node. In case of Edge Betweenness algorithm if there is more than one shortest path between a pair of nodes, each path must be assigned to equal weight such that the total weight of all of the paths is equal to unity. If any network contains communities or groups which are only loosely connected by a few inter-group edges, then all shortest paths between different communities must go along one of these few edges. Thus, the edges which connect communities will have highest edge betweenness value (at least one of them). Hence by removing these edges, the groups are separated from one another and by that underlying community structure of the network is revealed.
The steps for community detectionalgoritmm are summarized as-
Step1:Calculate the betweenness of all existing edges in the network.
Step2: Remove the edge with the highest betweenness. Step3: Recalculate the betweenness of all edges
affected by the removal.
Step4: Repeat Steps 2 and 3 are until no edges remain.
Figure 2. Output graphs from Edge Betweennees Algorithm
In Figure 2 different colours represent different communities. From the data collected from NodeXL, we process them in R using iGraph and the above network structure is revealed whose modularity is 0.5095973. Its transitivity is also calculated as 0.67054315.
B. Label Propagation Algorithm
Label Propagation algorithm is a modularity-specialized algorithm for detecting network communities [15]. This promising algorithm offers some desirable qualities and it favours community divisions where all communities are similar in total degree.
The algorithm begins with unique labeling of each nodes of a network indicating the community it belong to and in subsequent steps of propagation each nodes updates its label to a new one which is most frequent label among all its neighbors. Formally, the label updating rule for node x is:
∑ (
)
ones, then the new label is chosen randomly from them. Until each node has a label that is (one of) the most frequent label(s) of its neighbors, the label propagation step is performed iteratively. At last communities are identified as groups of nodes bearing the same labels.
The biggest advantage of this algorithm is that it is a less expensive computation than what is possible so far (near linear time complexity). The steps of the algorithm are -
Step1: Initialize labels on all nodes. Step2: Randomized node order.
Step3: For every node replace its label with occurring with the highest frequency among neighbours (ties are broken uniformly or randomly).
Step4: If every node has a label which the maximum numbers of their neighbour have, then stop the algorithm.
Figure 3. Output graph from Label Propagation Algorithm
From Figure 3 we can see that different colours represent different communities. From the data we have got in NodeXL, we process them in R using iGraph and got the above network structure, whose modularity is 0.5259585. Its transitivity is also calculated as 0.66849175.
C. Walktrap Algorithm
This algorithm tries to find densely connected subgraphs, which are also called communities in a graph via random walks. The idea behind this algorithm is that short random walks tend to stay in
the same community. To be more specific, the algorithm proposes a node similarity measure which is based on short walks and show that instead of modularity it provides sufficient information to be used for community detection via hierarchical agglomeration [16].
The time complexity of Walktrapalgorithm is O(mn2)
and space complexity is O(n2) in the worst cases and
in the most real cases time complexity is O(n2logn)and
space complexity is O(n2) (n and m are the number of
vertices and edges of the input graph, respectively).
The steps of the algorithm are -
Step1: Assign each vertex to its own community.
Step2: Compute distance between adjacent vertices.
Step3: Choose two "closest" communities and merge them.
Step4: Update distance between communities.
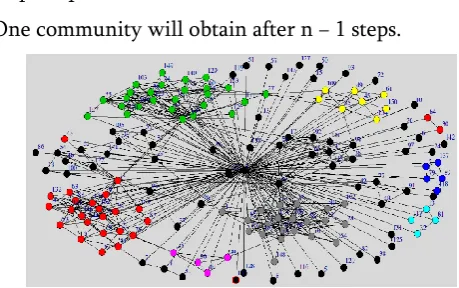
One community will obtain after n − 1 steps.
Figure 4. Output graph from Walktrap Algorithms
From Figure 4 we can see that different colours represent different communities. From the data we have got in NodeXL, we process them in R using iGraph and get the above network structure, whose modularity is 0.5402915. Its transitivity is also calculated as 0.527455062.
V.
RESULTS & CONCLUSION
ii) Transitivity. The results are represented in tabular form for easy visualization.
Table 1. Values From Three Different Algorithm Based On Modularity And Trasitivity Algorithm Modularity Transitivity Edge
Betweenness
0.5095973 0.67054315
Label Propagation
0.5259585 0.66849175
Walktrap 0.5402915 0.527455062
A.Analysis based on Modularity
We have evaluated modularity values of the said network based on three different algorithms. Comparing these three Modularity values as represented in Table 1 we can say that Walktrap algorithm gives the highest value and hence the best granular community may be obtained by this algorithm with respect to modularity.
B. Analysis based on Transitivity
Here we found global transitivity of the network first. For our network global transitivity is 0.2297137 (for 157 nodes).
We then divide the network in modules based on different community detection algorithms and calculate the transitivity of the divided modules separately. Based on the module’s transitivity we calculate the average transitivity of each algorithm which we call the transitivity of the algorithm and presented in table 1.
We observe that the transitivity of each algorithm under our consideration is greater than the global transitivity of our network which is ideal for a good community detection algorithm as module connectivity is more dense than the entire network connectivity.
We observe that Edge Betweenness algorithm has the highest transitivity and hence may identify the best community in a network with respect to transitivity.
C. Conclusion
Modularity defines how well the derived communities are well separated with each other in a network whereas Transitivity measures how nodes are well connected within a single community in a network. So there is always a trade-off between modularity and transitivity for identifying better community detection in a network. In our network based on Twitter data (with 157 nodes) and based on the results we record in Table 1, Label Propagation Algorithm shows optimal solution for community detection.
VI.
REFERENCES
[1]. M. E Newman, Modularity and community structure in networks, Proceedings of the national academy of sciences, vol.103 (23), pp.8577-8582, 2006.
[2]. D. J. Watts and S. H. Strogatz, Collective dynamics of small-world networks, Nature, vol.393, pp.440-442, 1998.
[3]. L. A. N Amaral, A. Scala, M. Barthelemy, and H. E. Stanley, Classes of small-world networks, Proceedings of the national academy of sciences,vol. 97 (21), pp.11149-11152, 2000. [4]. D. Kempe, J. Kleinberg, and E. Tardos,
Maximizing the spread of inuence through a social network, In Proceedings of the ninth ACM SIGKDD international conference on Knowledge discovery and data mining, pp. 137-146, 2003.
[5]. R. T. Sparrowe, and R. C. Liden, Two routes to inuence: Integrating leader-member exchange and social network perspectives, Administrative Science Quarterly, vol.50 (4), pp.505-535, 2005. [6]. M. Girvan, and M. E. Newman, Community
Proceedings of the national academy of sciences, vol.99 (12), pp.7821-7826, 2003.
[7]. A.Clauset, C. R. Shalizi, and M. E. Newman, Power-law distributions in empirical data, SIAM review, vol. 51 (4), pp. 661-703, 2009.
[8]. L. A. Adamic, R. M. Lukose, A. R. Puniyani, and B. A. Huberman, Search in power-law networks, Physical review E 64 (4), 2001.
[9]. S. Wasserman and K. Faust, Social Network Analysis: Methods and Applications, Cambridge University Press, 1994.
[10]. R. D.Luce and A. D. Perry, A method of matrix analysis of group structure, Psychometrika, vol.14 (2), pp.95-116, 1949.
[11]. G. Palla, I. Derenyi, I. Farkas, and T. Vicsek, Uncovering the overlapping community structure of complex networks in nature and society, Nature, vol.435, pp. 814, 2005.
[12]. L. Bomze, I. M., M. Budinich, P. M. Pardalos and M. Pelillo, Handbook of Combinatorial Optimization, Kluwer Academic Publishers, Norwell, pp. 1-74, 1999.
[13]. P. Erdos, and Rnyi, On the evolution of random graphs, Publication of the Mathematical Institute of the Hungarian Academy of Sciences, pp.17-61, 1960.
[14]. M. E. J. Newman and M. Girvan, Finding and evaluating community structure in networks, Phys. Rev. E 69(2), 2004.
[15]. U.N.Raghavan, R. Albert, S. Kumara, Near linear time algorithm to detect community structures in large-scale networks, Physical Review E 76, 036106, 2007.
[16]. P. Pons and M. Latapy, Computing communities in large networks using random walks, Journal of Graph Algorithms and Applications, vol. 10, no. 2, pp. 191–218, 2006.