experimental regression equation was developed by using RSM. In the present work, the effect of wire feed (f), welding speed (s) and torch angle (θ) on weld distortion and % of dilution were investigated in 4mm SS409M steel plates by Gas Metal Arc Welding process (GMAW). The main objective of the study is to find the minimum bowing distortion and finding the range % of dilution to obtain quality weld. It is observed that GMAW process parameters have considerable influence on welding distortion and % of dilution. Design Expert software is used as optimizing tool.
Index Term--
SS409M, Gas Metal Arc Welding process, RSM, Mathematical models, Central composite design, Wire feed, Welding speed, Torch angle, Distortion and % of dilution.
1.INTRODUCTION
Ferritic Stainless steel is used instead of Austenitic stainless steel because of low production cost, high ductility, good corrosion resistance and high temperature oxidation. Ferritic Stainless steels (FSS) belongs to the stainless steel which is having face centered cubic structure, [1]. FSS is noted for stress corrosion cracking and pitting corrosion when it is used in chemical environment [2]. SS 409M is a modified version of SS 409 of Ferritic grade with 0.03% carbon content. SS409 M replaces carbon steels and low alloy steels where higher strength, abrasion resistance, weld-ability and slide-weld-ability are required. It posses very good scaling & oxidation at elevated temperature including sulphur bearing atmospheres. The material is mainly used in transport wagons, petrochemical, agriculture, fishing, mining, quarrying & sewage plants [3].Welding is one of the
process is that melts and join metals by heating them with an arc established between a continuously fed filler wire electrode and the metals. The process is used with externally supplied shielding gas without applying pressure [4]. Type of shielding gas and its flow rate also have effect on heat input [5]. It is a versatile welding process used in variety of metals and alloys. In this process the electrode used is consumable wire of 1.2 mm diameter wounded on a spool, which is fed through the weld through the welding torch nozzle. The shielding gas used is argon to protect the weld pool from the contaminants present in the air. If oxygen, nitrogen gases enter into the welding atmosphere it may cause porosity in the weld. This process is suitable for producing high quality welds even in high speed welding condition, and also this process reduce spattering and minimize the porosities in the weld [6].
Welded components undergo various types of distortions like longitudinal shrinkage, transverse shrinkage, angular and bowing etc [7]. These distortions are affected by different factors such as heat input, shape of penetration, joint type and plate thickness, etc [8]. % of dilution is the major factor deciding strength of the weld in parent metal, heat affected zone and weldment.
2.EXPERIMENTAL PROCEDURES
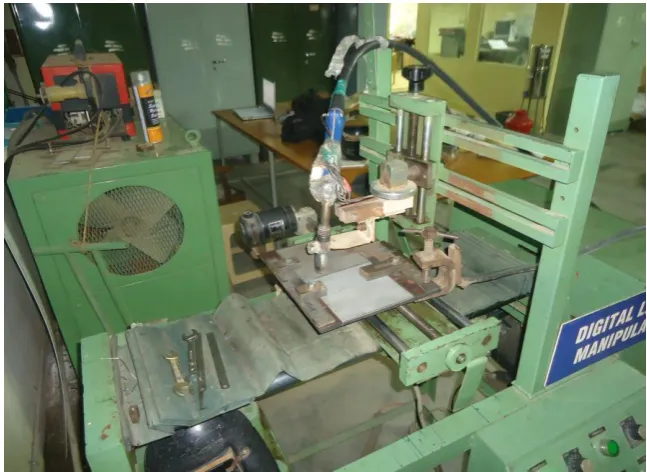
Fig. 1. Experimental setup of GMAW machine
Fig .2 shows the welded specimen in the fixture. The pulsed arc transfer is selected because it is suitable for all position welding and it is suitable process for 4 mm thickness plate [9]. 308L and 316L electrode are suitable for welding FSS grade steels [10-11]. 308L type filler shows
better performance than 316L type of filler wire because the strength is 30% higher than the base plate. 2mm root gap is maintained while welding between plates. The experiment was designed based on five level factorial central composite design [12].
Fig. 2.Welded specimen in the fixture.
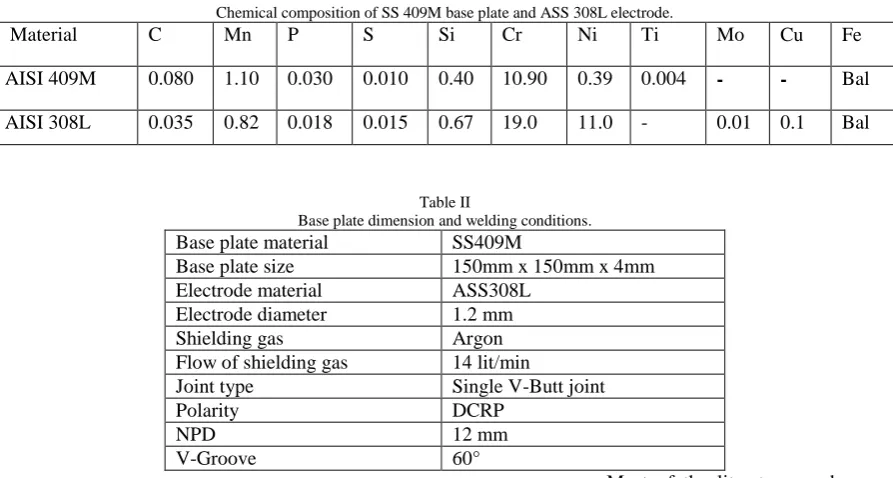
Shielding gas Argon Flow of shielding gas 14 lit/min
Joint type Single V-Butt joint
Polarity DCRP
NPD 12 mm
V-Groove 60°
3 RESPONSE SURFACE METHODOLOGY
In this paper application of RSM in developing mathematical models and plotting contour graphs relating input variables namely wire feed (f), welding speed (s), welding torch angle(θ) the measured output variables are weld distortion (d) and percentage of dilution (p) are discussed. The equations is represented in first order polynomial equation and second order polynomial equation, represented in eqn.(1)
Y = (s, f, θ). Where Y is the response.
In order to evaluate the weld distortion and % of dilution of the welded specimen, a regression equation is developed to correlate the process parameters.
Y = a0 +a1f + a2s + a3 θ +a11f 2
+ a2s 2
+ a33 θ 2
+a12fs + a23sθ + a31 fθ …..eqn(1)
Where a0 the free term of the regression equation; the coefficients a1, a2, a3 the linear terms; the coefficients a11, a22, a33 are the quadratic terms and the coefficients a12, a23, a31 are the interaction terms.
Most of the literature works concentrate on microstructure, micro hardness, tensile strength, impact strength and corrossion studies of the welded specimens. But the published information about GMAW welding process parameters on distortion and % of dilution in SS 409M plate is very much minimum.
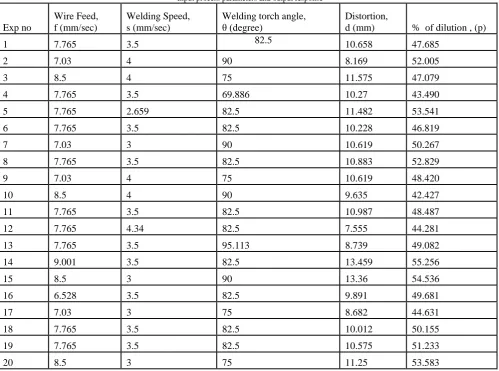
4.SELECTING INPUT PROCESS PARAMETER, DEVELOPING THE DESIGN MATRIX AND ITS RESPONSE
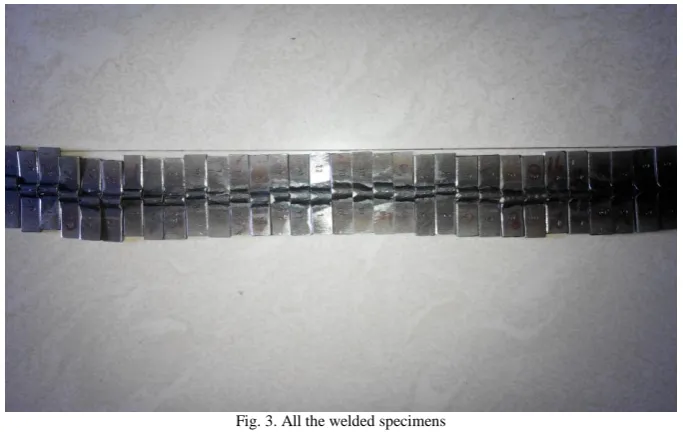
In this work, the input process parameters taken is wire feed (f) welding speed (s) and welding torch angle (θ). After conducting a number of trials by varying one of the process parameters and remaining is kept constant. The limits of the each process parameter is evaluated based on inspecting the bead smooth appearance. Table III briefs the limits of GMAW process parameters and their levels. Fig. 3 shows all the welded specimens. After welding the specimens were cut into to the required dimension with the use of power hacksaw.
Fig. 3. All the welded specimens
Table III
Input process parameters and their levels
After cutting, the weld bead surface is roughly polished in hand and by emery sheets. The etchant 5% Nital solution (1/20 of Nitric acid in ethanol )is applied on the surface of the weld bead. Distortion measurement is essentail part in prediction and control of distortion. Distortion in welded componets is measured by using photogrammetry [13]. By using vernier height gauge bowing distortion is mesured [14]. In this investigation the weld distortion and percentage dilution is measured by using Rapid – I Vision Measuring System (V 2015J LX) Model as given in fig. 4
Fig. 4. Rapid – I Vision Measuring System (V 2015J LX) Model
S.no Process Parameters Units Factor Levels
-1.682 -1 0 1 1.682
1 Wire Feed (f) (mm/sec) 6.528 7.03 7.765 8.5
9.001
2 Welding speed (s) (mm/sec) 2.659 3 3.5 4 4.340
9 7.03 4 75 10.619 48.420
10 8.5 4 90 9.635 42.427
11 7.765 3.5 82.5 10.987 48.487
12 7.765 4.34 82.5 7.555 44.281
13 7.765 3.5 95.113 8.739 49.082
14 9.001 3.5 82.5 13.459 55.256
15 8.5 3 90 13.36 54.536
16 6.528 3.5 82.5 9.891 49.681
17 7.03 3 75 8.682 44.631
18 7.765 3.5 82.5 10.012 50.155
19 7.765 3.5 82.5 10.575 51.233
20 8.5 3 75 11.25 53.583
5.RESULTS AND DISCUSSIONS
The analysis of variance for the factor d and p is made with the aim of analyzing the influence on f, s and θ. The analysis is for 5% significance level and 95% confidence level.
5.1 Statistical analysis for weld distortion (d)
Table V
ANOVA for weld distortion (w)
Source Sum of Squares df Mean Square F Value p-value Prob> F % of Contribution Remarks
Model 0.927641 9 0.103071 12.25668 0.0003 Significant
A-Wire
Feed 0.315004 1 0.315004 37.45859 0.0001 30.80209 Significant
B-Welding
Speed 0.203605 1 0.203605 24.21157 0.0006 19.79136 Significant
C-Torch
Angle 0.01856 1 0.01856 2.207006 0.1682 1.501482
Not significant
AB 0.021489 1 0.021489 2.555364 0.1410 1.791033
Not significant
AC 0.00104 1 0.00104 0.123723 0.7323 -0.23011
Not significant
BC 0.215135 1 0.215135 25.58266 0.0005 20.93099 Significant
A^2 0.062914 1 0.062914 7.481391 0.0210 5.885475 Significant
B^2 0.041275 1 0.041275 4.908171 0.0511 3.746652
Not significant
C^2 0.035061 1 0.035061 4.169234 0.0684 3.132458
Not significant
Residual 0.084094 10 0.008409 87.35143
Lack of Fit 0.067251 5 0.01345 3.992873 0.0774 0
Not significant
Pure Error 0.016843 5 0.003369 12.64857
Cor Total 1.011735 19 100
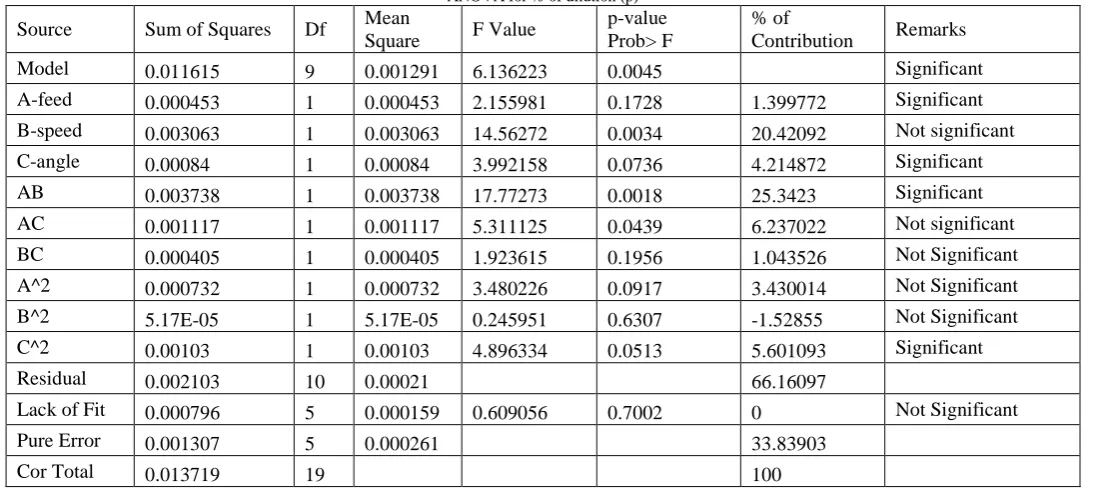
5.2 Statistical analysis for % of dilution (p)
In Table VI the individual factors s and the combined factors (f x s) are the factors contributing for % of dilution. The factor s
contributes 20.42 % and (f x s) contributes 25.34 %. Both are the higher level of contribution in % of dilution. The factor (f x θ) contributes 6.23% and θ2 contribution is 5.60%. The factors f, (s x θ) and f2 contribution is weak.
Table VI
ANOVA for % of dilution (p)
Source Sum of Squares Df Mean
Square F Value
p-value Prob> F
% of
Contribution Remarks
Model 0.011615 9 0.001291 6.136223 0.0045 Significant
A-feed 0.000453 1 0.000453 2.155981 0.1728 1.399772 Significant
B-speed 0.003063 1 0.003063 14.56272 0.0034 20.42092 Not significant
C-angle 0.00084 1 0.00084 3.992158 0.0736 4.214872 Significant
AB 0.003738 1 0.003738 17.77273 0.0018 25.3423 Significant
AC 0.001117 1 0.001117 5.311125 0.0439 6.237022 Not significant
BC 0.000405 1 0.000405 1.923615 0.1956 1.043526 Not Significant
A^2 0.000732 1 0.000732 3.480226 0.0917 3.430014 Not Significant
B^2 5.17E-05 1 5.17E-05 0.245951 0.6307 -1.52855 Not Significant
C^2 0.00103 1 0.00103 4.896334 0.0513 5.601093 Significant
Residual 0.002103 10 0.00021 66.16097
Lack of Fit 0.000796 5 0.000159 0.609056 0.7002 0 Not Significant
Pure Error 0.001307 5 0.000261 33.83903
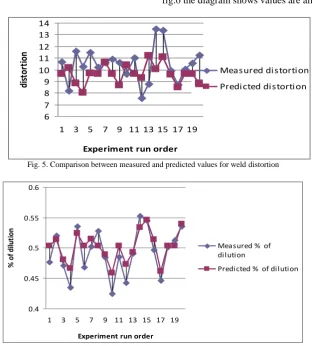
Fig. 5. Comparison between measured and predicted values for weld distortion
0.4 0.45 0.5 0.55 0.6
1 3 5 7 9 11 13 15 17 19
Experiment run order
%
of
di
lut
ion
Measured % of dilution
Predicted % of dilution
Fig. 6. Comparison between measured and predicted values for % of dilution
7. Effect of machining parameters on surface response factors
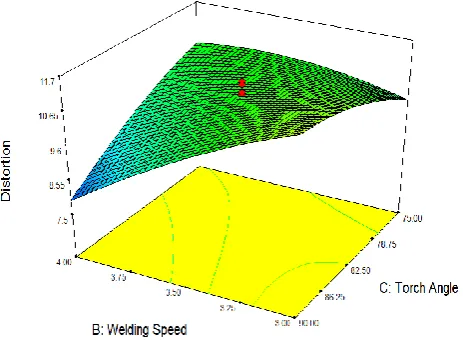
7.1 Distortion (d) Fig.7 shows the 3-d surface graph at wire feed at 7.77 mm/sec if welding speed s increases distortion value gradually reducing. The maximum distortion occurs at
minimum welding speed and when the torch position is straight. Most significance interactions were found between wire feed f and welding speed s.ost
6
7 8 9 10 11 12 13 14
1 3 5 7 9 11 13 15 17 19
Experiment run order
di
st
or
ti
on
Measured distortion
Fig. 7. Surface plots of weld distortion at Wire feed 7.77 mm/sec
7.2 % of dilution (p)
Fig.8 Shows graph of % of dilution. The p value is maximum when feed is at maximum level and speed is at minimum level. The objective of the study is to
set the % of dilution level with in the range. The maximum % of dilution occurs when the wire feed is at maximum and the welding speed is at minimum. When the torch angle is at maximum position the dilution % is also at maximum level.
Fig. 8. Surface plots of % of dilution at Angle 82.5°
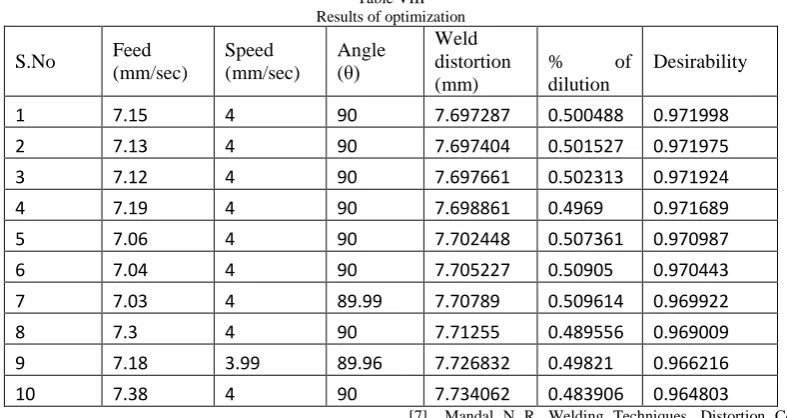
8.OPTIMIZATION OF WELDING CONDITIONS
The optimum welding condition for welding SS409M is achieved in the solution keeping the welding speed, feed in optimum level. Table VII. represents range of the input parameter and constraints of the response.
Table VIII. represents the RSM optimization results in the order of decreasing desirability level. The optimized feed is 7.15 mm/sec, welding speed is 4 mm/sec and welding angle is 90°.
Table VII
Goal of constraints and its upper and lower limits
Name of the constraints Goal Lower limit Upper limit
Feed (mm/sec) Is in range 7.03 8.5
Speed (mm/sec) Is in range 3 4
Angle (θ) Is in range 75 90
Weld distortion (mm) Minimize 7.555 13.459
9 7.18 3.99 89.96 7.726832 0.49821 0.966216
10 7.38 4 90 7.734062 0.483906 0.964803
9. CONCLUSION
The investigation is done by using RSM, following conclusions are drawn
1. RSM approach investigate the influence of Wire Feed (f), Welding Speed (s) and Torch angle ( ) on weld distortion (d) and % of dilution (p).
2. Regression equation is formed for distortion (d) and % of dilution (p).
3. Comparison of experimental values with predicated values shows the values are almost nearer to each other.
4. It is observed that torch position also influencing distortion and % of dilution.
5. Increase in dilution is significant when the welding speed is minimum.
6. Wire feed has more predominant effect on weld distortion than that of the other parameters as at 7.15 to 7.13 mm/sec the feed remains constant, irrespective of value of welding speed and torch angle.
REFERENCES
[1] M.V.Venkatesan, N.Murugn et al. Influence of FCA Welding process Parameters on Distortion of 409M Stainless Steel for Rail Coach Building. Journal of Iron and Steel Research International,2013, 20(1): 71-78.
[2] Mohandas T, Reddy G.M, Naveed M. A Comparative Evaluation of Gas Tungsten and Shielded Metal Arc Welds of a Ferritic Stainless Steel. Journal of Material Processing Technology 1999, 94, 133. [3] 409M-Technical Data, Detail brochure published by SAIL, Salem,
TamilNadu, India, 2004.
[4] Gautam kocher, Sandeep kumar, Gurcharan Singh. Experimental Analysis in MIG welding with IS 2062 E 250 A steel with various effects.
[5] Marya M, Edward G R, Liu S. An Investigation on the Effects of Gases in GTA Welding of a Wrought AZ80 Magnesium Alloy [ J ] . Welding Journal, 2004, 7: 203.
[6] P.C.Sharma. A Text Book of Production Technology.S.Chand publication: 2006.
[7] Mandal N R. Welding Techniques, Distortion Control and Line Heating [M], New Delhi: Narvosa Publishing House, 2009.
[8] Dean Deng, Hidekazu Murakawa, Yukio Ueda. Theoretical Prediction of Welding Distortion Considering Positioning and Gap Between Parts [J] . International Journal of Offshore and Polar Engineering, 2004, 14(2): 138.
[9] Gas Metal Arc Welding. Welding guide.The Lincoln Electric Company. Cleveland. Ohio U.S.A.
[10] K.R.Ananathanarayanan. Practical Guidelines for Fabrication of SS409M, Indian Stainless Steel Development Association.
[11] Srinivasan N K. Welding Technology [M]. New Delhi: Kanna Publications, 1992.
[12] N.Murugan, R.S.Parmar, Effect of SAW process variables on bead geometry in single wire surfacing, Journal of Material Processing Technology 37 (1993) 767- 780.
[13] Lightfoot M P , Bruce G J , Barber D M. The Measurement of Welding Distortion in Ship Building Using Close Range Photogrammetry [D]. UK: New Castle University, 2007.
[14] Partner R S. Welding Engineering and Technology