Available online on 15.12.2018 at http://jddtonline.info
Journal of Drug Delivery and Therapeutics
Open Access to Pharmaceutical and Medical Research© 2011-18, publisher and licensee JDDT, This is an Open Access article which permits unrestricted non-commercial use, provided the original work is properly cited
Open
Access
Research Article
A study of method development and validation for estimation of Azelastine
hydrochloride in nasal spray formulations by RP-HPLC method
Charansingh H. Gill1*, Pankaj N. Kulkarni1, A. S. Nipte1, C. K. Jadhav1, Asha V. Chate1, Alaknanda M. Dodake-Supekar2
1Department of Chemistry, Dr. Babasaheb Ambedkar Marathwada University, Aurangabad, Maharashtra, India 431004 2Department of Chemistry, S.B.E.S. College of science, Aurangpura, Aurangabad, Maharashtra, India 431001
ABSTRACT
A simple reverse-phase HPLC method for the estimation of Azelastine hydrochloride in nasal spray formulations has been developed. The method is simple, accurate, precise, specific and linear over the analysis range. This developed method has been validated according to International Conference on Harmonization (ICH) guideline with respect to system suitability, specificity, precision, linearity, accuracy, and robustness. An isocratic condition of mobile phase comprising Phosphate buffer (pH 3.1): Acetonitrile in a ratio of 60:40, v/v at a flow rate of 1.0 mL/minute over RP C18 (octadecylsilane (ODS), 250 × 4.6 mm, 5 µm, CHROMOSIL) column at ambient temperature was maintained. Besides, the chromatographic peak was observed sharp & symmetric. The proposed method was successfully applied for the estimation of the Azelastine hydrochloride in nasal spray formulation.
Keywords: Azelastine hydrochloride, ICH, Nasal Spray, RP-HPLC and Validatation
Article Info: Received 23 Oct 2018; Review Completed 05 Dec 2018; Accepted 07 Dec 2018; Available online 15 Dec 2018
Cite this article as:
GillCH, Kulkarni PN, Nipte AS, Jadhav CK, Chate AV, Dodake-Supekar AM, A study of method development and validation for estimation of Azelastine hydrochloride in nasal spray formulations by RP-HPLC method, Journal of Drug Delivery and Therapeutics. 2018; 8(6-s):236-240 DOI: http://dx.doi.org/10.22270/jddt.v8i6-s.2222
*Address for Correspondence:
Charansingh H. Gill, Department of Chemistry, Dr. Babasaheb Ambedkar Marathwada University, Aurangabad, Maharashtra, India 431004;
INTRODUCTION
Inflammation mostly occurs due to an allergic reaction, and people who suffer from nasal allergies, such as hay fever, dust and mite, tend to experience a variety of symptoms due to this
Inflammation1. Inflammation is not a synonym for infection. Infection describes the interaction between the action of microbial invasion and the reaction of the body's inflammatory response2. Simply, Inflammation is part of the body's immune response.Inflammation of the nasal passage forces fluid out of the nasal tissues, resulting in a runny and blocked nose. Other symptoms include interfere with hearing and speech, sneezing, watery and itchy eyes.
The three main types of drugs available for anti-inflammatory and anti-allergic effect are corticosteroids, antihistamines3 and decongestants. Corticosteroid drugs include budesonide, flunisolide, fluticasone furoate, fluticasone propionate and mometasone furoate, antihistamine drugs include azelastine and olopatadine . Two common decongestants available in the nasal sprays or drops form are oxymetazoline and phenylephrine.
Azelastine hydrochloride is an antihistamine formulated as a metered-spray solution for intranasal administration. It works by blocking certain natural substances called histamines that are responsible for nasal symptoms. This medication issued to relieve nasal symptoms such as runny/itching/stuffy nose, sneezing, and post-nasal drip caused by allergies or other conditions 1.
Azelastine has a triple mode of action: histamine effect, Mast-cell stabilizing effect and Anti-inflammatory effect4.
Its chemical name is (±)-1-(2H)-phthalazinone,4-[(4chlorophenyl) methyl]-2-(hexahydro-1-methyl-1H-azepin-4-yl)-, monohydrochloride. Its molecular formula is C22H24ClN3O•HCl with the following chemical structure:
Figure 1:Chemical structure of Azelastine
Azelastine hydrochloride occurs as a white, almost odorless, crystalline powder with a bitter taste. It has a molecular weight of 418.37. It has a melting point of about 225 °C. It is sparingly soluble in water, methanol, and propylene glycol5.
In current scenario, official method for quantification of Azelastine hydrochloride is available and that is of titrimetric method6 which is highly sensitive and time consuming, but accurate and precise reverse phase HPLC method is not available. Our interest of work was to develop suitable and rapid HPLC method required for analysis and characterization of Azelastine hydrochloride from nasal spray formulation.
2. MATERIALS AND METHODS 2.1 Materials and Reagents
Azelastine hydrochloride working standard and Placebo were a kind gift of Shree Industrial Training Centre And Research Laboratory, Jalgaon, Maharashtra. Test samples purchased from market store. HPLC grade Acetonitrile, Potassium dihydrogen phosphate and HPLC Water were purchased from Ranbaxy Fine Chemicals Ltd., India. 2.2 HPLC system
High-performance liquid chromatographic system (Younglin ( S.K) Gradient System) and equipped with UV– visible detector was used for the analysis. The data were recorded using Autochro -3000 software.
2.3 Preparation of mobile phase
Dissolved 6.8 gm of KH2PO4 in to 1000 ml water and sonicated to dissolved (pH observed 4.42), adjusted to pH 3.10 with diluted Orthophosphoric acid solution. Buffer filtered through a 0.45-µm PVDF membrane filter and sonicated to degas. Prepared a mixture of Buffer (pH 3.1) : Acetonitrile (60:40), v/v, sonicated to degas.
2.4 Preparation of standard solution (50 PPM)
Accurately weighed and transferred 50 mg of Azelastine hydrochloride working standard in to 100 mL volumetric flask, added about 30 mL of Acetonitrile and sonicated to dissolve, wait to cool and diluted up to mark with diluent. Transferred 5 mL of this solution in to 50 mL volumetric and diluted up to mark with Mobile Phase.
2.5 Preparation of sample solution (50 PPM) Brand Name:- ARZEP( CADILA HEALTH CARE)
Transferred 2.5 mL of Sample solution in to 50 mL volumetric flask, added about 30 mL of mobile phase and sonicated to mixed properly, diluted up to mark with mobile phase, and the samples were analyzed using the proposed analytical methods.
2.6 Chromatographic conditions
The analysis was carried out at ambient temperature under isocratic condition. The mobile phase was run at a flow rate of 1.0 mL/minute for 10 min. The injection volume was 20 µL for standard and samples. Before analysis, every standard and sample was filtered through 0.45 µm Nylon syringe filter. The column eluent was monitored with UV detection at 239 nm7.
2.7 Method validation
objective of validation of an analytical procedure is to demonstrate that it is suitable for its intended purpose. Typical parameters verified in validation of analytical method are listed in table 1. ICH Q2(R1)8 is considered the primary reference for recommendations and definitions on validation characteristics for analytical procedures.
Table 1: Typical parameters verified in method validation
Sr No Validation parameter
1 System suitability
2 Specificity
3 Precision
4 Accuracy
5 Linearity
6 Robustness
2.7.1 System suitability
System suitability test as an integral part of method development was used to ensure adequate performance of the chromatographic system. To determine system precision Azelastine Hydrochloride standard solution was prepared and injected for six times into HPLC system. The mean, SD and % RSD for peak areas of Azelastine was calculated.
2.7.2 Specificity
The ICH documents define specificity as the ability to assess unequivocally the analyte in the presence of components that may be expected to be present, such as impurities, degradation products and matrix components. The placebo solution containing excipients without Azelastine were injected.
To evaluate the specificity of the method blank, placebo and test solution were injected.
2.7.3 Precision
The precision of an analytical procedure is the degree of agreement among individual test results when the procedure is repeatedly applied to multiple samplings of a homogeneous sample. The precision of an analytical procedure is usually expressed as the standard deviation or relative standard deviation (coefficient of variation) of a series of measurements. Precision may be a measure of either the degree of reproducibility or of repeatability of the analytical procedure under normal operating conditions. The precision of the assay method was assessed with respect to repeatability and reproducibility. The precision of the proposed method was checked by ability of responses after replicate injections and expressed as %RSD among responses using the formula. Sample of a single batch were prepared six times and analyzed as per test method, % assay of Azelastine for six samples calculated for method precision.
2.7.4 Accuracy
2.7.5 Linearity
Linearity was checked on different concentrations within 50–200% of the nominal standard concentration. The linearity of the proposed method was evaluated by using calibration curve to calculate the coefficient of correlation, slope, and intercept values.
2.7.6 Robustness
Robustness is an indication of the reliability of the analytical method during normal usage. The effect of the following deliberate changes in chromatographic
conditions was monitored: Detector wavelength±2 nm, Flow rate±10%, Temperature±2 °C, and pH of Buffer solution±0.1.
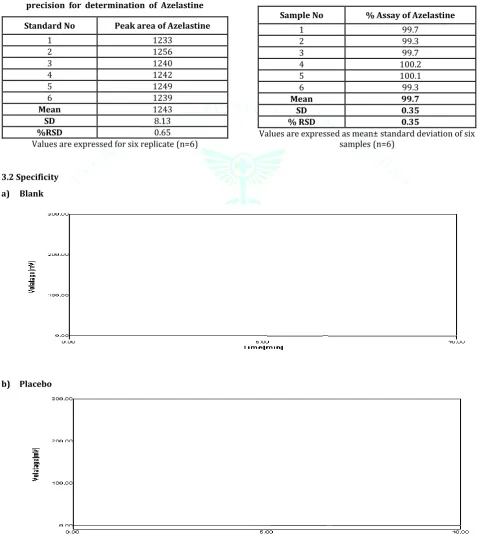
3. RESULTS AND DISCUSSION 3.1 System suitability
The results of system suitability were within acceptable limits as shown in table 2.
Table 2: Results from the determination of system precision for determination of Azelastine
Standard No Peak area of Azelastine
1 1233
2 1256
3 1240
4 1242
5 1249
6 1239
Mean 1243
SD 8.13
%RSD 0.65
Values are expressed for six replicate (n=6)
Table 3: System suitability data from Method precision
Sample No % Assay of Azelastine
1 99.7
2 99.3
3 99.7
4 100.2
5 100.1
6 99.3
Mean 99.7
SD 0.35
% RSD 0.35
Values are expressed as mean± standard deviation of six samples (n=6)
3.2 Specificity
a) Blank
c) Sample solution
Figure 2: HPLC Chromatogram a) Blank, b) Placebo and c) Sample solution
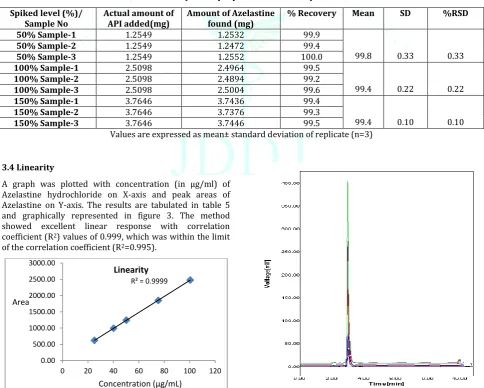
3.3 Accuracy
Known amount of Azelastine hydrochloride was spiked in placebo at about 50,100 and 150% of test concentration. The amount of Azelastine hydrochloride recovered was quantified as per developed method. The % recovery was
calculated from the amount found and actual amount added. The results are tabulated in table 4. The overall recovery of Azelastine hydrochloride in the samples was in between 98.0 to 102.0% (RSD<2%) which is sufficient for quantification of Azelastine hydrochloride in nasal spray formulations.
Table 4: Evaluation of accuracy of the proposed method for quantification of Azelastine Spiked level (%)/
Sample No Actual amount of API added(mg) Amount of Azelastine found (mg) % Recovery Mean SD %RSD
50% Sample-1 1.2549 1.2532 99.9
99.8 0.33 0.33
50% Sample-2 1.2549 1.2472 99.4
50% Sample-3 1.2549 1.2552 100.0
100% Sample-1 2.5098 2.4964 99.5
99.4 0.22 0.22
100% Sample-2 2.5098 2.4894 99.2
100% Sample-3 2.5098 2.5004 99.6
150% Sample-1 3.7646 3.7436 99.4
99.4 0.10 0.10
150% Sample-2 3.7646 3.7376 99.3
150% Sample-3 3.7646 3.7446 99.5
Values are expressed as mean± standard deviation of replicate (n=3)
3.4 Linearity
A graph was plotted with concentration (in µg/ml) of Azelastine hydrochloride on X-axis and peak areas of Azelastine on Y-axis. The results are tabulated in table 5 and graphically represented in figure 3. The method showed excellent linear response with correlation coefficient (R2) values of 0.999, which was within the limit of the correlation coefficient (R2=0.995).
R² = 0.9999
0.00 500.00 1000.00 1500.00 2000.00 2500.00 3000.00
0 20 40 60 80 100 120
Linearity
Table 5: Results of linearity
Spike level in % Concentration (mcg/mL) Average Area (N=2)
50 25.10 622
80 40.16 995
100 50.20 1245
150 75.29 1850
200 100.39 2478
Slope 24.59
Y-Intercept 6.24
Correlation Coefficient ® 0.99998
5 Robustness results
Robustness of the method was verified by deliberately varying the following chromatographic conditions as shown in table 5 i.e.
By changing the wavelength by±2 nm
By changing the flow rate by±10%
By changing the column oven temperature by±2 °C By changing the pH of buffer used for mobile phase by
to±0.1 unit
Table 6: Robustness experiment Sr.
No. Robustness Parameter Time (min) Retention Tailing factor Theoretical plates % RSD of Standard solution
1 Wavelength 237 nm 2.98 1.3 4268 0.17
2 Wavelength 241 nm 2.98 1.3 4170 0.23
3 Flow rate (0.90 mL/min) 3.04 1.3 4527 0.10
4 Flow rate (1.10 mL/min) 2.88 1.2 4649 0.06
5 Column Temp 28° C 2.98 1.3 4200 0.11
6 Column Temp 32° C 2.98 1.3 4270 0.34
7 Buffer pH 3.0 2.98 1.2 3819 0.17
8 Buffer pH 3.2 2.98 1.2 3945 0.11
3.6 Estimation of formulations
The assay values of Azelastine hydrochloride in nasal spray formulations ranged from 99. % to 100.2%, with a standard deviation of not more than 0.35%. The assay values for the formulations were same as mentioned in the label claim, indicating the suitability of the proposed analytical method. The estimated drug content with low values of standard deviation established the precision of the proposed method.
3.7 DISCUSSION
Development of an analytical method for assessment of drugs in the pharmaceutical dosage form is of utmost necessity to confirm the quality of nasal formulations with respect to assay6 and spray content uniformity. Our developed HPLC analytical method for estimation of Azelastine in nasal spray formulations has used very less amount of organic solvents which is cost effective and environment friendly. Also, the method was found to be simple and accurate and was able to resolve the drug from excipients in a short analytical run time.
4.0 CONCLUSIONS
A simple reversed-phase HPLC method for the analysis of Azelastine hydrochloride in nasal spray formulations was developed and validated. The proposed method is simple, accurate, precise, specific and linear over the analysis
ranges and was able to resolve the drug from excipients in a short analytical run time.
ACKNOWLEDGMENT
We thank Mr Anil Vispute, Shree Industrial Training Centre and Research Laboratory, Jalgaon, Maharashtra for providing required laboratory facilities and Dr Abhinandan Danodia, Research Scientist, Integral Bio Sciences, Noida, Delhi NCR for providing support and enthusiasm to complete this work.
CONFLICT OF INTERESTS Declared none
REFERENCES
1. Durham SR. The inflammatory nature of the allergic disease. Clin Exp Allergy 1998; 28(Suppl 6):20-4.
2. https://en.wikipedia.org/wiki/Inflammation
3. Lieberman P. Management of allergic rhinitis with a combination antihistamine/anti-inflammatory agent. J Allergy Clin Immunol 1999; 103:S400-4.
4. https://en.wikipedia.org/wiki/Azelastine.
5. https://pubchem.ncbi.nlm.nih.gov/compound/azelastine.
6. EUROPEAN PHARMACOPOEIA 5.0: 1038.
7. http://inventi.in/journal/article/impact/4/6033/pharm-analysis-quality-assurance/pi
8. ICH guideline, Q2(R1) step 4, Validation of Analytical Procedures: Text and Methodology (2005).