INTRODUCTION
Recent developments in gene and pro-tein expression analysis technology have suggested that gene expression is a key indicator of an individual’s pathophysio-logic status (1-4). Consequently, clinical application of gene expression technol-ogy will vastly improve on the current approaches for monitoring health and disease. Compelling associations between gene expression and disease have been demonstrated in many studies ranging from inflammatory disease to cancer. For instance, studies have pointed to abnor-mal gene expression in peripheral blood mononuclear cells in lupus patients compared with healthy controls (5,6). Other studies have found differences in gene expression patterns between cancer-ous liver or pancreatic tissue and
nontu-mor liver and pancreatic tissues (7,8). Additionally, gene expression profiling of breast tumor biopsy tissue correlated with therapeutic response to treatment (9). Results from these studies demonstrate that measurements of gene expression can be used in the diagnosis and monitoring of disease. However, a key requirement for clinical application of gene expression technology is distinguishing between nat-ural variations in gene expression among healthy subjects and changes associated with a disease condition. The establish-ment of a normal range of expression for a particular population is required as a “reference range” (10).
Immune function is controlled by a network of molecular and cellular path-ways. It is well recognized that sup-pressed immune responses (for example,
immunosuppressive therapies and AIDS) or excessive responses (for example, acute respiratory distress syndrome and autoimmunity) can contribute to disease. Thus, homeostatic control and tight regu-lation of responses are fundamental char-acteristics of the immune system. For ex-ample, in the absence of disease, body temperature remains relatively constant within an individual, suggesting that the body strives to hold its temperature close to a defended set point. During a response to infection, the inflammatory cytokines interleukin-1, interleukin-6, and tumor necrosis factor are released into the blood and bind with receptors in the hypothala-mus, resulting in fever (11). However, im-mune cells also manufacture and release factors, such as interleukin-1 receptor an-tagonist and interleukin-10, that counter-act the effects of pro-inflammatory cy-tokines and reduce body temperature (12,13). As a result, body temperature rises only moderately during many fever episodes, and returns to its previous set point upon clearance of the infection.
M O L M E D 1 2 ( 7 - 8 ) 1 8 5 - 1 9 5 , J U L Y - A U G U S T 2 0 0 6 | M C L O U G H L I N E T A L . | 1 8 5
Expression Observed in Healthy Blood Donors Using RT-PCR
Address correspondence and reprint requests toDanute M. Bankaitis-Davis, Source MDx, 2500 Central Ave., Suite H-2, Boulder, CO 80301. Phone: (303) 385-2721; fax: (303) 385-2750; e-mail: [email protected]
Submitted March 12, 2006; accepted for publication June 7, 2006.
Kevin McLoughlin,
1Ken Turteltaub,
1Danute Bankaitis-Davis,
2Richard Gerren,
2Lisa Siconolfi,
2Kathleen Storm,
2John Cheronis,
3David Trollinger,
2Dennis Macejak,
2Victor Tryon,
2and Michael Bevilacqua
21
Lawrence Livermore National Laboratory, Livermore, CA, USA; 2Source Molecular Diagnostics (Source MDx), Boulder, CO, USA; 3Paradocs Biomedical, Conifer, CO, USA.
The use of quantitative gene expression analysis for the diagnosis, prognosis, and monitoring of disease requires the ability to distin-guish pathophysiological changes from natural variations. To characterize these variations in apparently healthy subjects, quantitative real-time PCR was used to measure various immune response genes in whole blood collected from blood bank donors. In a single-time-point study of 131 donors, of 48 target genes, 43 were consistently expressed and 34 followed approximately log-normal distribu-tion. Most transcripts showed a limited dynamic range of expression across subjects. Specifically, 36 genes had standard deviations (SDs) of 0.44 to 0.79 cycle threshold (CT) units, corresponding to less than a 3-fold variation in expression. Separately, a longitudinal study of 8 healthy individuals demonstrated a total dynamic range (> 2 standard error units) of 2- to 4-fold in most genes. In contrast, a study of whole blood gene expression in 6 volunteers injected with LPS showed 15 genes changing in expression 10- to 90-fold within 2 to 5 h and returning to within normal range within 21 hours. This work demonstrates that (1) the dynamic range of expression of many im-mune response genes is limited among healthy subjects; (2) expression levels for most genes analyzed are approximately log-nor-mally distributed; and (3) individuals exposed to an infusion of bacterial endotoxin (lipopolysaccharide), show gene expression profiles that can be readily distinguished from those of a healthy population. These results suggest that normal reference ranges can be es-tablished for gene expression assays, providing critical standards for the diagnosis and management of disease.
This and other evidence (14) imply that inflammatory/immune genes may be tightly regulated. It is further hypothe-sized that immune system homeostasis would be reflected in a narrow range of expression levels or set points for key molecules in these pathways among healthy subjects.
In certain gene expression studies, re-producible patterns in subsets of genes have been noted in normal tissues (15-18). The majority of these studies have used microarrays to explore the pat-terns of expression in isolated blood cell fractions (15,18) or other target tis-sues, including retina (16) and skin (17). Some studies (16,19) have used repli-cate arrays to assess the relative contri-butions of technical and biological fac-tors to the overall variation in
measurement values. The results show interindividual variation for gene ex-pression, as well as variation over time within an individual. In addition, gene expression can be sensitive to sources of technical variability, such as time after phlebotomy and method of RNA isola-tion (20-23). Even within a platform, such as microarray, considerable diver-gence is reported (24).
In recent years, quantitative real-time (QRT) PCR has emerged as an effective and reproducible tool for transcript anal-ysis (25). It measures relative abundances through PCR-based synthesis of target gene amplicons and activation of target-specific fluorescent probes. The amount of fluorescence generated during the ex-ponential amplification phase provides robust comparative abundance measure-ments for different amplicons in the same or different wells (25). Whole blood con-tains representative populations of all the mature cells of the immune system as well as secretory proteins associated with cellular communications (26). The earliest observable changes of cellular immune activity are altered levels of gene expression within the various im-mune cell types (27). Therefore, QRT-PCR can be an effective technology for reproducibly quantifying gene expres-sion in whole blood.
In studies reported here, we explored the variation among apparently healthy blood bank donors in the expression of a set of genes involved in immune re-sponses. QRT-PCR was used to measure immune-related gene expression in whole blood samples, using procedures designed to sustain a high level of preci-sion (repeatability and reproducibility). We tested the observed distribution of values to determine if it was consistent with sampling from a log-normal distri-bution, as has been asserted for many genes (28,29), and computed maximum likelihood estimates for the parameters of this distribution. We used statistical models to estimate the contributions of gender, age, and ethnicity to the overall differences in expression among subjects. By performing replicate measurements on longitudinal samples from a group of 8 donors, we computed relative propor-tions of variance arising from technical, temporal, and intersubject variability. Finally, to obtain limits for the dynamic range of expression achievable with a strong inflammatory stimulus, we per-formed time-course measurements for several immune response genes in a group of healthy volunteers challenged with an infusion of the bacterial endo-toxin lipopolysaccharide (LPS).
MATERIALS AND METHODS
Donor Selection
Single-time-point blood samples from 131 blood donors satisfying American Red Cross blood bank standards (30) were obtained from 3 individual donor centers operated by Bonfils Blood Center, Denver, CO, USA. The samples were drawn on 3 different days over a 3-month period. Subject ages ranged from 22 to 69 years, with a median age of 44 years; age was not recorded for 61 sub-jects. Women (n= 64) and men (n= 67) were represented in about equal num-bers. Ethnicity was reported as white/ non-Hispanic for 109 subjects, Hispanic for 19, African-American for 2, and Asian/Pacific Islander for 1. No subjects in this study showed overt signs of
dis-ease that would make them ineligible to donate blood under American Red Cross standards. Because we cannot rule out undetected disease in the subjects, how-ever, we refer to them as “apparently healthy” (18).
In addition, longitudinal samples were drawn from 8 volunteers (3 women, 5 men, age range 23 to 50 years) from the Denver area. Samples were collected from these donors approximately once per month for 6 to 8 months, yielding a total of 58 samples.
Samples from the blood donor subjects were collected under Western Institutional Review Board Study No. 20010324. The studies were also reviewed by the Lawrence Livermore National Laboratory Institutional Review Board. Written in-formed consent was obtained from all volunteers.
In a separate study, 6 healthy volun-teers were injected intravenously over 1 min with a single dose (30 units/kg) of Gram-negative bacterial LPS, accord-ing to an approved protocol at Guys Hospital, London, UK. Blood samples were drawn and assayed before the LPS injection (0 h) and 2 and 5 h after LPS in-jection. Additional blood samples from 3 of 6 subjects (adult male volunteers who signed an informed consent form) were drawn and assayed 21 h after LPS injection. Medical history, physical exam-ination, routine laboratory examexam-ination, and electrocardiogram were all normal. Subjects did not use any medication or have any significant illness within 8 weeks of the study.
Sample Handling, Purification of RNA, and Preparation of cDNA
were then frozen at –70 °C and batch-shipped on dry ice in compliance with International Air Transport Association (IATA) shipping regulations.
Total RNA from PAXgene Blood RNA samples was extracted within 30 days of collection using the PAXgene Blood RNA Kit (no. 762134; Qiagen). RNA samples were treated with RNase-free DNase I (no. 79254; Qiagen) for digestion of con-taminating genomic DNA, using manu-facturer-recommended protocols during the purification process. Purified RNA samples were placed at –80 °C for long-term storage.
First-strand cDNA was synthesized with random hexamer primers using TaqMan Reverse Transcription reagents (N808-0234; Applied Biosystems, Foster City, CA, USA). Approximately 250 ng RNA was added to a prepared reverse-transcription reagent mixture consist-ing of PCR Buffer II, 1×; MgCl2, 5.5 mM; random hexamers, 2.5 μM; dNTP blend, 2 mM; RNase inhibitor, 40 units; and MultiScribe Reverse Transcriptase, 125 units. Samples were incubated at ambi-ent temperature for 10 min with subse-quent incubation at 37 °C for 60 min. After the 37 °C incubation, samples were incubated at 90 °C for 10 min and immediately chilled on ice. Newly syn-thesized cDNA samples were then placed at –80 °C for storage. Prior to QRT-PCR analysis, each cDNA sample was quality control tested for RNA quantity and quality of target genes using quantitative PCR analysis (QPCR; ABI Prism 7700 Sequence Detection System, Applied Biosystems, Foster City, CA, USA) of the 18S rRNA and β-actin.
QRT-PCR Analysis of Target Genes Primer/probe reagents were custom-designed to achieve 3 performance crite-ria: (1) single-gene specificity of amplifi-cation as tested by gel electrophoresis, (2) dilutional linearity of amplification performance over 2 orders of magnitude, and (3) optimal amplification efficiency of 100 ± 6%, to yield a 2-fold change in transcript per CTunit (31). Primer/probe
sets were designed to span 90 to 120 base pairs, optimized for robust amplification and specificity, minimization of second-ary hybridization, and consistent per-formance. Quality control testing of reagents and manufactured plates en-sured that amplification specificity and efficiency remained within established metrics during storage and new synthe-sis of nucleotides.
Amplification specificity was tested by QRT-PCR with a custom cDNA standard template of induced whole blood and cell lines. Specificity was determined by the size, number, and DNA sequence of the amplified product. The size and number of amplified products was deter-mined by agarose gel electrophoresis. Amplified products were electrophoresed on a 4% agarose gel to visualize the number of DNA bands present. The mo-lecular weight of each band was deter-mined by comparison to known molecu-lar weight markers (no. PR-G1741; Fisher Scientific, Hampton, NH, USA). The presence of a single DNA band of the correct size suggested specific amplifica-tion of the intended gene sequence. In certain cases, the amplified product DNA sequence was compared with the published sequence. Primer/probe am-plification of genomic DNA was inves-tigated using purified genomic DNA rather than cDNA as the template for QRT-PCR. The formation of primer dimers and spurious amplification was also investigated using DEPC water as a “no template” control for the QRT-PCR assay.
Amplification efficiency of a primer/ probe set was determined by a dilutional linearity assay, using 5 serial dilutions of the standard cDNA template and running PCR reactions on each dilution in replicates of 4. Two or more versions of each target gene primer/probe set were designed and tested to select for both amplification efficiency and speci-ficity. Similarly, each new primer/probe reagent lot was monitored to ensure matched amplification specificity and efficiency to previous primer/probe reagent lots.
Target gene transcripts were analyzed by QRT-PCR for each cDNA preparation using 2×TaqMan Universal PCR Master Mix (no. 4305719; Applied Biosystems) and Source MDx’s proprietary primer-probe sets. Reactions were run in sets of 4 replicates per gene (24 gene targets in a 96-well plate) on an ABI Prism 7700 Sequence Detection System. Each well also contained the specific primers and probe set to measure 18S rRNA as an in-ternal control. The amount of cDNA tem-plate added to each reaction was held to a relatively narrow range, as determined by the cDNA quality control measure-ment of 18S RNA.
Data Analysis
The difference between the fluorescence CTfor the target gene and the endogenous control (18S rRNA) is presented as a ΔCT value (CTof target – CTof control]. For reference, a ΔCTof 2 is approximately equivalent to a 4-fold change in the amount of the transcript. For example, at baseline, TGFβmay have a ΔCTvalue of 16; after treatment, that ΔCTvalue may increase to 18. This change represents a 2 ΔCTdifference or a decrease of 75% (1/4). The CTreporting system and esti-mation of relative gene expression are well described in the literature (32).
CTvalues above 37 were not used in the analysis, because they correspond to gene expression levels below the linear range of the assay. Values over this threshold were obtained for varying pro-portions of samples, depending on the gene and the study population exam-ined. For the single-time-point samples, the mean and SD of the underlying ΔCT distribution were inferred by maximum likelihood estimation (MLE), under the assumption of a normal distribution, for genes having up to 50% of their CT val-ues over the threshold. Distribution pa-rameters and dynamic ranges were not computed for genes with more than 50% of CTvalues greater than 37.
Tests for Normality
Because ΔCTvalues are roughly pro-portional to the logarithm of the
sponding mRNA abundances, we used a combination of analytical methods to test ΔCTvalues for each gene for departures from normality.
The Anderson-Darling and Shapiro-Wilk tests were used to test the data against the null hypothesis that the ob-served values were sampled from a nor-mal distribution, parameterized by the observed mean and standard error. These tests differ in their sensitivity to outliers and in the weight given to cen-tral versus outlying values. Smaller P
values from these tests indicate rejection of the null hypothesis, i.e., deviation from normality.
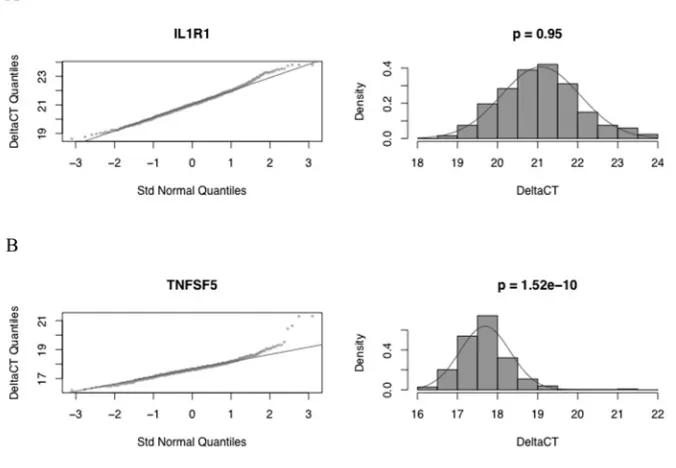
We also generated plots of the quan-tiles of each gene’s ΔCTvalues against the corresponding quantiles of a stan-dard normal distribution (Q-Q normal plots), together with histograms and nor-mal density curves, to graphically char-acterize their deviations from normality.
Linear Mixed-Effect Model Analysis Previous reports on longitudinal gene expression data sets (16,19) suggest that, for many genes, expression levels in re-peated samples from the same subject are relatively stable compared with interindi-vidual differences, even when the repeat samples are separated by time periods of several weeks. To quantify the relative magnitudes of intersubject versus tempo-ral and technical variability in apparently healthy, untreated subjects, we fitted a linear mixed-effects (LME) model to the longitudinal study data. In this data set, each ΔCTmeasurement was associated with a gene g, subject i, sample index j, and replicate k. An LME model for these data is described by equation 1:
(ΔCT)gijk= αg+ ugi+ βgj+ vgij+ εgijk (1)
where αgis an intercept term dependent on the gene only, ugiis a random effect due to intersubject variability, βgjis a fixed effect due to systematic variations in processing affecting all samples drawn at the same time point, vgijis a random effect representing variability among samples from the same subject, and εgijk is an error term encompassing all
resid-ual sources of variability between repli-cates. The random effects ugi, vgij, and εgijk
are assumed to be normally distributed with mean zero and variances σ2S, σ2
T, and σ2
R,respectively. A restricted maxi-mum likelihood (REML) algorithm (33) was used to fit the model parameters αg,
βgj, σ
2 S, σ
2 T, and σ
2
Rto the data.
In addition, it is useful to quantify the contributions to intersubject variability arising from subject characteristics such as sex, age, and ethnicity. All 3 of these parameters were recorded for 68 sub-jects in the single-time-point study. Expression data for these subjects was fitted to the LME model described by equation 2:
(ΔCT)gik= αg+ βg(Gi, Ei)+
ζg(Gi, Ei)Ai+ ugi+ εgik (2)
where αgis an intercept term dependent on the gene only, Gi, Ai, and Eiare the sex, age, and ethnicity of subject i, βg(G,E) is a gene-specific offset for the
given sex and ethnicity, ζg(G,E) is the slope of a linear age effect depending on both sex and ethnicity, ugiis a ran-dom effect due to intersubject variabil-ity not explained by age, sex, or ethnic-ity, and εgikis an error term
encom-passing all residual sources of variabil-ity between replicate PCR reactions for a given sample. After fitting this model, the percentage contribution of sex, age, and ethnicity effects to the intersubject variance for gene gwas estimated by equation 3:
(PC)g= 100/(1 + σ2
S/∑ik(((predicted
ΔCT)gik– (mean ΔCT)g)2)/(N – 1)) (3) where Nis the total number of measure-ments for gene g, σ2
Sis the variance pa-rameter estimated for the distribution of the random subject effects, predicted ΔCT is the value predicted from the fixed ef-fects portion of equation 2, and mean ΔCTis computed over all measurements for gene g.
All data analyses were performed using the R open source programming environment for statistical computation (34). LME models were programmed using the R package “nlme” (33).
RESULTS
Most Genes Exhibit Limited Dynamic Range of Expression Across Subjects in Single-Time-Point Measurements
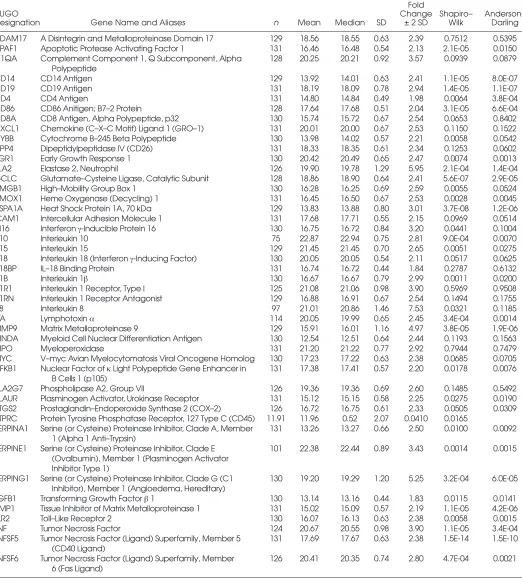
A series of studies were undertaken to examine the expression of immune-related gene transcripts in whole blood of apparently healthy subjects. In the largest single-time-point study, blood was collected from 131 blood donors fol-lowing the American Red Cross donor standards and analyzed for the expres-sion of 48 inflammation- and immune-related gene transcripts. These tran-scripts encode cell surface molecules, such as CD4, CD14, CD19, and ICAM-1; signaling molecules, such as PTGS2 (COX2), PLA2G7, and NF-κB; cytokines, such as IL-1B and TGFβ; proteinases, such as ELA2; and proteinase inhibitors (see Table 1). The overall range of CT val-ues for the 48 genes studied is plotted in Figure 1. The bars in the plot encompass the central 90% of the observed values (i.e., they extend from the 5th to the 95th percentiles), whereas the whiskers on ei-ther end of the bar extend to the extreme values. For genes with expression levels sampled from a log-normal distribution, the ends of the bars would correspond to 1.64 SD on either side of the mean CT.
M O L M E D 1 2 ( 7 - 8 ) 1 8 5 - 1 9 5 , J U L Y - A U G U S T 2 0 0 6 | M C L O U G H L I N E T A L . | 1 8 9 Table 1.Genes with detectable expression in healthy blood donor samples, together with statistical summaries of ΔCTdistribution,
expression fold changes corresponding to 2 standard deviations of ΔCTdistribution, and P values for normality tests. Fold
HUGO Change Shapiro– Anderson–
Designation Gene Name and Aliases n Mean Median SD ± 2 SD Wilk Darling
ADAM17 A Disintegrin and Metalloproteinase Domain 17 129 18.56 18.55 0.63 2.39 0.7512 0.5395 APAF1 Apoptotic Protease Activating Factor 1 131 16.46 16.48 0.54 2.13 2.1E-05 0.0150 C1QA Complement Component 1, Q Subcomponent, Alpha 128 20.25 20.21 0.92 3.57 0.0939 0.0879
Polypeptide
CD14 CD14 Antigen 129 13.92 14.01 0.63 2.41 1.1E-05 8.0E-07
CD19 CD19 Antigen 131 18.19 18.09 0.78 2.94 1.4E-05 1.1E-07
CD4 CD4 Antigen 131 14.80 14.84 0.49 1.98 0.0064 3.8E-04
CD86 CD86 Anitigen; B7–2 Protein 128 17.64 17.68 0.51 2.04 3.1E-05 6.6E-04
CD8A CD8 Antigen, Alpha Polypeptide, p32 130 15.74 15.72 0.67 2.54 0.0653 0.8402 CXCL1 Chemokine (C–X–C Motif) Ligand 1 (GRO–1) 131 20.01 20.00 0.67 2.53 0.1150 0.1522 CYBB Cytochrome B–245 Beta Polypeptide 130 13.98 14.02 0.57 2.21 0.0058 0.0542
DPP4 Dipeptidylpeptidase IV (CD26) 131 18.33 18.35 0.61 2.34 0.1253 0.0602
EGR1 Early Growth Response 1 130 20.42 20.49 0.65 2.47 0.0074 0.0013
ELA2 Elastase 2, Neutrophil 126 19.90 19.78 1.29 5.95 2.1E-04 1.4E-04
GCLC Glutamate–Cysteine Ligase, Catalytic Subunit 128 18.86 18.90 0.64 2.41 5.6E-07 2.9E-05
HMGB1 High–Mobility Group Box 1 130 16.28 16.25 0.69 2.59 0.0055 0.0524
HMOX1 Heme Oxygenase (Decycling) 1 131 16.45 16.50 0.67 2.53 0.0028 0.0045 HSPA1A Heat Shock Protein 1A, 70 kDa 129 13.83 13.88 0.80 3.01 3.7E-08 1.2E-06 ICAM1 Intercellular Adhesion Molecule 1 131 17.68 17.71 0.55 2.15 0.0969 0.0514 IFI16 Interferon γ-Inducible Protein 16 130 16.75 16.72 0.84 3.20 0.0441 0.1004
IL10 Interleukin 10 75 22.87 22.94 0.75 2.81 9.0E-04 0.0070
IL15 Interleukin 15 129 21.45 21.45 0.70 2.65 0.0051 0.0275
IL18 Interleukin 18 (Interferon γ-Inducing Factor) 130 20.05 20.05 0.54 2.11 0.0517 0.0625
IL18BP IL–18 Binding Protein 131 16.74 16.72 0.44 1.84 0.2787 0.6132
IL1B Interleukin 1β 130 16.67 16.67 0.79 2.99 0.0011 0.0200
IL1R1 Interleukin 1 Receptor, Type I 125 21.08 21.06 0.98 3.90 0.5969 0.9508 IL1RN Interleukin 1 Receptor Antagonist 129 16.88 16.91 0.67 2.54 0.1494 0.1755
IL8 Interleukin 8 97 21.01 20.86 1.46 7.53 0.0321 0.1185
LTA Lymphotoxin α 114 20.05 19.99 0.65 2.45 3.4E-04 0.0014
MMP9 Matrix Metalloproteinase 9 129 15.91 16.01 1.16 4.97 3.8E-05 1.9E-06
MNDA Myeloid Cell Nuclear Differentiation Antigen 130 12.54 12.51 0.64 2.44 0.1193 0.1563
MPO Myeloperoxidase 131 21.20 21.22 0.77 2.92 0.7944 0.7479
MYC V–myc Avian Myelocytomatosis Viral Oncogene Homolog 130 17.23 17.22 0.63 2.38 0.0685 0.0705 NFKB1 Nuclear Factor of κLight Polypeptide Gene Enhancer in 131 17.38 17.41 0.57 2.20 0.0178 0.0076
B Cells 1 (p105)
PLA2G7 Phospholipase A2, Group VII 126 19.36 19.36 0.69 2.60 0.1485 0.5492
PLAUR Plasminogen Activator, Urokinase Receptor 131 15.12 15.15 0.58 2.25 0.0275 0.0190 PTGS2 Prostaglandin–Endoperoxide Synthase 2 (COX–2) 126 16.72 16.75 0.61 2.33 0.0505 0.0309 PTPRC Protein Tyrosine Phosphatase Receptor, 127 Type C (CD45) 11.91 11.96 0.52 2.07 0.0410 0.0165
SERPINA1 Serine (or Cysteine) Proteinase Inhibitor, Clade A, Member 131 13.26 13.27 0.66 2.50 0.0100 0.0092 1 (Alpha 1 Anti–Trypsin)
SERPINE1 Serine (or Cysteine) Proteinase Inhibitor, Clade E 101 22.38 22.44 0.89 3.43 0.0014 0.0015 (Ovalbumin), Member 1 (Plasminogen Activator
Inhibitor Type 1)
SERPING1 Serine (or Cysteine) Proteinase Inhibitor, Clade G (C1 130 19.20 19.29 1.20 5.25 3.2E-04 6.0E-05 Inhibitor), Member 1 (Angioedema, Hereditary)
TGFB1 Transforming Growth Factor β1 130 13.14 13.16 0.44 1.83 0.0115 0.0141 TIMP1 Tissue Inhibitor of Matrix Metalloproteinase 1 131 15.02 15.09 0.57 2.19 1.1E-05 4.2E-06
TLR2 Toll–Like Receptor 2 130 16.07 16.13 0.63 2.38 0.0058 0.0015
TNF Tumor Necrosis Factor 124 20.67 20.55 0.98 3.90 1.1E-05 3.4E-04
TNFSF5 Tumor Necrosis Factor (Ligand) Superfamily, Member 5 131 17.69 17.67 0.63 2.38 1.5E-14 1.5E-10 (CD40 Ligand)
TNFSF6 Tumor Necrosis Factor (Ligand) Superfamily, Member 126 20.41 20.35 0.74 2.80 4.7E-04 0.0021 6 (Fas Ligand)
units for IL-8. The SDs of ΔCTvalues were independent of the mean ΔCT, indi-cating that the dynamic ranges did not depend on a gene’s expression level.
The Majority of Genes Have Expression Values following Log-Normal
Distributions
Commonly used parametric tests for differential gene expression between
groups of samples, such as ttests and analysis of variance, are based partly on the assumption that the values being compared are sampled from normal dis-tributions. Although it is commonly as-serted that transcription levels of many genes are log-normally distributed (28,29), it is important to test this as-sumption to use such tests for disease diagnosis and detection. The majority
of expressed transcripts followed ap-proximately log-normal distributions, according to the Anderson-Darling and Shapiro-Wilk tests (Table 1, Figure 3). The gene most closely following a nor-mal distribution of ΔCTvalues was IL1R1 (Figure 3A), with an Anderson-Darling Pvalue of 0.945. Among the 46 genes tested, 34 had Pvalues greater than 0.001. All genes had unimodal dis-tributions; the deviations from normal-ity involved moderate degrees of left or right skewness, and/or heavy or light tails. Although these departures were not dramatic, they will need to be incor-porated into the predicted error rates for diagnostic tests based on expression of these genes.
Of the 48 genes shown in Table 1, the gene deviating most from a normal distribution of ΔCTvalues was TNFSF5 (CD40 ligand, Figure 3B), with an Anderson-Darling Pvalue of 1.52 ×10⁻¹⁰. The observed distribution is character-ized by a heavy tail and large ΔCT, sug-gesting the presence of a subpopulation with an unusually low expression level of this gene.
R U N N I N G H E A D
Figure 2.Histogram of dynamic ranges of expression values, expressed as fold changes spanning 2 standard deviations of each gene’s ΔCTvalues (that is, 2–2SD(ΔC
T)).
Minor Variations in Expression May Be Based on Sex, Ethnicity, and Age
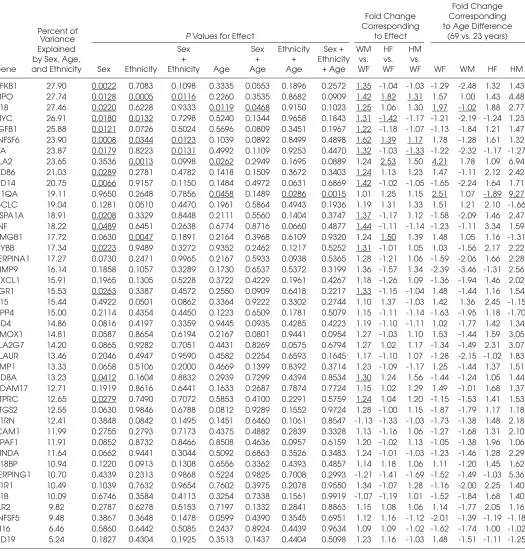
Table 2 shows the contributions of sex, age, and ethnicity on interindividual vari-ation estimated by the LME model (equa-tion 2). For the 43 genes examined, the observed effects of sex, ethnicity, and age were small. Only 10 genes had contribu-tions from these effects, explaining more than 20% of the intersubject variance; the maximum contribution was only 27.9% for NFKB1. For most genes, sex effects accounted for most of this contribution. Fifteen genes showed significant sex dif-ferences (unadjusted Pvalue < 0.05), but the largest fold change from women to men was only 1.62 for TNFSF6. Likewise, only moderate ethnicity effects were ob-served. Five genes (MPO, MYC, TNFSF6, ELA2, and HMGB1) showed significant differential expression between white (non-Hispanic) and Hispanic subjects, with the largest change being a 2.5-fold overexpression of ELA2 in Hispanic women relative to white women.
Age effects were difficult to measure in this data set, due to the markedly different age distributions between the female and male blood donors. Male blood donors had a median age of 53 years, compared with 43 years for females. Therefore, sex and age effects are potentially con-founded. The LME model defined in equation 2 addresses the confounding factors by fitting the ΔCTversus age data to different slopes for each sex/ethnicity combination. According to the LME model, 3 genes (IL18, ELA2, and C1QA) had significant age effects for at least 1 sex/ethnicity combination. For all 3 of these genes, the fitted slopes were mark-edly different between sexes. For example, age had virtually no effect on IL18 expres-sion in white men, whereas in white women the slope corresponded to a 2-fold increase from age 23 to age 69. Similarly, the fitted slopes suggest dramatic differ-ences in age effects among ethnicities. Overall, the size of the sample is too small to reliably estimate ethnic differences.
Variation of Expression within Subjects Over Time Is Limited
To compare the contributions of in-tersubject, temporal, and technical components to the overall variation in gene expression, we fitted the LME model (equation 1) to the longitudinal set of measurements described in “Materials and Methods.” For this data set, we fitted the model for each of 29 genes with detectable expression in at least 90% of the samples to obtain, for each gene, a set of variance parameters σ2
S, σ 2
T, and σ 2
R. These are approxi-mate estiapproxi-mates of the contributions to the total variance from intersubject var-iation, variation among samples taken at different times from each subject, and residual variation between repli-cate reactions, respectively.
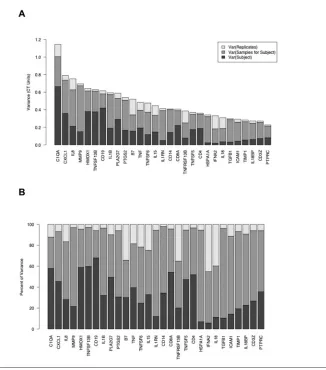
The results of the initial LME model analysis are summarized in Figure 4, which shows the fitted standard error parameters σ2S, σ
2
T, and σ
2
Rfor each gene. For 6 of the 29 genes examined (CD19, TNFSF13B, HMOX1, C1QA, CD8A, and CD4), intersubject variation comprised more than 50% of the total variance of ΔCTvalues. For the remain-ing 23 genes, variation between samples taken at different times was the largest component. However, the magnitude of the temporal variation was limited; the parameter σTranged from 0.36 ΔCTunits for the gene PTPRC to 0.72 ΔCTunits for MMP9. The dynamic ranges correspon-ding to 2σTranged from 1.66- to 2.72-fold change units. Because measurements from samples taken over a period of 8 months may be subject to several sources of technical variation (for example, in-strument calibration, reagent lots, and variations in sample handling), these ranges can be considered upper limits on the true temporal variation of expres-sion for the genes analyzed.
LPS Stimulation Induces Transient Gene Expression Changes in Excess of Natural Variation
To demonstrate that changes marked beyond the normal reference range occur, gene expression was measured in blood
M O L M E D 1 2 ( 7 - 8 ) 1 8 5 - 1 9 5 , J U L Y - A U G U S T 2 0 0 6 | M C L O U G H L I N E T A L . | 1 9 1 Figure 3.Q-Q normal plots and histograms of ΔCTvalues for the genes deviating least
R U N N I N G H E A D
Table 2.Sex, age, and ethnicity (fixed effect) contributions to intersubject variation for 43 genes, in decreasing order of percentage of variance explained (equation 3).
Fold Change Fold Change Corresponding
Percent of Corresponding to Age Difference
Variance P Values for Effect to Effect (69 vs. 23 years)
Explained Sex Sex Ethnicity Sex + WM HF HM
by Sex, Age, + + + Ethnicity vs. vs. vs.
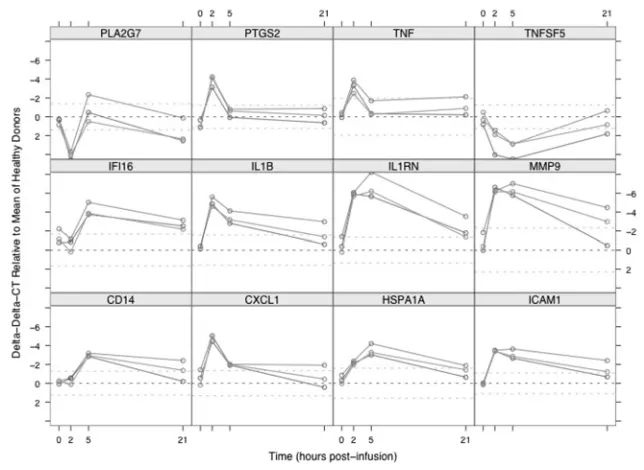
collected from healthy subjects injected with LPS. Healthy subjects who receive an injection of LPS experience mild fever and flu-like symptoms that subside within 24 h (35). Figure 5 shows the ex-pression of a subset of genes with signifi-cant changes at any time point after LPS injection. Reference ranges (mean ± 2 SD) for healthy subjects are indicated by dashed lines. The plotted ΔΔCTvalues are computed relative to the mean ΔCT for the apparently healthy blood donors. Individual time courses are shown for each subject. Twenty-seven genes had significant changes in expression in LPS-injected subjects at any time postinfusion
relative to apparently healthy blood donors, with adjusted false discovery rates of less than 5%. Each of these genes had pre-injection expression levels within the normal reference range for appar-ently healthy blood donors; each showed increased or decreased expression at 2 and/or 5 h postinfusion; and most re-turned to the normal expression range by 21 h after infusion. Fifteen genes in-creased or dein-creased expression by a factor greater than 10-fold, and 2 (MMP9 and IL1RN) increased more than 90-fold (Figure 5). Because the innate immune system’s immediate response to LPS in-fusion is the production of inflammatory
mediators by monocytes, it is not sur-prising that the genes showing substan-tial increases in expression include cy-tokines and chemokines associated with the monocyte/macrophage lineage, such as TNF, IL1B, CXCL1, and IL18. Key cell-surface markers (ICAM1, CD14) and sig-naling molecules (PTGS2/COX-2) also re-spond. Interestingly, the anti-inflammatory regulator IL1RN, which blocks the bind-ing of IL1 to its receptor, was 1 of the 2 most overexpressed genes. This fits with the premise that inflammatory processes are tightly regulated by coordinated ex-pression of pro-inflammatory and anti-inflammatory factors. These include genes with significant decreases in ex-pression such as PLA2G7 and TNFSF5 (CD40 ligand) (see Figure 5).
DISCUSSION
The studies reported here are an initial step toward establishing normal refer-ence ranges for the expression of genes related to inflammation and immunity. Several key observations emerged. First, the dynamic range of expression of most immune response genes is relatively lim-ited among apparently healthy subjects. Second, expression levels for most genes analyzed are approximately log-normally distributed. Third, individuals exposed to bacterial endotoxin have gene expres-sion profiles that are easily (albeit tran-siently) distinguished from those of an apparently healthy population. In devel-oping the methods for these studies, it was also observed that multiple technical factors, including sample handling pro-cedures, PCR reagents, and instrument calibration, contribute to the overall variation, which must be carefully con-trolled. Taken together, these observa-tions support both the usefulness and practicality of establishing normal refer-ence ranges for gene expression assays related to immune system function.
A variety of biological factors may contribute to the variation of expression observed in apparently healthy subjects (18). In general, these factors can be di-vided into intrinsic (for example, age, sex, genetics) and extrinsic (for example,
M O L M E D 1 2 ( 7 - 8 ) 1 8 5 - 1 9 5 , J U L Y - A U G U S T 2 0 0 6 | M C L O U G H L I N E T A L . | 1 9 3 Figure 4.Source of variance in gene expression. (A) Variance components estimated from
inflammatory, autoimmune disease, cancer, infections, and metabolism) fac-tors. The apparently healthy blood donor population studied here may have in-cluded individuals with subacute ill-nesses or chronic conditions that con-tributed to the variability in expression of some immune response genes. Many chronic inflammatory and atopic dis-eases, such as arthritis, asthma, ulcers, gastritis, and allergies, are highly preva-lent in the U.S. adult population, with frequencies ranging from 7% to 27% (36). Nonetheless, individuals with these con-ditions are deemed “healthy” and per-mitted to donate blood, provided these “chronic conditions are bring treated and the condition is under control,” and they “feel well and are able to perform nor-mal activities” (30).
Atherosclerosis is another highly prev-alent condition which develops over sev-eral years and is asymptomatic in its early or even late stages. Several studies have demonstrated an elevation of C-reactive protein and other markers of inflamma-tion in early stages of cardiovascular
disease (37,38). Chronic infections with viruses (cytomegalovirus, Epstein-Barr virus, genital herpes, and human papillo-mavirus), bacteria (Helicobacter pylori), and protozoans (Toxoplasma gondii) also are common in the U.S. population, but do not consistently produce symptoms in immunocompetent persons. Periodic re-activation and suppression of these infec-tions may account for some of the back-ground variation in immune response gene expression. Dietary influences on immune system gene expression may include consumption of omega-3 fatty acids, arginine, and other nutrients as well as vegetarian diets (39,40).
Age, sex, and ethnicity also may con-tribute to the intersubject variation ob-served for several transcripts. However, the contributions of these factors ap-peared to be modest in the present study. Variations associated with age and sex have been previously reported (18,41,42), with some sex differences being directly attributable to differences in sex chromo-somes (18). Several studies (18,42) have observed individual differences in
inter-feron-responsive genes among individu-als, suggesting further stratification in an apparently normal healthy subject group. Larger studies specifically targeting some of these factors are needed to elucidate the effects so that populations can be stratified for more precise diagnostic resolution.
Intrinsic and extrinsic factors can also alter the proportions of blood cell types such as neutrophils, monocytes, and lymphocytes, as well as the relative ex-pression of individual transcripts within each cell type. These effects combine to produce the observed variation in tran-script abundances in whole blood. The individual contributions of cell popula-tions and gene regulation within cell types could be examined using flow cy-tometry combined with QRT-PCR, and deserve further study.
Given the variety of factors that can affect the expression of immune response genes in a blood donor population, it is remarkable that the overall dynamic range of expression is not wider than observed in the present study, whereas larger, up to 90-fold, but transient changes can be induced by the severe acute inflammatory stimulus LPS. In other diseases, such as rheumatoid arthritis and lupus, differences in gene expression from apparently healthy nor-mals are more modest, 2- to 5-fold (43). These observations support the view that expression of these genes is maintained within limits by regulatory mechanisms, possibly to reduce the danger of tissue damage from constant activation of im-mune responses, while allowing appro-priate responses to infectious threats. The limited dynamic range observed supports the development of expression-based diagnostics, allowing expression outside the normal reference range to in-dicate the presence of infections, cancer, or indolent autoimmune diseases.
Molecular diagnostics, including those based on gene expression, are increas-ingly being applied in the clinic (44,45). These tests have improved the selection of therapies, as well as dosage and treatment schedule. In addition, “treat-to-normal” strategies are routinely used in major R U N N I N G H E A D
Figure 5.Time course of expression for 12 genes with significant responses to LPS infusion in 3 healthy male subjects. Whole blood was sampled at pre-LPS (0 h) and 2, 5 and 21 h post-LPS infusion. Gene expression is plotted as ΔCTvalues relative to mean ΔCTfor
healthy blood donors, with points and lines colored by subject. Mean and mean ± 2 SD are indicated by horizontal dashed lines. ΔCTscale is inverted, so upward direction
diseases such as hypertension and dia-betes. Assays based on precise, quantita-tive measurements of immune system gene expression offer the promise of ef-fective clinical monitors in infection, au-toimmune diseases, and other immune-related conditions, such as transplant rejection and drug- or virus-induced im-munosuppression, as well as cancer. A better understanding of the relevant fac-tors that contribute to the individuality of gene expression in the human will help to establish the most appropriate normal reference values in the clinic and will serve as an essential step in the de-velopment of effective molecular diag-nostics for these and other inflammatory and immunologic diseases.
ACKNOWLEDGMENTS
The authors would like to thank C. Edwards, C. Dinarello, A. Rasley, D. Nelson, M. Ascher, and C.T. Rigl for helpful comments, review, and discussion. This work was performed under the aus-pices of the Lawrence Livermore National Laboratory and was supported with funds from the Laboratory Directed Research and Development (LDRD) Program.
REFERENCES
1. Bild AH et al. (2006) Oncogenic pathway signa-tures in human cancers as a guide to targeted therapies. Nature439:274-5.
2. Gladkevich A, Nelemans SA, Kauffman HF, Korf J. (2005) Microarray profiling of lymphocytes in in-ternal diseases with an altered immune response: potential and methodology. Mediators Inflamm. 2005:317-30.
3. Han D, Leith J, Alejandro R, Bolton W, Ricordi C, Kenyon NS. (2005) Peripheral blood cytotoxic lymphocyte gene transcript levels differ in pa-tients with long-term type 1 diabetes compared to normal controls. Cell Transplant.14:403-9. 4. Perez EA, Pusztai L, Van de Vijver M. (2004)
Improving patient care through molecular diag-nostics. Semin. Oncol.31(5 Suppl 10):14-20. 5. Baechler EC et al. (2003) Interferon-inducible
gene expression signature in peripheral blood cells of patients with severe lupus. Proc. Natl. Acad. Sci. U. S. A.100:2610-5.
6. Rus V, Chen H, Zernetkina V, Magder LS, Mathai S, Hochberg MC, Via CS. (2004) Gene expression profiling in peripheral blood mononuclear cells from lupus patients with active and inactive dis-ease. Clin. Immunol.112:231-4.
7. Chen X et al. (2002) Gene expression patterns in human liver cancers. Mol. Biol. Cell13:1929-39. 8. Gang J et al. (2005) Discovery and analysis of
pancreatic adenocarcinoma genes using DNA microarrays. World J. Gastroenterol.11:6543-8. 9. Chang JC et al. (2003) Gene expression profiling for
the prediction of therapeutic response to docetaxel in patients with breast cancer. Lancet362:362-9. 10. US patent no. 6,960,439: Identification, monitoring
and treatment of disease and characterization of biological condition using gene expression profiles, covering the use of a Healthy Normals Reference Dataset, issued to Source MDx, Nov. 4, 2005. 11. Stitt JT (1979) Fever versus hyperthermia.Fed.
Proc.38:39-43
12. Conti B, Tabarean I, Andrei C, Bartfai T. (2004) Cytokines and fever.Front. Biosci.9:1433-49. 13. Dinarello CA. (2004) Infection, fever, and
exoge-nous and endogeexoge-nous pyrogens: some concepts have changed.J. Endotoxin Res.10:201-22. 14. Jiang H, Chess L (2004) An integrated view of
suppressor T cell subsets in immunoregulation. J. Clin. Invest. 114:1198-1208.
15. Campbell C, Vernon SD, Karem KL, Nisenbaum R, Unger ER. (2002) Assessment of normal variabil-ity in peripheral blood gene expression. Dis. Markers18:201-6.
16. Chowers I, Liu D, Farkas RH, et al. (2003) Gene expression variation in the adult human retina. Hum. Mol. Genet.12:2881-93.
17. Cole J, Tsou R, Wallace K, Gibran N, Isik F. (2001) Comparison of normal human skin gene expres-sion using cDNA microarrays. Wound Repair Regen.9:77-85.
18. Whitney AR, Diehn M, Popper SJ, Alizadeh AA, Boldrick JC, Relman DA, Brown PO. (2003) Individuality and variation in gene ex-pression patterns in whole blood. Proc. Natl. Acad. Sci. U. S. A.100:1896-1901.
19. Cheung VG, Conlin LK, Weber TM, Arcaro M, Jen KY, Morley M, Spielman RS. (2003) Natural variation in human gene expression assessed in lymphoblastoid cells. Nat. Genet.33:422-5 20. Baechler EC, Batliwalla FM, Karypis G, et al.
(2004) Expression levels for many genes in human peripheral blood cells are highly sensitive to ex vivo incubation.Genes Immun.5:347-53. 21. Debey S, Schoenbeck U, Hellmich M, Gathof BS,
Pillai R, Zander T, Schultze JL. (2004) Comparison of different isolation techniques prior gene expres-sion profiling of blood derived cells: impact on physiological responses, on overall expression and the role of different cell types.Pharmacogenomics J 4:193-207.
22. Han ES, Wu Y, McCarter R, Nelson JF, Richardson A, Hilsenbeck SG (2004) Reproducibility, sources of variability, pooling and sample size: important considerations for the design of high-density oligonucleotide array experiments. J. Gerontol. A Biol. Sci. Med. Sci.59:306-15.
23. Rainen L, Oelmueller U, Jurgensen S, et al. (2002) Stabilization of mRNA expression in whole blood samples. Clin. Chem.48:1883-90. 24. Tan PK, Downey TJ, Spitznagel EL, et al. (2003)
Evaluation of gene expression measurements from commercial microarray platforms.Nucleic Acids Res.31:5676-84.
25. Snider JV, Wechser MA, Lossos IS. (2001) Human disease characterization: real-time quantitative PCR analysis of gene expression.Drug Discov. Today6:1062-7.
26. Liles WC, Van Voorhis WC. (1995). Nomenclature and biological significance of cytokines involved in inflammation and the host immune response. J. Infect. Dis.172:1573-80.
27 Joyce DA, Steer JH, Beilharz MW, Stranger R. (1995). A system for assessment of monokine gene expression using human whole blood. Genet. Anal. 12:39-43.
28. Inoue M, Nishimura S, Hori G, Nakahara H, Saitom M, Yoshihara Y, Amari S. (2004) Improved parameter estimation for variance-stabilizing transformation of gene-expression microarray data. J. Bioinform. Comput. Biol.2:669-79. 29. Naef F, Hacker CR, Patil N, Magnasco M. (2002)
Empirical characterization of the expression ratio noise structure in high-density oligonucleotide arrays. Genome Biol.3(4) Epub 2002 Mar 22 30. American Red Cross: www.redcross.org 31. Heid CA, Stevens J, Livak KJ, Williams PM (1996)
Real time quantitative PCR. Genome Res.6:986-94. 32. Livak KJ, Schmittgen TD. (2001) Analysis of relative gene expression data using real-time quantitative PCR and the 2-??CTmethod. Methods25:402-8. 33. Pinheiro J, Bates DM. (2000) Mixed-Effects Models
in S and S-PLUS. New York: Springer. 528 pp 34. R Development Core Team (2004) R Foundation
for Statistical Computing, Vienna, Austria. 35. Martich G, Boujoukos A, Suffredini A (1993)
Response of man to endotoxin. Immunobiology 187:403-16.
36. Schiller JS, Adams PF, Nelson ZC (2005) Summary health statistics for the US population: National health interview survey, 2003. Vital Health Stat. 10 Apr(224):1-104.
37. Koenig W et al. (1999) C-Reactive protein, a sensi-tive marker of inflammation, predicts future risk of coronary heart disease in initially healthy middle-aged men: results from the MONICA (Monitoring Trends and Determinants in Cardiovascular Disease) Augsburg Cohort Study, 1984 to 1992. Circulation99:237-42.
38. Pearson TA et al. (2003) Markers of inflammation and cardiovascular disease: application to clinical and public health practice: A statement for health-care professionals from the Centers for Disease Control and Prevention and the American Heart Association.Circulation107:499-511.
39. Bistrian BR. (2004) Practical recommendations for immune-enhancing diets.J. Nutr.134:2868S-72S. 40. Simopoulos AP. (2002) Omega-3 fatty acids in
inflammation and autoimmune diseases.J. Am. Coll. Nutr.21:495-505.
41. Eady J et al. (2005) Variation on gene expression profiles of peripheral blood mononuclear cells from healthy volunteers. Physiol. Genomics 22:402-11. 42. Radich J et al. (2004) Individual-specific variation
of gene expression in peripheral blood leukocytes. Genomics 83:980-8.
43. Tryon V et al. High-precision gene expression anal-ysis of rheumatoid arthritis and other inflamma-tory diseases. Int. Assoc. Inflammation Soc.Meeting Poster Presentation, Vancouver BC, August 2003. 44. Ross J et al. (2003) The HER-2/neu gene and
pro-tein in breast cancer 2003: biomarker and target of therapy. Oncologist8:307-25.
45. Madhusudan S, Ganesan TS (2004) Tyrosine kinase inhibitors in cancer therapy. Clin. Biochem.37:618-35.