5123
DATA MINING FOR BOX COMPRESSION TEST
RESULTS CLASSIFICATION USING DECISION
TREE METHODS
Dimas Purnomo Aji, Muhammad Iqbal Dzulhaq, Nova Teguh Sunggono
Abstract— Data Mining is one of the centers of attention for academics and practitioners. Various data mining research and development have produced many products that are useful for the wider community and business people. In terms of determining the results of laboratory tests such as box compression tests, of course, it will produce a lot of data and data that requires the right method to be an alternative in product testing. The purpose of this study was to develop a box compression test system using a web-based decision tree method instead of product quality testing equipment. One method in data mining is decision tree with the algorithm C4.5. The results of the calculation with confusion matrix, it can be seen that the accuracy value of 87%, the value of precision 85.2%, and the recall value of 95%, it can be seen that the classification of BCT results with the C4.5 algorithm is included in the category of fair classification.
Index Terms— Data Mining, Decision Tree, Algorithm C4.5, Box Compression Test, Clasification, Confusion Matrix, Result
—————————— ——————————
1.
INTRODUCTION
Companies engaged in industry with products such as packaging need a system to maintain product quality because of the increasing competition. To maintain the quality of the products produced, a product must go through the testing stage before the process of sending to the customer. One of the product testing stages here is the Box Compression Test (BCT). This will certainly produce so much testing data.The availability of abundant data and information needs as decision makers to make business solutions and support infrastructure in the field of information technology is the forerunner of the birth of data mining [1] technology. By using data mining, it is hoped that it can help the effectiveness of the production of the company that influences the efficiency of time, energy, and costs.Data mining is the process of finding patterns [2] or interesting information in selected data using a particular technique or method. Techniques or methods in data mining vary greatly. The choice of the right method is very dependent on the overall purpose and process of Knowledge Discovery in Database (KDD). In data mining there are several processes, one of which is classification. Decision is a reaction to several alternative solutions that are done consciously by analyzing the possibilities of these alternatives along with their consequences [3].One method used in data mining is the decision tree with the commonly used algorithm C4.5. Decision tree [5][6] is a flow chart like a tree structure, where each. internal node shows a test on an attribute, each branch shows the results of a test, and leaf nodes show classes or class distribution.This paper proposes a box compression [7] test testing approach using decission trees to improve the efficiency of time, energy and costs in a production
______________________
STMIK Bina Sarana Global, Jl. Aria Santika No.38,
RT.003/RW.003, Margasari, Kec. Karawaci, Kota Tangerang,
Banten 15114 1[email protected],
2[email protected] ,3[email protected]
2
RELATED
WORK
Data mining [8] is a step in process (KDD), a new technology that is very useful to help companies find very important information from their data warehouse. Data mining can answer business questions that require a lot of time to answer them in the traditional way. Data mining explores the database to find hidden patterns and look for information that might be forgotten by business people because it lies outside their expectations. with statistical techniques, mathematical sciences, Artificial Intelligence and machine learning [9] to extract information and identify it to be useful information from a company database.The algorithm proposed in this study is using the C4.5 algorithm. The C4.5 [10][11] algorithm is an extension of algorithm ID3 and uses a similar decision tree principle. This algorithm is very well known and liked because it has many advantages. These advantages, for example, can process numerical and discrete data, can handle missing attribute values, produce rules that are easily interpreted and their performance is one of the fastest compared to other algorithmsIn the current system, the BCT test takes 10 to 15 minutes by sampling 5 pcs for each work order item that is running in production. While in one day the company can produce as many as 45 to 50 work orders that have a BCT test request. This of course will have a queue and take a long time.
3
THEORITICAL
BACKGROUND
A. C4.5 Algorithm
The ways to build decisions in the C4.5 algorithm are as follows :
a. Select the attribute as root. b. Create branches for each value. c. For cases in branches.
d. Repeat the process for each branch until all the cases in the branch have the same class.
To choose an attribute as root, it is based on the highest gain value of the existing attributes. To calculate the entropy [12] and gain the formula is used as follows :
Information : S : Case Set
n : Number of partitions S
5124 Information :
S : Case Set
n : Number of partitions A
|Si| : Number of cases on partition to-i
|S| : Number of partitions S
In this study, data mining is used to classify box compression test results using 6 attributes obtained based on primary data, namely thickness (1), number of colors (2), moisture (3), ect (4), supplier (5), and type box (6) and 2 outputs namely OK (1) and NG (2).
B. Box Compression Test (BCT)
Box Compression Test (BCT) is the amount of load needed to press the box until it changes shape and is measured in standard conditions. Corrugated boxes must meet BCT value standards to support the use of the box. The most important requirements of the corrugated box [13] as packaging are containability and stacking strength.
a. BCT is needed to determine how much maximum compressive power can be given so that the box does not get damaged. In this case the stacking or stack maximum time for storing goods packed with boxes must pay attention to the size of the BCT.
b. The current box compression test testing procedures are as follows:
c. Inline inspector brings 5 pcs of boxes in production process to be tested in the lab.
d. Box is tested using a BCT engine by the Head of Team / Supervisor. If the results are OK, the production process can continue. But if the result is NG (not good), then the production process for the item must be pending.
e. The results of the test are given to the Head of Section to be known and signed.
f. Data from several items that have been tested and signed are then archived by the admin for audit and documentation purposes.
4.
EXPERIMENTAL
The method proposed to classify the results of the box compression test is to use the decision tree method or decision tree. Decision tree is a method of classification and prediction that has proven to be powerful and very well known. This method serves to convert facts into decision trees that represent rules that can be easily understood with natural language. The process of this decision tree starts from the root node until the leaf node is done recursively where each branch states the condition and each end of the tree will state the decision.Decision tree architecture is made in such a way as to resemble an original tree, where there are several parts, namely :
Figure 1. Example of a Decision Tree .
The system design proposed in this study discusses the process of mining data in six methods using the CRISP-DM method. This process is one that supports finding interesting and interesting patterns in data and also involves several scientific disciplines such as statistics, machine learning, artificial intelligence, and data mining.
A. Business Understanding
Business understanding refers to the BCT testing determined by the research site, PT Satyamitra Kemas Lestari. At this stage, an understanding of the background and objectives of business processes related to BCT testing is needed to produce quality products and gain the trust and satisfaction of customers. The first thing to do is to set a goal on a running system that takes 10 to 15 minutes by sampling 5 pcs for each work order item that is running in production. While in one day at PT. Satyamitra Kemas Lestari can produce as many as 45 to 50 work orders that have a BCT test request. This of course will have a queue and take a long time. Test data for 400 data. From the data, it consists of 14 attributes and 1 target attribute. And the data will go through the cleaning stage to choose which attributes will be used in the calculation process.
1. Data Preparation
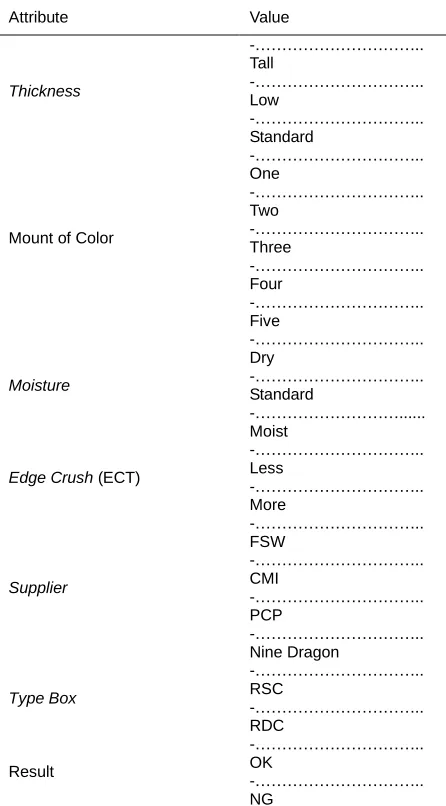
This data is obtained by sampling BCT data from existing data, the attributes taken are :
1…….……….…… Thickness | Low (<6.2 mm), Standard (>=6.2 mm,<=7mm), High (>7mm) | Depends on type Flute 2...………..
Mount of color
3………..………. . Moisture | Dry (<7 %), Standard (>=7 %,<=9 %), Moist (>9 %)
4………..……… Edge Crush (ECT) | Less (<5.8 Kgf), Lebih (>5 Kgf) | Depends on Paper Grammature
5……… …Supplier
6……… …Type Box
7……… …Result
The selection of these attributes has been changed from the numerical type to the nominal type so that the results of the BCT test are expected to run well.
5125
2. Modeling
a. Choosing a Modeling Technique
The selected data mining technique is the decision tree using the C4.5 algorithm. The selection of this model is very appropriate to be used to explore knowledge about determining BCT results. Data mining modeling begins with making a rule for decision tree formation.
b. Assessing Models
To analyze the data using the C4.5 algorithm, data that amounts to 400 data are divided into 300 training data and 100 test data with 6 attributes and 1 target attribute. The amount of 400 data is obtained based on the calculation of the Solvin method to determine the number of samples taken with a population of 50,000 data and an error tolerance limit of 5%.
Next is to calculate the number of cases for OK and NG results, including the number of cases for thickness, number of colors, moisture, ECT, supplier, and type box. After that, calculate the entropy value from all cases and calculate the gain ratio for each attribute. This process is carried out repeatedly until each branch is fulfilled.
Table 2. Calculation Root Node
From these calculations, obtained 6 rule based as follows :
1……… IF Moisture=Kering AND type_box=RDC AND thikcness=Tinggi THEN hasil=OK
2………IF
Moisture=Kering AND type_box=RDC AND thikcness=Standard THEN hasil=NG
3………IF
Moisture=Kering AND type_box=RDC AND thikcness=Rendah THEN hasil=NG
4………IF Moisture=Kering AND type_box=RSC THEN hasil=OK 5………IF
Moisture=Standard THEN hasil=OK
6………....IF Moisture=Lembab THEN hasil=NG
Figure 4. Results of Application Calculation
Figure 4 above is the result of the calculations displayed in the application.
1……… Evaluation
After obtaining a decision tree model and generating rule based, rules testing will be carried out with 100 data test data.
Attribute Value
Thickness
-……….. Tall
-……….. Low
-……….. Standard
Mount of Color
-……….. One
-……….. Two
-……….. Three
-……….. Four
-……….. Five
Moisture
-……….. Dry
-……….. Standard
-………... Moist
Edge Crush (ECT)
-……….. Less
-……….. More
Supplier
-……….. FSW
-……….. CMI
-……….. PCP
-……….. Nine Dragon
Type Box
-……….. RSC
-……….. RDC
Result
-……….. OK
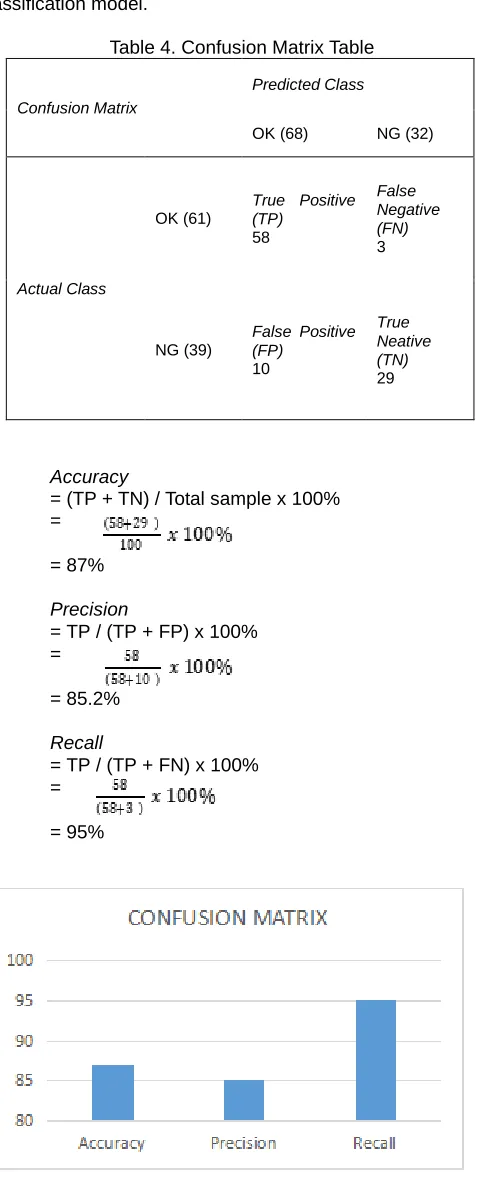
5126 Evaluation is done by analyzing the classification results. Data
measurement is done by confusion matrix to evaluate the results of the C4.5 algorithm.
Confusion matrix is a table that consists of many rows of test data that are predicted to be true and incorrect by the classification model.
Table 4. Confusion Matrix Table
Confusion Matrix
Predicted Class
OK (68) NG (32)
Actual Class
OK (61)
True Positive (TP)
58
False Negative (FN) 3
NG (39)
False Positive (FP)
10
True Neative (TN) 29
Accuracy
= (TP + TN) / Total sample x 100% =
= 87%
Precision
= TP / (TP + FP) x 100% =
= 85.2%
Recall
= TP / (TP + FN) x 100% =
= 95%
Figure 5. Confusion Matrix Calculation Results
Figure 5 above is the result of the configuration matrix Accuracy gets a value of 87%, Precision 85.2% and recal
95%.
5.
CONCLUSION
Based on the results of the research and discussion in the previous chapters, the author draws several conclusions, namely: Making a data mining application to classify the results of Box Compression Test (BCT) capable of processing input and producing output in the form of a decision tree structure that produces rules. These rules become a reference in determining the results of the BCT test which is expected to increase the effectiveness of the production of a company. From calculations with confusion matrix, it can be seen that the accuracy value is 87%, the value of precision is 85.2%, and the recall value is 95%. from the results of tests that have been conducted, it can be seen that the classification of the determination of BCT results with the C4.5 algorithm method is included in the fair classification category.
REFERENCES
[1] J. Han and M. Kamber. “Data Mining Concept and
Tehniques”. San Fransisco: Morgan Kauffman. ISBN 13: 978-1-55860-901-3, 2016
[2] P. A. Devijver & J. Kittler. “Pattern recognition: A statistical approach“ (p. 448). Englewood Cliffs, NJ: Prentice/Hall International. 1982
[3] Witten, I. H., Frank, E., Hall, M. A., “Data Mining Practical Machine Learning Tools and Techniques (3rd ed)”. USA: Elsevier 2011
[4] K.M, Jaber, R. Abdullah, N. Rashid , “A Hybrid Decision Tree/Harmony Search Algorithm for Biological Datasets”, International Conference on Computer dan Information Science (ICCIS), 2012 pp 341-345
[5] R. K. Amin, Indwiarti and Y. Sibaroni. “Implementation of Decision Tree Using C4.5 Algorithm in Decision Making of Loan Application by Debtor (Case Study:Bank Pasar of Yogyakarta Special Region)”. 3rd International Conference on Information and Communication Technology (ICoICT), 2015
[6] R. Sudrajat. “Analysis of data mining classification by comparison of C4.5 and ID algorithms”. IOP Conference Series: Materials Science and Engineering 166 012031 2017
[7] S. Sharma, J. Agrawal and S. Sharma. “Classification
Through Machine Learning Technique: C4.5 Algorithm based on Various Entropies”. International Journal of Computer Applications (0975 – 8887) Volume 82 – No 16, November 2013
[8] B. Hermanto, A. SN. “Klasifikasi Nilai Kelayakan Calon Debitur Baru Menggunakan Decision Tree C4.5”, IJCCS, Vol.11, No.1, January 2017, pp. 43~54 ISSN: 1978-1520
[9] D. T. Larose, C. D. Larose. “Discovering Knowledge in Data:
An Introduction to Data Mining”.Wiley Publisher, 2014. [10]Liu, C., dan Jiang, Q., “Mixed Financial Forecasting Index
System Construct and Financial Forecasting Study on the C4.5 Decision Tree”, School of Information 2009
[11]K. Adhatrao, A. Gaykar, A. Dhawan, R. Jha and V. Honrao.
“Predicting Students Performance Using Id3 And C4.5
Classification Algorithms”, Department of Computer Engineering, Fr. C.R.I.T., Navi Mumbai, Maharashtra, India, International Journal of Data Mining & Knowledge Management Process (IJDKP) Vol.3, No.5, September 2016 [12]H. Pareek, P. R. L. Eswari and N. S. C. Babu. “Entropy and
n-gram Analysis of Malicious PDF Documents”. International Journal of Engineering, 2013
5127