Rare beauty and charm decays with the CMS experiment
Kai-Feng Chen1,a
1National Taiwan University, Taipei, Taiwan
Abstract.Rare beauty meson decays B0
s → µ+µ −
, B0 → µ+µ−
, and charm meson decays D0 → µ+µ− are searched in pp collisions at √s =7 TeV. A data sample corresponding to an integrated luminosity of 5 fb−1 collected by the CMS experiment is used for the B→µ+µ−study, while the data sample used for D0 →µ+µ− search is 90 pb−1. The number of events observed after applying the full selection criteria is consistent with the expectations from the sum of background and standard model signal. The resulting upper limits on the branching fractions areB(B0
s →µ+µ −
)<7.7×10⁻⁹,B(B0→µ+µ−
)<1.8×10⁻⁹at 95% confidence level, and B(D0→µ+µ−
)<5.4×10⁻⁷at 90% confidence level.
1 Search for rare
B
0s
→
µ
+µ
−
and
B
0→
µ
+µ
−decays
The decays B0
s → µ+µ
−and B0 → µ+µ−are highly
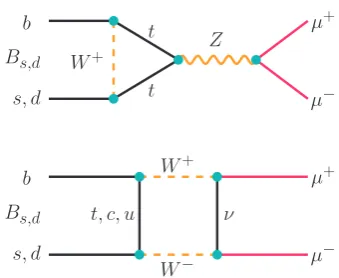
sup-pressed in the standard model of particle physics. As shown in Fig. 1, these processes only proceed through the flavor-changing neutral currents, which are forbidden at leading order diagrams; an internal quark annihilation within the B meson is also required and further reduces the decay rate. Further suppression based on helicity is given by a factor ofm2µ/m2B, where mµ (mB) is the mass of the muon (B meson). The predicted branching frac-tions of these two decays are given byB(B0
s → µ+µ−) = (3.2±0.2)×10−9B(B0→µ+µ−)=(1.0±0.1)×10−10[1], and are particularly reliable. Several standard model ex-tensions, such as a two-Higgs doublet model [2] or a spe-cific model with leptoquarks [3], may introduce enhance-ments to the branching fractions. Some other new physics models, the decay rates can also be reduced [4]. These de-cays are an excellent probe to the new physics; any diff er-ence in standard model branching fraction could provide a smoking gun signal.
Simultaneous searches for B0s →µ+µ−and B0→µ+µ− decays using data collected by the CMS experiment in pp collisions at √s = 7 TeV are presented in Ref. ??. A dataset corresponding to an integrated luminosity of 5 fb−1 is used. The CMS detector is a general-purpose detector, a detailed description can be found in Ref. [6]. The central feature of the detector is a superconducting solenoid that provides an axial magnetic field of 3.8 T. Charged parti-cle trajectories are measured within the field volume by pixel and silicon strip tracker. The calorimeter enclosing the tracker includes a lead tungstate crystal electromag-netic calorimeters (ECAL), which is composed of a barrel part and two endcaps, a lead and silicon preshower detec-tor in front of the ECAL endcaps, and a brass/scintillator
ae-mail: [email protected]
b
s, d
b
s, d
t
t W+
Z µ
+
µ− Bs,d
Bs,d
W+
W−
t, c, u ν
µ+
µ−
Figure 1.Representative Feynman diagrams for B0
s →µ+µ −
and B0→µ+µ−decays.
hadron calorimeter (HCAL) that together provide an en-ergy measurement for electrons, photons, and hadronic jets. Muons are identified and measured in gas-ionization detectors embedded in the steel return yoke outside the solenoid. The detector is nearly hermetic, allowing accu-rate energy balance measurements in the plane transverse to the beam direction. The direction of particles measured inside the CMS detector is described using the azimuthal angle (φ) and the pseudorapidity (η), which is defined as η ≡ −ln[tanθ/2], whereθ is the polar angle relative to the counterclockwise proton beam direction, as measured from the nominal interaction vertex.
1.1 Reconstruction and selection
Muon candidates are reconstructed by combining tracks found in the silicon tracker and the muon detector. The muon candidates must have at least two track segments in the muon stations, and have more than ten hits in the sili-con tracker, while at least one must be in the pixel detec-tor. The track-fit quality (χ2per degree of freedom) for the
DOI: 10.1051/
C
Owned by the authors, published by EDP Sciences, 2013 epjconf 201/ 34913002
This is an Open Access article distributed under the terms of the Creative Commons Attribution License 2 0 , which . permits unrestricted use, distributi and reproduction in any medium, provided the original work is properly cited.
combined track must be less than 10. The impact param-eter in the transverse plane with respect to the beam-spot must be smaller than 0.2 cm. The muon efficiency is de-termined with a tag-and-probe method withJ/ψ→ µ+µ− events, which has been applied to both data and simulated samples. For the signal events, the average efficiency is estimated to be 71% (85%) in the barrel (endcap) channel based on the simulations.
Reconstruction of B→ µ+µ−candidates requires two
oppositely-charged muons that originate from a common vertex, and the invariant mass of the pair must be within the range of 4.9<mµµ <5.9 GeV/c2. The dimuon mass resolution, which is a critical factor for separating B0
s and B0decays, highly depends on the pseudorapidityηof the reconstructed particles. The background level also de-pends on the direction of the reconstructed B candidate. The analysis is performed in two subchannels, “barrel” (where both muons have|η|<1.4) and “endcap” (where at least one muon has|η|>1.4).
The primary vertex is chosen to be the one which has minimal separation from the z intercept of the extrapolated B candidate track, along the z axis; systematic effects due to pileup are largely removed this primary vertex selec-tion. The 3D impact parameter of the B candidate (δ3D), the uncertaintyσ(δ3D), and its significanceδ3D/σ(δ3Dare measured with respect to this primary vertex.
Three variables are used for adopting the isolation information of the B candidates: (i) the isolation I = pT(B)/(pT(B)+PtrkpT) is calculated from the transverse momentum of the B candidate pT(B) and the transverse momenta of other charged tracks within a cone of∆R < 0.7; (ii) the number of tracks Nclose
trk with the distance of closest approach<0.03 cm, with respect to the B vertex; (iii) the minimum distance of closest approach between tracks and the B vertex (d0ca). These variables help to reject partly reconstructed B decays with other tracks, in addition to the two muons, associated with the B vertex.
In addition to the isolation related variables, the 3D pointing angle α, the 3D flight length significance `3D/σ(`3D), and theχ2/dof of the vertex fit, are also ex-amined.
The requirements on the variables discussed above, to-gether with transverse momenta of the B candidate and two daughter muons, are optimized to obtain the best ex-pected upper limit using simulated signal events and data background events. The data background events are de-fined as B candidates with a dimuon mass in the sidebands covering the range 4.9<mµµ<5.9 GeV/c2, excluding the signal windows of 5.20<mµµ <5.45 GeV/c2. The opti-mized selection criteria, which are used to determine the final results, are summarized in Table 1.
After the selection requirements, simulated events are used to determine the efficiencies for the signal samples. The simulated events are generated with Pythia 6.424
(Tune Z2) [7] and the B mesons are decayed via Evt
-Gen[8].
Table 1.Selection criteria for the events in the barrel and
endcap channel.
Variable Barrel Endcap units
pTµ,1> 4.5 4.5 GeV
pTµ,2> 4.0 4.2 GeV
pTB> 6.5 8.5 GeV
δ3D< 0.008 0.008 cm
δ3D/σ(δ3D)< 2.000 2.000 α < 0.050 0.030 rad. χ2/dof< 2.2 1.8
`3D/σ(`3D)> 13.0 15.0
I> 0.80 0.80
d0
ca> 0.015 0.015 cm
Nclose
trk < 2 2
1.2 Results
A counting experiment in dimuon mass regions is carried out in a target signal region of 5.20<mµµ<5.45 GeV/c2.
Combinatorial backgrounds are evaluated from the data events outside of signal region. The backgrounds due to rare B decays, where one or two hadrons are misidentified as muons, are estimated with simulated samples. These decays include B →h+µ−νand B→ h+h−, whereh± de-notes a charged pion, kaon or proton and the mother parti-cle B could be B0,Bs, orΛb.
A normalization channel B+ → J/ψK+is introduced to remove the uncertainties related to the b-quark produc-tion cross secproduc-tion and to the integrated luminosity. The reconstruction of B+ → J/ψK+ events is very similar to the reconstruction of B → µ+µ−events. Candidates with
two oppositely-charged muons associating with a common vertex are required to have an invariant mass within the range of 3.0 to 3.2 GeV/c2. These candidates are com-bined with another track which is assumed to be a kaon. All requirements introduced for B→µ+µ−events are also
applied.
Branching fractions (and the associated upper limits) are measured in the barrel and endcap channels separately using the following formula
B(B→µ+µ−)= NS NB+
obs fu fs
εB+ tot
εtot
B(B+), (1)
where εtot (εB
+
tot) is the total signal (normalization chan-nel) efficiency, and NS(NB
+
obs) is the yield of B → µ+µ
−
(B+ → J/ψK+) decays. Branching fraction of the nor-malization channel B(B+) is given by PDG [9], and the LHCb measured value of fs/fu = 0.267±0.021 [10] is used, which is the ratio of the B+and Bsproduction cross sections.
The yields of B+ → J/ψK+decays are determined to be (82.7±4.2)×103and (23.8±1.2)×103in the barrel and endcap, respectively, with fits to the invariant mass distributions shown in Fig. 2. The total efficienciesεBtot+ are estimated to be (11.0±0.9)×10−4for the barrel and (3.2±0.4)×10−4for the endcap channel.
[GeV] K
µ µ
m 5 5.2 5.4 5.6 5.8
Candidates / 0.010 GeV
2000 4000 6000 8000 10000
Barrel -1
CMS, 5 fb s = 7 TeV
[GeV] K
µ µ
m 5 5.2 5.4 5.6 5.8
Candidates / 0.010 GeV
500 1000 1500
Endcap -1
CMS, 5 fb s = 7 TeV
Figure 2.Invariant-mass distributions of the normalization
chan-nel (B+ → J/ψK+) in the barrel (left) and endcap (right). The solid and dashed lines show the fits to the data and background, respectively.
Expected yields of background from rare B decays,Npeakexp, are also shown in the same table. Those yields are all scaled according to the normalization channel, in-cluding the performance of muon detection efficiency and misidentification rates determined from data. The expected numbers of combinatorial background events, Ncombexp , are evaluated by an interpolation from the events in the sideband regions assuming a flat background model, while the expected rare semileptonic backgrounds are sub-tracted.
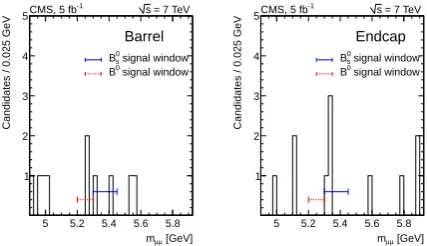
The measured dimuon invariant mass distributions around the B meson mass are shown in Fig. 3. The ob-served yields, as summarized in Tab. 2 as well, are con-sistent with the expectations for standard model signals plus background sources. Upper limits on the Bs→µ+µ− and B0 → µ+µ− branching fractions are determined
us-ing the CLs method [11, 12]. The upper limits are evalu-ated to beB(Bs→µ+µ−) < 7.7×10⁻⁹ (6.4×10⁻⁹) and B(B0→µ+µ−) < 1.8×10⁻⁹ (1.4×10⁻⁹) at 95% (90%) confidence level. Including possible cross-feed events be-tween the Bsand B0 decays, the background-onlyp val-ues are calculated to be 0.11 (1.2σ) and 0.24 (0.7σ) for Bs→µ+µ−and B0→µ+µ−, respectively.
In summary, the searches for the rare B decays Bs →
µ+µ− and B0 → µ+µ− have been carried out in pp
col-lisions at √s = 7 TeV. A data sample corresponding to an integrated luminosity of 5 fb−1 has been used. The observed number of events is consistent with background plus signals based on the standard model predicted branch-ing fractions, and no significant excess found. The upper limits on the branching fractions have been evaluated and can be used to improve the bounds on several extensions of the standard model.
2 Search for rare
D
0→
µ
+µ
−decays
The rare charm decay D0 → µ+µ− shares the same di-agrams of B0 → µ+µ−; the flavor-changing neutral cur-rent decays are rare and only proceed via the process with an internal loop. The predicted branching fraction [13] is approximately 10−18 from short range processes and can
[GeV]
µ µ
m 5 5.2 5.4 5.6 5.8
Candidates / 0.025 GeV
1 2 3 4 5
signal window 0
s B
signal window 0
B
Barrel
-1
CMS, 5 fb s = 7 TeV
[GeV]
µ µ
m 5 5.2 5.4 5.6 5.8
Candidates / 0.025 GeV
1 2 3 4 5
signal window 0
s B
signal window 0
B
Endcap
-1
CMS, 5 fb s = 7 TeV
Figure 3. Dimuon invariant-mass distributions for the barrel
channel (left) and endcap channel (right). The horizontal lines show the signal regions for Bsand B0modes.
be enlarged to 10−13 with long range contributions. Any observation of these modes at rates exceeding the predic-tion of the standard model could hint the existence of new physics.
A search for D0 → µ+µ−is performed using a dataset
of pp collisions at √s=7 TeV, corresponding to an inte-grated luminosity of 90 pb−1, collected by the CMS detec-tor. The CMS detector has been introduced in the previous section already. The analysis is carried out by measuring the productions of D∗+ → D0π+,D0 → µ+µ−, respect to the normalization channel D∗+ → D0π+,D0 → K−µ+ν. Most of the systematics can be cancelled, however, the challenge and restriction of this analysis is to reconstruct the D0 → K−µ+νevents. The trigger efficiency is much smaller due to the higher threshold at trigger level, and also restricts the amount of data that can be included in the study.
2.1 Reconstruction and selection
The events with a muon having a pT greater than a cer-tain trigger threshold, which changes with running condi-tions, are selected for the analysis. The dataset collected in 2010 has six different trigger thresholds, varies from 3 to 15 GeV/con the muon pT. The first 54 pb−1 of data collected in 2011 have a pT threshold of 15 GeV/c. The later data sets are not included in this analysis due to the low reconstruction efficiency of the normalization decay D0→K−µ+ν.
The signal D0 →µ+µ−candidate is built with two
Table 2.Signal selection efficiency (εtot), the predicted signal yields (N signal
exp ), the expected peaking and combinatorial background yields (NexppeakandNexpcomb), the total number of expected events (Ntotalexp), and the number of observed events (Nobs) in the barrel and
endcap channels. The uncertainties shown include both statistical and systematic sources.
B0→µ+µ−Barrel B
s→µ+µ−Barrel B0 →µ+µ−Endcap Bs→µ+µ−Endcap
εtot(%) 0.29±0.02 0.29±0.02 0.16±0.02 0.16±0.02 Nexpsignal 0.24±0.02 2.70±0.41 0.10±0.01 1.23±0.18 Nexppeak 0.33±0.07 0.18±0.06 0.15±0.03 0.08±0.02 Ncomb
exp 0.40±0.34 0.59±0.50 0.76±0.35 1.14±0.53 Ntotal
exp 0.97±0.35 3.47±0.65 1.01±0.35 2.45±0.56
Nobs 2 2 0 4
vector and the flight direction of the D0 candidate must satisfy a cosα >0.99 requirement. The D∗+candidate is
combined by a D0candidate and a track, which are origi-nated from the same primary vertex. A requirement on the
∆M =M(µ+µ−π+)−M(µ+µ−)<180 MeV/c2is applied. Reconstruction of D0→K−µ+νstarts with combining
a kaon candidate and an oppositely charged muon candi-date. The muon candidate must satisfy the same require-ments mentioned above. A secondary vertex is formed by the kaon and muon candidates and their vertex fit confi-dence level must be> 1%. The technique developed by E691 experiment [14] is used to determine the neutrino momentum. Again the D∗+ candidate is combined by a D0candidate and a track with pion mass assumed. A re-quirement on the∆M =M(K−µ+νπ+)−M(K−µ+ν)<180 MeV/c2 is also applied. If there are multiple combina-tions exist, the combination with∆M closest to the nom-inal PDG mass difference is selected. Significance of the separation between primary and secondary vertices is re-quired to be greater than 3.
Figure 4 shows the reconstructed normalization chan-nel D∗+→D0(→K−µ+ν)π+candidates and signal D∗+→
D0(→µ+µ−)π+events. With an additional requirement of
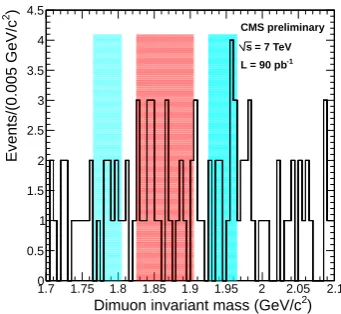
|∆M−∆MPDG|<3 MeV/c2, the dimuon invariant mass dis-tribution of the remaining events is shown in Fig. 5. The background shape in this limited mass region is assumed to be flat, and the background yield in the signal region is estimated from the yields in the sideband regions. There are 23 events observed in the signal region but the number of background events is also estimated to be 23. Clearly there is no evidence of D0 → µ+µ− decays observed in data.
The limit of the D0 →µ+µ−decay branching fraction is evaluated with the following equation
B(D0 →µ+µ−)≤ B(D0→K−µ+ν)× Nµµ NKµν ×
εKµν
εµµ , (2)
where Nµµ is the upper limit on the D0 → µ+µ− signal yield, andNKµνis the yield of normalization channel D0→ K−µ+ν. The overall efficienciesεKµν andεµµinclude the effects of acceptance and reconstruction efficiencies and are extracted from simulated samples. The branching frac-tion of the normalizafrac-tion channelB(D0 →K−µ+ν) is taken
from the PDG.
In conclusion, the search of rare charm meson decay D0 → µ+µ− is performed at CMS experiment. No
ex-Figure 4. The∆M distributions in the normalization channel
D∗+ →
D0π+,D0 → K−µ+ν
(left), and in the signal channel D∗+→
D0π+,D0→µ+µ−
(right). In the left plot the background function is shown as a dashed curve.
Figure 5.The dimuon invariant mass distribution for D0→µ+µ−
candidates, after a requirement on the∆M. The red band shows the signal region, while the two blue bands show the sideband regions.
cess above the background seen in a dataset correspond-ing to an integrated luminosity of 90 pb−1. Based on the CLs method, the results from datasets with different trig-ger thresholds are combined. Several systematic sources, such as trigger efficiency, fit to the normalization channel, and the uncertainty on the PDG average value, have been studied and included in the limit calculations. The result-ing limit is evaluated to beB(D0→µ+µ−)<5.4×10⁻⁷at 90% confidence level.
) 2 ) (MeV/c
ν µ
)-M(K
π ν µ
M=M(K
∆
140 145 150 155 160 165 170 175
)
2
Events/(0.5 MeV/c
0 200 400 600 800
1000 CMS preliminary
= 7 TeV s
-1
L = 54.53 pb
) 2 ) (MeV/c
µ µ
)-M(
π µ µ
M=M(
∆
140 145 150 155 160 165 170 175
)
2
Events/(0.5 MeV/c
0 5 10 15 20 25 30
35 CMS preliminary = 7 TeV s
-1
L = 90 pb
)
2
Dimuon invariant mass (GeV/c
1.7 1.75 1.8 1.85 1.9 1.95 2 2.05 2.1
)
2
Events/(0.005 GeV/c
0 0.5 1 1.5 2 2.5 3 3.5 4 4.5
CMS preliminary
= 7 TeV s
References
[1] A. J. Buras, Acta Phys. Polon. B 41, 2487 (2010) [arXiv:1012.1447 [hep-ph]].
[2] J. R. Ellis, K. A. Olive, Y. Santoso and V. C. Spanos, JHEP0605, 063 (2006) [hep-ph/0603136].
[3] S. Davidson and S. Descotes-Genon, JHEP1011, 073 (2010) [arXiv:1009.1998 [hep-ph]].
[4] J. R. Ellis, J. S. Lee and A. Pilaftsis, Phys. Rev. D76, 115011 (2007) [arXiv:0708.2079 [hep-ph]].
[5] S. Chatrchyan et al. [CMS Collaboration], JHEP 1204, 033 (2012) [arXiv:1203.3976 [hep-ex]].
[6] S. Chatrchyanet al. [CMS Collaboration], JINST3, S08004 (2008).
[7] T. Sjostrand, S. Mrenna and P. Z. Skands, JHEP0605, 026 (2006) [hep-ph/0603175].
[8] D. J. Lange, Nucl. Instrum. Meth. A462, 152 (2001). [9] K. Nakamura et al.[Particle Data Group
Collabora-tion], J. Phys. G37, 075021 (2010).
[10] R. Aaij et al. [LHCb Collaboration], Phys. Rev. D 85, 032008 (2012) [arXiv:1111.2357 [hep-ex]]. [11] T. Junk, Nucl. Instrum. Meth. A 434, 435 (1999)
[hep-ex/9902006].
[12] A. L. Read, J. Phys. G28, 2693 (2002).
[13] G. Burdman, E. Golowich, J. L. Hewett and S. Pakvasa, Phys. Rev. D 66, 014009 (2002) [hep-ph/0112235].