Students’ Initial Knowledge State
And Test Design: Towards A Valid
And Reliable Test Instrument
Antonio Roland I. CoPo, University of the East, PhilippinesABSTRACT
Designing a good test instrument involves specifications, test construction, validation, try-out, analysis and revision. The initial knowledge state of forty (40) tertiary students enrolled in Business Statistics course was determined and the same test instrument undergoes validation. The designed test instrument did not only reveal the baseline knowledge of the students, but also notes strengths, weakness and defects of the test instrument through the analysis of the test scores. Analysis of the test instrument revealed that it is reliable and valid. The item analysis result guided the researcher in improving the test items resulting to a better overall test.
Keywords: Initial Knowledge Validity Reliability
INTRODUCTION
test is an assessment that measures student’s learning. If a test is good, it should reflect student’s proficiency level. On the other hand, an ill-conceived test may reveal what the students do not know and what they have not been taught (Hasan, 2014). A good test has some characteristic qualities: validity and reliability. It is important to note that designing test instrument involves specifications, test construction, try-out, analysis and revision.
Validity (Chase, 2007) is the extent to which a test measures what it is supposed to measure. One of the approaches in establishing test validity is content validity. There is content validity if the items in the test constitute a representative sample of the total course content to be tested. Greatest attention is given to the significant objectives of instruction, while less attention is given to the less significant outcomes.
Furthermore, Chase (2007) enumerated the following steps in laying out the content validity of a test: 1) identify the topics on which the test will be built according to the Business Statistics course outline, 2) judge relative importance of each topic, 3) build a table of specifications, and 4) write the test items corresponding with topics in reference to the frequency of appearance and cognitive requirements as shown in the specifications.
Table of specification is utilized by the researcher in the development of the test instrument. It is a two-way chart that serves as a basic guideline for systematically ordering and assembling test instrument (University of Kansas, 2014). It describes the topics to be covered by a test and the number of items or points which will be associated with each topic. The purpose is to coordinate the assessment questions with the time spent on any particular content area. The use of a table of specifications helps increase the validity and quality of objective type of test instruments.
reliable. In establishing the reliability of the test instrument, Split-Half Reliability and Kuder-Richardson Reliability (KR 20) is used.
Item Analysisis conducted on the designed test instrument in order to identify tests items that are poor and deficient in some ways. The identified items are then improved or eliminated, resulting to a better overall test instrument.
THEORETICAL FRAMEWORK
Designing a test is not an easy task for a teacher. In the test construction phase of this study, the researcher utilized Bloom’s Taxonomy of Educational Objectives (Bloom, 1956) in planning the course of study and in devising test items which appropriately assess students’ learning. There are three learning domains in Bloom’s Taxonomy: cognitive, affective, psychomotor, accordingly, there is taxonomy for each. Bloom's Taxonomy, as described by the article “Taxonomies of Learning” (UWC, 2014), is a way of classifying test questions as they progress in difficulty. The lower levels require less in the way of thinking skills. As one moves down the hierarchy, the activities require higher level thinking skills. With these levels of learning outcomes as a framework, technique for test design could be done to produce test instrument with maximum content validity.
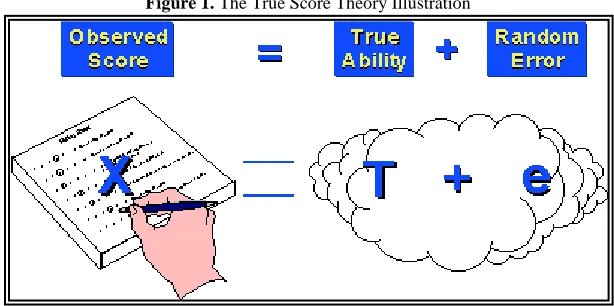
On the validation, reliability, and item analysis phase, the study anchored on the True Score Theory. Trochim (2006) opined that True Score Theorymaintains that every measurement is an additive composite of two components: true ability of the student on that measure and random error. On the left side of the equation is the observed score on the test, while, it is unknown what is on the right side of the equation. It is just assumed that there are two components on the right side. Figure 1 presents the illustration behind the True Score theory (Source: Research Methods Knowledge Base, http://www.socialresearchmethods.net/kb/truescor.php).
Figure 1. The True Score Theory Illustration
True score theory emphasizes that most measurement has an error component. It is said that a measure that has no random error (i.e., is all true score) is perfectly reliable, inversely, a measure that has no true score (i.e., is all random error) has zero reliability.
Figure 2. Simple Equation Representing the Theory
Based on the theory, student’s test scores consists of the true score (ability) of the student plus the factors (error) that could have affected the students while taking the test. Since the instrument being evaluated in this study is on its preliminary stage, the researcher would like to consider some possible errors in the test item construction as systematic error. These systematic errors could be corrected, thus, establishing high validity level of the tests. True score theory serves as a framework in establishing the reliability of the tests instrument.
STATEMENT OF THE PROBLEM
This study assessed the initial knowledge state of the 40 University of the East (UE) students of Business Statistics using a teacher designed test instrument and validated the same based on the resulting students’ scores on the test. The said test instrument did not only reveal the baseline knowledge of the students, but also notes strengths, weakness and defects of the test instrument. To determine this, the test scores are analyzed in order to come up with a better test instrument.
Specifically, this study described the following: test construction, students’ initial knowledge state, reliability and validation resulting to a better overall test instrument.
DATA GATHERING INSTRUMENT AND PROCEDURES
The data gathering procedure involved three phases: Test Construction Phase, Test Implementation, and Test Scores Evaluation Phase.
Test Construction Phase. The design of the test instrument for Business Statistics is done at this phase. The lesson covered the Fundamentals of Probability with the following sub-topics: Basic Probability Concepts, Basic Counting Rules, and Probability Rules. These topics can be taught for 9 hours. Content validity is established in this phase with the aid of table of specification.
Test Implementation Phase. The constructed test instrument was given to students of Business Statistics during the first semester of 2009.
impure because it appears to be measuring several different attributes. KR20 coefficients below 0.64 are often an indication that the test scores should be interpreted with caution.
Items analysis was conducted on the test items, where the index of difficulty and discrimination was computed, based on the result of the test of the students. Test items should discriminate between students who do well in the test from those who do not. Meaning, with a good item, students who got the item right should be among the high scorers on the test, and most of the students who miss the item should be among the low scorers. Discrimination index (D) is computed to determine if an item really is showing differences between high and low scorers. If D is larger, the item is performing better.
For maximum D, the item should be sufficiently difficult so that at least a portion of the class should miss it. To determine the difficulty level (p) of an item, it is computed by getting the number of students who pass each item divided by the total number of students, times one hundred. In other words, it is the percentage of students who got the items right.
FINDINGS OF THE STUDY
The Test Instrument
Validity. The test instrument was classified in two categories. The first category was classified as Knowledge with ten (10) items. While the second category as Application containing twenty items. Table 1 presents the Table of Specification for the constructed test instrument.
Table 1. Table of Specification for the Test Instrument
Instructional Content No. of Hours % of Representation
in the Unit of Study Knowledge Application
Basic Probability Concept 1.5 16 5
Basic Counting Rules 4.5 50 5 10 Probability Rules 3 33 3 7 TOTAL 9 100 13 17
From a total of nine (9) hours allotted for lesson Fundamentals of Probability, the most number of lecture hours (4.5) is allotted to Basic Counting Rules which includes Combination and Permutation. This is Application in the hierarchy of Bloom’s Taxonomy under the Cognitive domain. Basic Counting Rules is discussed for four and a half hours (4.5) hours, Probability Rules for three (3) hours, and Basic Probability Concept for one and a half (1.5) hour, the researcher constructed the Test instrument with thirty (30) items in multiple choice type.
The Table of Specification reveals that of the 30-items test, 15 test items are taken from the topic Basic Counting Rules, ten items from Probability Rules, and five items from Basic Probability Concepts.
Initial Knowledge State Of The Students In The Course Business Statistics
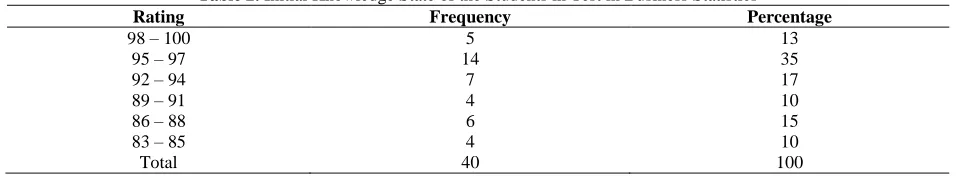
Table 2. Initial Knowledge State of the Students in Test in Business Statistics
Rating Frequency Percentage
98 – 100 5 13 95 – 97 14 35 92 – 94 7 17 89 – 91 4 10 86 – 88 6 15 83 – 85 4 10 Total 40 100
the minimum cut-off passing percentage of 75.Thus, the students' initial knowledge state of 83 - 100 in the course Business Statistics belongs to the passing percentage bracket.
Reliability. The split-half reliability coefficient of the test is low (r = 0.52). However it was corrected and the resulting Spearman-Brown coefficient reveals that the test has adequate reliability (r = 0.68). Furthermore, follow-up computation on reliability using Kuder-Richardson 20 shows adequate reliability of the test (r = 0.67). With this finding, it may be concluded that the test instrument is reliable.
Item Analysis. Item Analysis identifies tests items that are poor and deficient in some ways. The identified items are then improved or eliminated, resulting to a better overall test. Result showed that the thirty (30) items have positive discrimination index. However, result showed that test items 3, 4, 5, 8, 9, 10, 12, 15, 16, 18, and 19 have D less than 0.30, meaning that the items were rejected and was revised by the researcher.
Difficulty Index is the percentage of students who got the items right. Acceptable range of difficulty is from forty percent (40%) to eighty percent (80%) for four-option multiple choice items. Results showed that the test items are of reasonable easy, average and difficult categories.
Contributions of the Findings to The Teaching of The Course
The test instrument scores provided a general index of students’ initial knowledge which could give the teachers insight as to identifying students’ knowledge of Probability. The Statistics test instrument can be used to evaluate the effectiveness of instruction in improving students’ initial knowledge.
CONCLUSIONS
It is important to note that designing a good test instrument involves specifications, test construction, validation, try-out, analysis and revision. The designed test instrument did not only reveal the baseline knowledge of the students, but also notes strengths, weakness and defects of the test instrument through the analysis of the test scores in order to come up with a better test instrument.
AUTHOR INFORMATION
Antonio Roland I. CoPo, is a Professor from the College of Business Administration of the University of the East. He teaches Mathematics and Statistics courses. Currently, he is the President of the University of the East Faculty Association.
REFERENCES
Alade, O.M, Omoruyi, Igbinosa Victor. Table Of Specification And Its Relevance In Educational Development Assessment. European Journal of Educational and Development Psychology Vol.2, No.1, pp.1-17, March 2014
Balbuena, Milagros M. (2001). Construction, Validation and Standardization of Aggression Rating Scale. Dissertation Abstract, UE Research Bulletin, Vol. 3 pp. 83-87.
Bloom, B.S. (1956) Taxonomy of Educational Objectives, Handbook I: The Cognitive Domain. New York: David McKay Co. Inc., http://www.nwlink.com/~donclark/hrd/bloom.html
Chase, Clinton I. (2007). Measurement for Educational Evaluation. Addison-Wesley Publishing Company
Crisolo, Jose Jr. (2004) Development of An Achievement Test in Mathematics for Senior Students in the Division of Makati. Master’s Thesis, The Pioneer, Graduate School Journal, Vol. XVII.
Gregorio, Herman C., Principles and Practices of College Teaching. R.P. Garcia Publishing Inc., 1983, pp. 254. Hasan, Rajibul. Qualities of a Good Test.English Literature Essay.
http://allrfree.blogspot.com/2010/03/qualities-of-good-test.html October 12, 2014.
Messick, S. (1989). Validity. Educational measurement (3rd ed., pp. 13–103). Washington, DC: American Council on Education / Macmillan.
University of Kansas (KU), “Table of Specifications”.
http://www.specialconnections.ku.edu/?q=assessment/quality_test_construction/teacher_tools/table_of_spe cifications, Retrieved October 22, 2014
University of the Western Cape (UWC), “Taxonomies of Learning”.
http://freecourseware.uwc.ac.za/freecourseware/nursing/teaching-learningand-assessment-methods/, Retrieved October 22, 2014.
Test Validity. College Board. http://research.collegeboard.org/services/aces/validity/handbook/test-validity Trochim, William M.K. (2006). Research Methods Knowledge Based.