Original Research Article
A cross sectional study to assess the prevalence and associated factors
of computer vision syndrome among engineering students
of Hyderabad, Telangana
Anupama Pulla, Asma*, Nanduri Samyuktha, Soumya Kasubagula,
Aishwarya Kataih, Devender Banoth, Harshitha Addagatla
INTRODUCTION
“Computer Vision Syndrome” (CVS), is defined by the American Optometric Association as a complex of eye and vision problems related to the activities which stress the near vision and which are experienced in relation to or during the use of computers.1 It is usually due to focusing of eyes on a computer or other display device for protracted, uninterrupted periods of time and the eye
muscles being unable to recover from the strain due to lack of adequate sleep. Symptoms of CVS include headache, blurred vision, eye fatigue, strain to eye, neck pain, dry eyes, diplopia, polyopia, difficulty in refocusing the eyes.2
It is reported that around 60 million people suffer from CVS globally, and that a million new cases occur each year.3 CVS affects 75% of the people who work on
ABSTRACT
Background: Computer vision syndrome is a complex of eye and vision problems related to near work which are experienced due to prolonged computer use. Computers demand near work, for longer duration which increases discomfort of eye and prolonged exposure to the discomfort leads to a cascade of symptoms that can be referred as computer vision syndrome. The aims and objectives of the study were to determine the prevalence of computer vision syndrome among engineering students of Hyderabad, Telangana and to determine the factors related to computer vision syndrome among study population.
Methods: A cross sectional study was carried out from March to June 2017 among students of an engineering college in Hyderabad, Telangana. A convenient sample of 300 students was taken and a predesigned, pre tested questionnaire was used to obtain information.
Results: Majority of study population were males (56.3%). Around 75.1% of study population were using all the electronic gadgets like computers, laptops and smartphones. The prevalence of computer vision syndrome was found to be 60.3%. Around 46.7% of study population viewed the screen from a distance of 22-40 centimeters.
Conclusions: As students pursuing engineering stream are the future IT and Computer software engineers, preventive strategies adopted by them will significantly decrease the burden of computer vision syndrome and improve productivity. In this study a significant proportion of the engineering students were found to be having vision problems, which emphasizes the need to adopt preventive measures to avoid computer vision syndrome.
Keywords: Computer vision syndrome, Engineering students
Department of Community Medicine, Gandhi Medical College, Hyderabad, Telangana, India
Received: 23 October 2018
Revised: 27 November 2018
Accepted: 30 November 2018
*Correspondence:
Dr. Asma,
E-mail: [email protected]
Copyright: © the author(s), publisher and licensee Medip Academy. This is an open-access article distributed under the terms of the Creative Commons Attribution Non-Commercial License, which permits unrestricted non-commercial use, distribution, and reproduction in any medium, provided the original work is properly cited.
computers, most markedly among those who work for more than 3 to 4 hours on computers. This includes all professions that use computers (Information Technology, Business Process Outsourcing, Accounting, banking, front office) students and children who
Work at the computer for more than 3 hours a day Have strain at computer work.
Experience any or all of the symptoms of CVS stated Experience stressful situations associated with work
Due to advancement in technology, computer based learning is now a days considered as better option and hence the children and students of any age have very gradually switched to using computers, laptops, mobiles and tablets for both education and entertainment. This paradigm change has penetrated in youth as well as most of the education, entertainment and business-related activity are based on the use of computers.4
Most of the literature related to computer vision syndrome is on software professionals and IT professionals as these are the people who use computers for long time. This study was undertaken to assess the prevalence of computer vision syndrome among engineering students who are the predecessors of this profession. There has been a significant increase in the use of electronic gadgets like computers, laptops, mobile phones, tablets etc. which demands long continued hours of staring at screens thus affecting the vision and development of computer vision syndrome.
CVS can be almost eliminated by taking a few simple, inexpensive precautions. With a large number of students using computers daily and the number growing each day, such preventive steps are the need of hour.5
Aims & objectives
To determine the prevalence of computer vision syndrome among engineering students of Hyderabad, Telangana.
To determine the factors related to computer vision syndrome among study population.
METHODS
Study design
Cross sectional study.
Study period
March-June 2017.
Study area
A selected engineering college in Hyderabad. (VNR Vignana Jyothi Institute of Engineering and Technology– Bachupalli, Hyderabad).
Study sample
A convenient sample of 300 was taken.
Study population
Students of VNR Vignana Jyothi Institute of Engineering and Technology.
Inclusion criteria
All the students who were using computer/ laptop/ tablet for more than 3 hours per day or 15 hours per week for the last 6 months.
Exclusion criteria
Students with eye infections at the time of study and students not willing to be a part of the study.
Study tool
A pre-designed, pre-tested, semi-structured questionnaire was self-administered to the study subject.
Data collection
The questionnaire was self-administered to randomly selected students until the desired sample size was reached.
Data analysis
The data obtained was analyzed using Microsoft Excel. Descriptive statistics were calculated. Statistical tests of significance were applied wherever necessary.
Ethical considerations
Ethical clearance was obtained from Institutional Ethics Committee prior to start of study. Informed consent was taken before administering the questionnaire to study population.
RESULTS
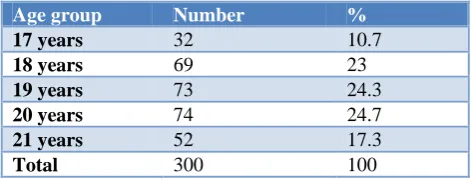
A total of 300 engineering students took part in this study. The mean age of study population was found to be 20.07±2.3 years.
Table 1: Distribution of study population according to age.
Age group Number %
17 years 32 10.7
18 years 69 23
19 years 73 24.3
20 years 74 24.7
21 years 52 17.3
Around 49% of study population was found in the age group of 19–20 years. Twenty three percent of study population was 18 years old. 17.3% of study subjects were 21 years old.
Majority of study subjects were males (56.3%) and females accounted for 43.7% of study population. Around 55.6% of study populations were having visual acuity errors and all of them were using correction for the same. Among the students who already had visual acuity errors, 91.2% were using spectacles for correction and 8.8% were using contact lenses.
Around 75.1% of students were using computers, laptops and smartphones; 20.1% were using only smartphones; 3.8% only computers; 1% only laptops.
Figure 1: Distribution of study population according to computer/laptop/smart phones/tablets usage
(number of hours per day).
Maximum (54.3%) number of students were using electronic gadgets for 3-5 hours in a day followed by 24.3% of students using for 6–10 hours/ day and around 17.3% of students were using it for <3 hours/day. Only 4.1% of students were using it for >10 hours per day. Around 85.6% of students were using these gadgets for less than one hour continuously. Seven percent of students were using it for two hours at a stretch and 7.4% of students were using these gadgets for more than 3 hours continuously.
Table 2: Distribution of study population according to use of electronic gadgets (in years).
No. of years of use of electronic
gadgets Number %
< 1 year 43 14.4
1–2 years 76 25.3
2–4 years 87 29
>4 years 94 31.3
Total 300 100
Around 31.3% of study subjects were using electronic gadgets for ≥4 years; 29% were using for 2-4 years. 25.3% were using for 1-2 years and 14.4% were using for <1 year.
Table 3: Distribution of study population according to symptoms of CVS (multiple symptoms were found).
Symptoms of CVS Number %
Headache 151 50.4
Dry eyes 105 35
Pain in and around the eyes 130 43.3
Eye strain/ eye fatigue 140 46.7
Redness and watering of eyes 73 24.3
Blurring of vision 41 13.7
Neck pain & stiffness 95 31.7 In this study it was found that prevalence of computer vision syndrome was found to be 60.3%. Among those suffering with computer vision syndrome, the most common symptom was headache (50.4%); followed by eye strain/ eye fatigue - 46.7%. around 43.3% of students complained of pain in and around the eyes; 35% - dry eyes and 31.7% of them complained of neck pain and stiffness. Redness and watering of eyes was complained by 24.3% of study subjects and 13.7% complained of blurring of vision.
Table 4: Relationship between computer vision syndrome and number of hours of use of
computer/laptop/smartphones.
No. of hours of use of computer
CVS
Total (%)
Present (%)
Absent (%)
< 3 hours 57 (34.9) 106 (65.1) 163 (54.3)
≥ 3 hours 124 (90.5) 13 (9.5) 137 (45.7)
Total 181 (60.3) 119 (39.7) 300 (100)
Chi square value – 93.6; p value <0.0001.
In this study, it was observed that prevalence of CVS among students who use electronic devices for more than 3 hours was 90.5% and it was 34.9% among students who were using the devices for less than 3 hours. The difference of 55.6% was found to be statistically highly significant.
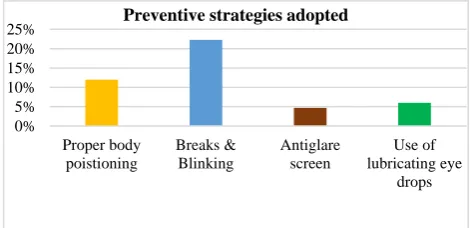
Figure 2: Distribution of study population according to preventive strategies adopted.
17.3%
54.3% 24.3%
4.1%
No.of hours of use of electronic gadgets
< 3 hours 3 - 5 hours 6 - 10 hours > 10 Hours
0% 5% 10% 15% 20% 25%
Proper body poistioning
Breaks & Blinking
Antiglare screen
Use of lubricating eye
In this study, it was observed that around 66.7% of students were aware that preventive strategies should be employed while using computers and laptops but only 28.3% of study subjects were actually practicing.
It was observed that 22.3% of study subjects were taking frequent breaks (every 30 mins) and blinking their eyes for at least 20-30 seconds during the breaks. Around 12% of students were sitting in a proper position while using electronic gadgets; 6% of them were using lubricating eye drops and 4.7% were using antiglare screen on their computer/laptop screens.
Table 5: Relationship between computer vision syndrome and myopia.
Myopia Computer vision syndrome Total (%)
Present (%) Absent (%)
Present 109 (65.3) 58 (34.7) 167 (55.6)
Absent 72 (54.1) 61 (45.9) 133 (44.4)
Total 181 (60.3) 119 (39.7) 300 (100)
Chi square value – 3.38; p<0.05
In this study it was observed that 65.3% of students who already had myopia also had symptoms of computer vision syndrome and only 54.1% of those who did not have myopia had symptoms of computer vision syndrome. The difference of 11.2% was found to be statistically significant.
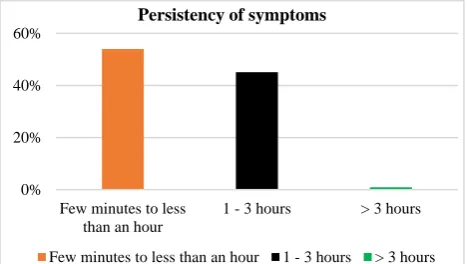
Figure 3: Distribution of study population according to persistency of symptoms.
About 54% of students informed that they experienced the symptoms every day for few minutes to less than an hour and their symptoms self- subsided. Around 45.1% of study population informed that they experienced the symptoms for more than an hour and it subsided on overnight rest. Only 0.9% of students informed that the symptoms were very worse and lasted for more than 3 hours and they took medical help for the same.
In this study it was observed that 58.4% of the students use the gadgets with the center of the screen at the level of eyes, 37.6% below the eye level and 4% above the eye level.
Table 6: Distribution of study population according to the distance of viewing the screen.
Distance from screen Number %
21–40 centimeters 140 46.7
41-50 centimeters 76 25.3
≤ 20 centimeters 62 20.7
≥51 centimeters 22 7.3
Total 300 100
In this study, 46.7% of students were viewing the screen from a very near distance of 21-40 centimeters; 25.3% from a distance of 41-50 centimeters. Around 20.7% of students were viewing the screen very closely to their eyes (≤20 centimeters).
DISCUSSION
In the present study the mean age of study population was found to be 20.07±2.3 years and majority of study subjects were males (56.3%). This finding concurred with a study conducted among Saudi Arabia University students where the mean age was 21.4±1.9 years and males were 77.28% of study population.6
In this study it was observed that around 55.6% of study population were having visual acuity errors and all of them were using correction (Spectacles/lenses) for the same; similar findings were seen in a study by Zairina A et al where respondents who used correction spectacle/lenses were 48.2%.7
In this study it was observed that maximum (54.3%) number of students were using electronic gadgets for 3-5 hours in a day. This finding concurred with a study by Zairina et al where 42.9% of the respondents used computer less than 5 hours per day.7 This finding differed with a study conducted in Delhi where 44% spent 6-9 hours, and 26% of the respondents spent more than 9 h/day working on a computer.8
In this study it was found that prevalence of computer vision syndrome was found to be 60.3%. Among those suffering with computer vision syndrome, the most common symptom was headache (50.4%); followed by eye strain/ eye fatigue - 46.7%. around 43.3% of students complained of pain in and around the eyes; 35% - dry eyes and 31.7% of them complained of neck pain and stiffness. Redness and watering of eyes was complained by 24.3% of study subjects and 13.7% complained of blurring of vision.
The present study findings were similar to a study by Talwar et al where the prevalence of visual problems found in the study group was 76% and most common were watering of eyes (23.2%), pain in eyes (25.7%), irritation in eye (18.6%), burning/itching (29.8%), redness (40.7%), blurring of vision (13.2%), and headache (29.2%).8
0% 20% 40% 60%
Few minutes to less than an hour
1 - 3 hours > 3 hours
Persistency of symptoms
In this study, it was observed that prevalence of computer vision syndrome among students who use electronic devices for more than 3 hours was 90.5%. The present finding concurred with a study in Chennai by Arumugam et al where respondents with long hours of computer usage were significantly having higher odds compared to respondents who spent less than 5 hours per day on computer.9 Similar findings were observed in a study by Zairina et al.7 This is in line with reports of other studies also.10
In a study by Ranasinghe et al significant majority of those with pre-existing eye diseases (65.3%) had severe disease (CVS) which is similar to present study where it was observed that 65.3% of students who already had myopia also had symptoms of computer vision syndrome and it was found to be significantly associated.11
In the present study 6% of them were using lubricating eye drops and 4.7% were using antiglare screen on their computer/laptop screens. The present study findings were almost similar to a study conducted in Sri Lanka where 13.2% of study participants with CVS used lubricating eye drops and 27.9% antiglare scree/ computer glasses.11
CONCLUSION
Prevalence of Computer vision syndrome was found to be very high. Computers and other visual display devices have definitely brought a tremendous change in the overall lifestyle and there is an alarmingly increase in the incidence of visual problems associated with a prolonged use of such equipment.
Working on computers is leading to repetitive stress disorder characterized by symptom complex of eye- strain, tired eyes, irritation, burning sensation, redness, dry eyes, blurred and double vision apart from non-ocular complaints like neck, shoulder and back pain.
Use of visual display devices for more than 3 hours, from a very near distance, prior presence of myopia were found to be risk factors for computer vision syndrome.
Recommendations
Health education is the need of hour to prevent computer vision syndrome among students and professionals. Computer users should reduce their time spend working on computer to less than 3 hours per day.
Those with correction spectacles/lenses should pay more attention for the possibility of getting this symptoms and taking task break to rest their eyes in between continuous computer work will be helpful.
Avoiding eyestrain by preventing continuous use of eyes by taking short breaks. One of the catch phrases is „20-20-20‟ rule, every 20 minutes, focus the eye on an object
20 feet (6 meters) away for 20 seconds OR Blink every time u hit the “ENTER” key or mouse click.
Reduction of the usage of visual display devices should be promoted and use of such devices should be delayed as much as possible to prevent/delay the early onset of computer vision syndrome.
Limitations of study
The findings of this study cannot be generalized to whole community as students of only one engineering college were selected to carry out this study.
ACKNOWLEDGEMENTS
The authors are grateful to the Principal of Gandhi Medical College and Principal of engineering college for providing an opportunity to carry out the study. The authors are thankful to the engineering students for their cooperation and support in carrying out this study. Funding: No funding sources
Conflict of interest: None declared
Ethical approval: The study was approved by the Institutional Ethics Committee
REFERENCES
1. American Optometric Association. Guide to the clinical aspects of computer vision syndrome. St. Louis: American Optometric Association; 1995. 2. Esteban P, Alvaro MP, Amalia L. Visual and ocular
effects from the use of flat panel displays. Int J Ophthalmol. 2016;9(6):881-5.
3. Sen A, Richardson S. A study of computer-related upper limb discomfort and computer vision syndrome. J Hum Ergol. 2007;36(2):45–50.
4. Rosenfield M. Computer vision syndrome: A review of ocular causes and potential treatments. Ophthalmic Physiol Opt. 2011;31:502–15.
5. Dhaliwal, N., 2002. CVS affects physically and mentally. Reader‟s Digest. 2002;75:38-57.
6. Al Rashidi SH, Alhumaidan H. Computer vision syndrome prevalence, knowledge and associated factors among Saudi Arabia University Students: Is it a serious problem? Int J Health Sci (Qassim). 2017;11(5):17–9.
7. Zairina AR, Suhaila S. Computer User: Demographic and Computer Related Factors that Predispose User to Get Computer Vision Syndrome. Int J Business Humanities Technol. 2011;1(2):85-91.
Information Technology Professionals Working in Chennai. World J Med Sci. 2014;11(3):312-4. 10. Kowalska M, Zejda JE, Bugajska J, Braczkowska B,
Brozek G, Malinska M. Eye symptoms in office employees working at computer stations. Med Pr. 2011;62:1–8.
11. Ranasinghe P, Wathurapatha WS, Perera YS, Lamabadusuriya DA, Kulatunga S, Jayawardana N, Katulanda P, et al. Computer vision syndrome among computer office workers in a developing
country: an evaluation of prevalence and risk factors. BMC Res Notes. 2016;9:150.