Statistical Downscaling Modeling Through K-means Clustering
Rizka Pitri, Agus M Soleh, Anik DjuraidahDepartment of Statistics, Bogor Agricultural University, Bogor, West Java, Indonesia
ABSTRACT
Statistical downscaling (SD) is a technique used to describe the relationship between data on a global grid (predictor) with data on a local scale grid (response) to translate global-scale anomalies into anomalies of some local climate variables. SD modeling using GCM outcomes involves many independent variables (high correlation). This study used the principal component analysis ( PCA ) and the partial least squares (PLS) to overcome the multicollinearity problems that occured in GCM output data, and used K-means clustering as mediator to minimize variety that occured in GCM data and local rainfall. SD modeling was applied on each group formed for each local rainfall station using principal component regression (PCR) and PLS. This study aims to determine the best model between PCR and PLS in stastistical downscaling by using K-means as mediator for monthly rainfall at four rainfall stations in West Java, Indonesia. The dependent variables used in this study are monthly rainfall data from 2011 to 2018 of four rainfall stations in West Java Province Indonesia and independent variables (global scale) are climate forecast system reanalysis v.2 (CFSRv2) data. This study resulted that the PCA model using K-means clustering as mediator resulted the smaller RMSEP values and the higher correlation values for monthly rainfall in each rainfall station used in this study. RMSEP value has range from 86 to 122 and correlation value has range from 0.82 to 0.94.
Keywords: K-Means, Partial Least Square, Principal Component Regression, Statistical Downscaling
I.
INTRODUCTIONIndonesia is an agrarian country where most of the population of Indonesia has a profession as a farmer. According to BPS 2017 data on fields producing rice, 51.69 percent of rice production is contributed by Java Island where West Java is the second largest province producing 11.373.144 tons of rice with 912.794 ha of land.
Rice production is influenced by genetic factors, climate factors, and environmental factors such as rainfall. The high intensity of rainfall has a great impact on the availability of water to produce rice in Indonesia. The low intensity of rainfall than the availability of water will experience drought,
otherwise if the intensity of rainfall is high than the availability of water will overflow resulting in flooding if the water supply arrangements are not done well. Therefore, information on the intensity of rainfall is very necessary in the agricultural sector, especially for rice farmers to support the success of rice production in Indonesia, especially in West Java, so we need a model of precipitation estimation.
data that has a rough resolution, so it can not yet consider a local-scale region with a higher resolution than GCM output. GCM data can be used to predict localized rainfall using statistical downscaling (SD) techniques.
SD is a technique used to describe the relationship between data on a global grid (predictor) with data on a local scale grid (response) to translate global-scale anomalies into anomalies of some local climate variables [13]. SD modeling using GCM outcomes involves many independent variables (high correlation) data. Multicollinearity can be overcome by several techniques such as dimensional reduction (principal component analysis and partial least square) [10].
Local rainfall data and GCM output data are heterogeneous, so it needs to be grouped to minimize the variety that occurs. Furthermore, according to research by Irvan (2017) about statistical downscaling modeling using linear regression with percentile L1 and percentile L2 to predict rainfall that there are groups formed from local rainfall and GCM output data.
Local rainfall data and GCM are grouped according to similarity measure of precipitation rate, so that local rainfall and GCM which interconnected will be placed in the same group. One efficient grouping algorithm is used for that problem and the amount of large data is the partition clustering (means). K-means aims to divide the observations into cluster where each observation in the cluster is close to the midpoint of the group [6]. K-Means has advantages that are easy to implement, and very efficient in computing especially used in large amounts of data such as GCM output data.
Therefore, in this research we use K-means clustering as a mediator before PCR modeling and PLS so that there will be some groups formed and suspected based on the group formed. The grid used in this study is
. The purpose of this research is to determine the best model between the PCR and PLS in statistical downscaling by using K-means as mediator that SD modeling was applied on each group formed for each local rainfall station using PCR and PLS.
II.
MATERIAL AND METHODA. Material
The data used in this research are local rainfall data as dependent variable and GCM output data as independent variable with period of January 2011 until December 2017. The GCM output data used is monthly rainfall data forecast system reanalysis V.2 (CFSRv2). CFSRv2 is a model that represents the global interaction between waters, land, and Earth's atmosphere. The CFSRv2 data was created by several dozen scientists under guidance from the National Centers for Environmental Prediction (NCEP). The CFSRv2 data set can be downloaded on the site http://cfs.ncep.noaa.gov with the grib2 data file type. The CFSRv2 data parameter used in this study is precipitation rate.
The captured CFSRv2 data is located at 1060E-108.50E longitude and -80S – (-5.50)N latitude with domain grid domains. Each grid is sized , so the independent variable used is 36 covariates. Local rainfall data is the average monthly rainfall data from four rainfall stations in West Java Indonesia, namely Bandung geophysical station, Citeko meteorology station, Bogor climatology station, and Jatiwangi meteorology station. Local rainfall data can
be downloaded at the site
http://dataonline.bmkg.go.id/data_iklim which is the daily data.
B. Method
1. Create the groups with K-Means algorithm for each rainfall station.
K-means is a clustering model that is not directed because it does not have a class label, so in the grouping process does not have a definite group members and objects that enter into certain groups at any time may change [7]. K-means aims to divide the observations into cluster where each observation in the cluster is close to the midpoint of the cluster [6]. The steps of K-Means clustering are as follows:
i. Determine the number of cluster.
ii. Determine the midpoint in each cluster. If denotes the amount of data in a group, denotes the i-th observation in a cluster, and denotes the dimension of the data, then the equation for calculating the center point of the i-th observation is:
∑
iii. Calculate the distance between each object with each nearest midpoint using the Euclidean distance.
( )
√( ) ( ) ( ) ( )
iv. Repeat step (iii), if there is still data moving cluster or there is a change in the midpoint value. This process is carried out until there is no more object transfer between clusters.
v. Repeat steps (i) to (v) with terms k = 2.3, ... 6.
vi. Evaluate the best number of clusters by using the terms of the silhouette index value. The silhouette index is used to see the quality and strength of a group and to know how well the group members are placed in a particular group. The step to find the value of silhouette index is as follows:
- Calculate the value ( ) that is the average distance between an object with all objects that exist in a group
( )
∑ ( )
with is the number of members in a group .
- Calculate the value ( ) which is the minimum value of the average distance between an object with objects that are in other groups
( )
[ ∑ ( )
]
with is the number of members in a group .
- Calculate the silhouette index ( )
( ) ( ) ( ) [ ( ) ( )]
- Calculate global silhouette value
∑ [ ∑ ( )
]
with is the number of groups.
The value of silhouette index has a range from -1 up to 1. If the value of silhouette index is close to -1, then it can be interpreted that the average value of the object is close to the other group compared with other members who are in one group. If the value of the silhouette index is close to 1, then it can be interpreted that the mean distance to the group itself is significantly smaller than the distance to the other group. While the value of the silhouette index is 0 or close to 0 means that there is an object whose position is on the boundary between two groups [1].
2. Create a model using the principal component regression (PCR) for each group at each rainfall station.
component (PC) [5]. PC is formed based on the covariance matrix or correlation matrix. The formation of PC is based on the covariance matrix when the unit of measurement of each variable is the same, while the correlation matrix if the unit of measurement is not the same. Steps of PCA as follows:
i. Form a covariance matrix.
ii. Form all the principal components that will be used as new independent variables.
iii.Calculate the principal component scores for each observation. The score component can be calculated as follows [4]
with is the i-th score principal component, is the i-th eigen vector, and is a matrix of independent variable.
iv.Determine the number of PC based on the eigen value that is greater than one and based on the scree plot. Selection of PC as much by using a scree plot if a point of plot is skewed to the left or in other words the difference between the eigen value in sequence is no longer large.
The score component obtained from the third step (iii) will be used on regression method with the dependent variable (local rainfall) for each rainfall station. The Principal component regression (PCR) model of the reduction results into components is as follows [9]:
with ( ) is a error matrix , is a independent variable matrix ( ) , is a dependent variable vector , is an intercept, is a one-sized vector , is a PC matrix , and is a coefficient vector of PC .
3. Create a model using the partial least square (PLS) for each group at each rainfall station.
The difference of Partial Least Square (PLS) with PCA is that the components are not only formed based on independent variables, but are formed as linear combinations of independent variables having maximum variability with linear combination of dependent variables. PLS looks for a linear decomposition of in the following way:
which:
: component matrix : loading matrix : indentity matrix : error matrix
The error matrix , represents how much that does not decompose into a component and latent matrix . Regression model for PLS is:
( )
because , so the above equation becomes as follows:
( )
( )
which:
: regression coefficient vector : weighted matrix
: error vector
The error vector , represents how much that is not explained by the component matrix [8]. The basic algorithm of the PLS regression was developed by Wold et.al (1984). In the PLS algorithm , there are two data matrices, and . Before the PLS
algorithm begins, the two matrices must be standardized first or centered. Standardization can use mean centered matrices i.e. ̅ and
i. Initialization . is the number of components that are formed.
ii. Calculate the weights ,
‖ ‖.
iii. Calculate component vectors ,
iv. Calculate the laten by regressing with ,
.
v. Calculate by regressing with , ̂ .
vi. Calculate error matrix for and ,
dan ̂ .
vii. Select the number of components used in the model.
viii. Change the shape of the matrix, and , into vector columns, and .
ix. Estimate the PLS variable, ̂ ( ) ̂.
4. Evaluate the best model based on the RMSEP (Root Mean Square Error Prediction) value and the correlation (r) for each group at each rainfall station.
III.
RESULTS AND DISCUSSIONA. K-Means Clustering
Local rainfall data used in this study is the monthly average data of rainfall Jatiwangi climatology station, Bandung geophysical station, Bogor climatology station, and Citeko meteorology station. Local rainfall at each local station has varying precipitation rate. This happens because there are physical factors that occur in the Indonesia, such as the position of latitude, altitude, wind patterns, spreading land and water, and mountains and high mountains. Differences of precipitation rate that occurred around the area of Jatiwangi climatology station, Bandung geophysical station, Bogor climatology station, and Citeko meteorology station, then done by using the K-Means algorithm. The optimal number of groups formed by
the K-Means algorithm for each local rainfall station based on the silhouette value is presented in Table 4.1.
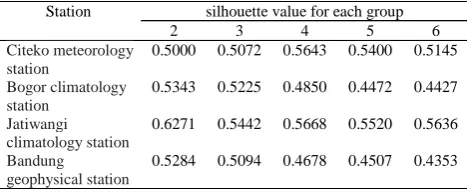
Table 4.1 : The silhouette value of K-means algorithm for each group for each rainfall station
B.
The optimal number of groups formed using the K-Means algorithm for each rainfall station based on the largest silhouette value in Table 4.1 were the Citeko meteorology station formed four groups with silhouette value 0.5643, Bogor climatology station formed two groups with silhouette values 0.5343, Jatiwangi meteorology station formed two groups with silhouette value 0.6271, and Bandung geophysical station formed two groups with silhouette value 0.5284. In this study, the number of groups used at Citeko meteorology stations was as many as three groups. If the number of groups are more than three that will form a group consisting only one member, so it will not be able to be analyzed in the next step.
B. Principal Component Regression (PCR) and Partial Least Square (PLS)
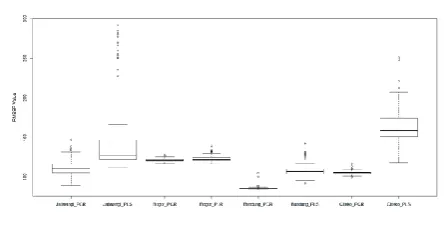
After grouping of observations using K-Means algorithm on each station, then make a model using PCR and PLS. Determination of best model applied between PCR and PLS at SD for local rainfall at Jatiwangi climatology station, Bandung geophysical station, Bogor climatology station and Citeko meteorology station and CFSRv2 is with the lower RMSEP value and higher correlation value. The distribution of RMSEP values with 36 covariates for PCR and PLS models at each rainfall station using K-means as mediator is presented in Figure 4.1.
Station silhouette value for each group
2 3 4 5 6
Citeko meteorology station
0.5000 0.5072 0.5643 0.5400 0.5145
Bogor climatology station
0.5343 0.5225 0.4850 0.4472 0.4427
Jatiwangi climatology station
0.6271 0.5442 0.5668 0.5520 0.5636
Bandung geophysical station
The distribution of RMSEP values for PCR models with K-means as mediator from all rainfall stations has a range from 70 up to 150, while the RMSEP value for the PLS model has a range from 90 up to 300. Based on Figure 4.1 the distribution of RMSEP values using the PLS model has a relatively large distribution if compared with the distribution of RMSEP values using the PCR model. The distribution of RMSEP value of rainfall values using PCR model and PLS around bandung geophysical station is relatively small compared to other rainfall stations. The form of distribution of RMSEP value using PLS model for rainfall around bogor climatology station and bandung geophysical station have a relatively symmetric distribution. Based on Figure 4.1, the PCR and PLS models do not provide a stable variety and stable mean value of rainfall for each rainfall station.
Table 4.2: RMSEP values for each model using K- means as mediator for each rainfall station
The RMSEP value for the estimator of PCR and PLS model using K-means as mediator in each rainfall station is presented in Table 4.2. The RMSEP value for each rainfall station obtained using the PCR model obtaining a smaller RMSEP value than the PLS model. It can be concluded that the estimated value of rainfall obtained using the PCR model is closer to the actual rainfall value than the PLS model and the model estimation using PCR is better than the PLS. The smallest RMSEP value generated using the PCR model is obtained from the rainfall in the area of Bandung geophysical station.
K-means as mediator result a smaller RMSEP values than without using clustering as mediator. It can be concluded that using K-means algorithm as mediator can minimize RMSEP value on SD for CFSRv2 data and local rainfall data for Jatiwangi climatology station, Bandung geophysical station, Bogor climatology station and Citeko meteorology.
The best model performance is shown with lower RMSEP values and higher correlation values [2]. The correlation value between actual rainfall value and rainfall value for each rainfall station is presented in Table 4.3. Table 4.3 shows that the correlation between actual rainfall value and estimated of rainfall value that obtained by using RKU model with K-means clustering as mediator obtaining the higher correlation value than PLS model.
Figure 4.1 : Distribution of RMSEP for PCR and PLS model with K-means as mediator at each rainfall station
Tabel 4.3: Correlation value for each model by using K-means clustering as mediator in each rainfall station
Station Clustering Correlation
PCR PLS
Citeko meteorology station Without clustering 0.838 0.822
K-means 0.933 0.837
Bogor climatology station Without clustering -0.304 -0.118
K-means 0.842 0.816
Jatiwangi climatology station Without clustering 0.88 0.839
K-means 0.820 0.711
Bandung geophysical station
Without clustering 0.554 0.561
K-means 0.838 0.736
Station Clustering RMSEP
PCR PLS
Citeko meteorology station Without clustering
137.384 128.362
K-means 105.696 162.136
Bogor climatology station Without clustering
204.521 201.265
K-means 121.208 123.500
Jatiwangi climatology station
Without clustering
114.092 114.464
K-means 111.604 153.331
Bandung geophysical station
Without clustering
100.672 101.467
The correlation values obtained using K-means clustering as mediator resulted a higher correlation value than the correlation value that resulted by without using clustering. The resulting correlation value using K-means clustering as mediator has a range from 0.71 up to 0.94, the other words is that there is a strong positive relationship between the actual rainfall value and the estimated rainfall value generated by the PCR and PLS model. When the actual rainfall value in 2011 to 2017 is increases, then the estimated value of rainfall obtained using the PCR and PLS model will also have the same trend pattern.
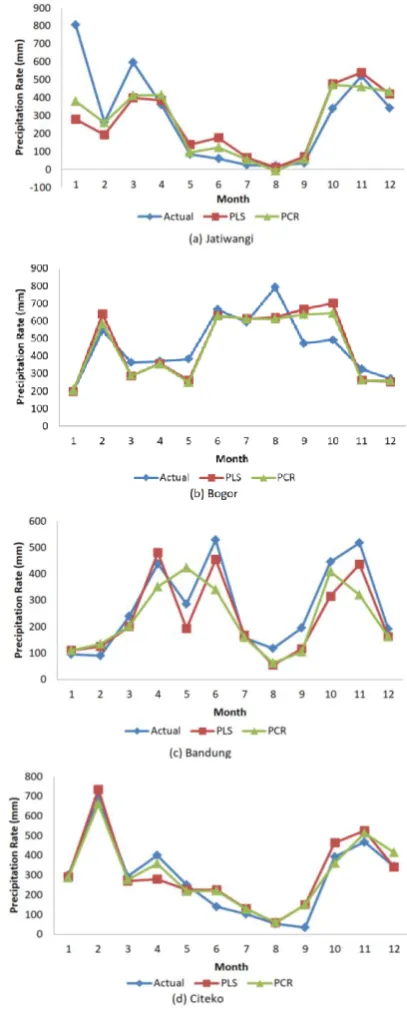
The predicted rainfall value at citeko meteorology station that is produced using PCR model with K-means as mediator gives relatively same value as the actual rainfall value. This can be seen in Figure 4.3 with the curve distance between the actual rainfall value and the predicted rainfall value using PCR has a very close distance compared to the result of the predicted rainfall generated by the PLS model. Furthermore, the pattern of movement of the predicted rainfall produced by PCR model is able to follow the same pattern of movement with the actual rainfall value in Citeko meteorology station. As for the movement of the results of rainfall prediction in the other three rainfall stations produce a movement pattern that is relatively same as the actual rainfall value, although there are several months that the pattern of movement of the predicted rainfall obtained using PCR and PLS model have a long distance with the pattern actual rainfall value movements. This can be seen as an example in Figure 4.2 for Jatiwangi meteorology station, when the first month of rainfall prediction result using PCR and PLS model have a very long distance with actual rainfall value.
Figure 4.2 : Graph of actual and predicted rainfall value use K-means as mediator at each rainfall station.
IV.
CONCLUSIONand a higher correlation value than without using grouping. In this research, it can be concluded that the principal component regression method with K-means clustering as mediator is a best method used in SD especially in monthly rainfall in four rainfall stations in West Java Province, Indonesia.
Acknowledgements. The author would like to thank to the Indonesia Endowment Fund for Education (LPDP) who has provided “Indonesian Education Scholarship 2016” in the Department of Statistics FMIPA Bogor Agricultural University Indonesia.
V.
REFERENCES[1] Brun M, Sima C, Hua J, Lowey J, Carroll B, Suh E, and Dougherty ER. Model-based evaluation of clustering validation measures. Pattern Recognition Society, Vol:40, 807–824, 2007. [2] Estiningtyas W, Wigena A.H. Teknik Statistical
Downscaling dengan Regresi Komponen Utama dan Regresi Kuadrat Terkecil Parsial untuk Prediksi Curah Hujan pada Kondisi El Nino, La Nina, dan Normal . Journal of Meteorology and Geofisika, Vol. 12, No. 1, 65–72, 2011.
[3] Irvan M. Statistical downscaling modeling using linear regression with percentile L1 and percentile L2 to predict rainfall. IPB, 2017. [4] Johnson R.A., Winchern D.W., “Applied
Mulivariate Statistical Analysis”, 6th ed, United State of America, Pearson Education, Inc., 2007. [5] Marcus G.L., Wattimanela H.J., Lesnussa Y.A.
Principal component regression analysis for solving multicorrelation in multivariate regression analysis ( A study case: rainfall in Ambon 2010). Journal of Barekeng, Vol. 6, No.1, 31–40, 2012.
[6] Narang B, Verma P, Kochar P. Application based, advantageous K-means clustering algorithm in data mining: a review. International Journal of Latest Trends in Engineering and Technology, Vol. 7, No. 2, 121–126, 2016.
[7] Nurhasanah S. Climate regionalization and
agro-climatic zone: planting calendar in subang district. IPB, 2017.
[8] Nurhayati. Principal component regression, partial least square, and lasso methods on poverty data result of susenas 2012. IPB, 2014.
[9] Wigena, A.H., Djuraidah A, Sahriman S. Statistical downscaling dengan pergeseran waktu berdasarkan korelasi silang. Jurnal Meteorologi dan Geofisika, Vol. 16, No. 1, 19–24, 2015.
[10] Soleh A.M., Wigena A.H., Djuraidah A, Saefuddin A. Statistical downscaling to predict monthly rainfall using linear regression with L1 regularization ( lasso ) regression. Hikari Ltd, Vol. 9, No. 108, 5361–5369, 2015
[11] Trzaska S, Schnarr E. A review of downscaling methods for climate change projections. United States Agency for International Development by Tetra Tech ARD, 1–42, 2014
[12] Wigena A.H. Multi response partial least square for statistical downscaling. Proceeding Scientific Journal Club, Vol. 16, No. 2, 12–15, 2011.
[13] Zorita E, Storch H. The analog method as a
simple statistical downscaling