R E S E A R C H A R T I C L E
Open Access
Heterogeneous pattern of differences in
respiratory parameters between elderly
with either good or poor FEV
1
Stefan Karrasch
1,2,4*, Jürgen Behr
3,4, Rudolf M. Huber
4,5, Dennis Nowak
2,4, Annette Peters
6, Stefan Peters
2,
Rolf Holle
7, Rudolf A. Jörres
2,4, Holger Schulz
1,4and KORA Study Group
Abstract
Background:The relationship of spirometric values to other respiratory and functional parameters in advanced age is not well studied. We assessed this relationship in elderly subjects with either good or poor spirometric parameters to reveal whether different domains of lung function show comparable differences between the two groups.
Methods:Among subjects of the population-based KORA-Age cohort (n= 935, 65-90y; 51% male) two groups were selected from either the lower (LED;n= 51) or the upper (UED;n= 72) end of the FEV1distribution. All subjects did not have a history of lung disease and were non-smokers at the time of the study. Measurements included spirometry, body plethysmography, diffusing capacity for NO and CO, respiratory pump function and exhaled NO (FeNO). In addition, 6-min walking distance as a functional overall measure, as well as telomere length of blood leukocytes and serum
8-hydroxydeoxyguanosine (8-OHdG) as potential markers of overall biological ageing and stress were determined. Results:In the majority of parameters, LED subjects showed significantly impaired values compared to UED subjects. Differences in spirometric parameters, airway resistance and respiratory pump function ranged between 10% and more than 90% in terms of predicted values. In contrast, volume-related CO and NO diffusing capacity showed differences between groups of lower than 5%, while telomere length, 8-OHdG and FeNO were similar. This was reflected in the differences in“functional age”as derived from prediction equations.
Conclusions:In elderly subjects without a history of lung disease differences in spirometric parameters were associated with differences in other lung-mechanical parameters including body plethysmography but not with differences in volume-corrected gas exchange measures. Thus, the concept of a general“lung age”as suggested by the widespread use of this term in connection with spirometry should be considered with caution.
Keywords:Spirometry, Diffusing capacity, Body plethysmography
Background
In advanced age, spirometric indices show a large inter-individual variability within the general population even after accounting for age and determinants like sex, height and ethnicity, and for several parameters the coefficient of variation even increases with age [1]. The relationship
between the functional indices as measured in the same lung-healthy subjects has not been extensively studied. This is of interest since low spirometric values are often used as an indicator of a reduced functional state of the whole respiratory system, particularly by deriving an esti-mated“lung age”e.g. to support smoking cessation [2]. In fact, however, it is unclear whether this notion is adequate in the sense that various functional parameters of the lung show low values. This would have to be expected with a common process of biological aging or premature aging. To answer this question a comparison of different domains of parameters is needed. Ideally, this requires a logitudinal analysis but at least the comparison of different
* Correspondence:[email protected]
1Institute of Epidemiology I, Helmholtz Zentrum München - German
Research Center for Environmental Health, Ingolstaedter Landstrasse 1, D-85764 Neuherberg, Germany
2Institute and Outpatient Clinic for Occupational, Social and Environmental
Medicine, Ludwig-Maximilians-Universität, Ziemssenstrasse 1, 80336 Munich, Germany
Full list of author information is available at the end of the article
functional domains should be possible in a sample of age-matched elderly subjects.
We therefore investigated in subjects of advanced age who were free of lung disease according to their clinical history, whether various functional indices show parallel differences indicative of a general state of the respiratory system that could be related to aging. For this purpose we analyzed the relationships between forced expiratory volume in 1 s (FEV1), static lung volumes, airway
conductance, respiratory pump function, pulmonary gas exchange, exhaled biomarkers, systemic oxidative stress and cell-biological age, as well as general physical capacity. The study population comprised two sub-groups of the KORA-Age cohort who had been selected based on their percent predicted values of FEV1 either
being at the upper or the lower end of the distribution.
Methods
Spirometry was performed in the KORA study center (Augsburg, Germany) within the frame of the KORA-Age study conducted in 2009–10 [3]. The study was ap-proved by the Ethics Committee of the Bavarian Medical Association, and its details have been described previ-ously [4]. Briefly, in 935 individuals aged 65–90 years from the Augsburg region spirometric measurements were performed in line with ATS/ERS recommendations [5], and 840 subjects gave their written consent to be contacted to participate in the current sub-study, for which 200 individuals were selected from the upper and lower tails of the FEV1%pred distribution based on
refer-ence equations of the lung-healthy population of the Augsburg region [4]. Subjects were further examined at the University Hospital of the Ludwig-Maximilians-Universität in Munich: 104 with high (upper end of distribution, UED) and 96 with low (lower end of distribution, LED) FEV1%pred. The examination focused
on the respiratory system but also covered biomarkers and physical capacity. For the present analysis, current smokers and subjects with symptoms of chronic bron-chitis or a respiratory infection within 3 weeks prior to examination were excluded. Non-smoking status was defined via self-report; additionally an exhaled carbon monoxide value of < 7 ppm was required [6]. These criteria led to an analysis sample of n= 72 (69% of total) in the upper and n= 51 (53%) in the lower group.
A detailed description of the methods is given in Additional file 1. According to current guidelines, the following assessments were performed and parameters obtained: spirometry (FEV1, FVC, expiratory flow rates)
[5], body plethysmography (airway conductance (Gaw), specific airway conductance (sGaw), total lung capacity (TLCpleth), intrathoracic gas volume (ITGV), residual
volume (RV)) [7, 8], determination of CO and NO
uptake of the lung (transfer factors TLCO, TLNO, trans-fer coefficients KCO, KNO; alveolar volume (VA), TLC by helium dilution (TLCHe)) [9], measurements of
mouth occlusion pressure (0.1 s after the onset of tidal inspiration (P01), peak maximal static inspiratory mouth occlusion pressure (PImax)) [10], exhaled carbon mon-oxide (eCO) and exhaled nitric mon-oxide at 50 ml/s (FeNO) [11]. Furthermore, a 6-min walk test was performed [12]. The telomere length of circulating leukocytes [13] and the serum level of 8-hydroxydeoxyguanosine (8-OHdG) were assessed from samples collected in the KORA study centre in Augsburg.
Data analysis
Group comparisons were performed as Student’s t-test if not stated otherwise. The robustness of results was tested with analysis of covariance (ANCOVA) and differ-ent confounders. Similarly, the associations of the func-tional indices with telomere length or 8-OHdG were examined using multiple linear regression analysis, with chronological age and sex as confounders. Statistical analyses were done using the software packages Statgraphics (Statpoint Technologies, Inc., Warrenton, VA) and SPSS Statistics 23 (IBM Corp., Armonk, NY, USA). Statistical significance was assumed at a level of 0.05.
For the different lung function indices and 6MWD the following reference values were used: Quanjer et al. for spirometric parameters [1], Koch et al. for plethysmo-graphic parameters [14], van der Lee et al. for pulmonary gas exchange [15], Enright et al. for PImax [16], and Enright & Sherrill for 6MWD [17].
Results
Baseline characteristics
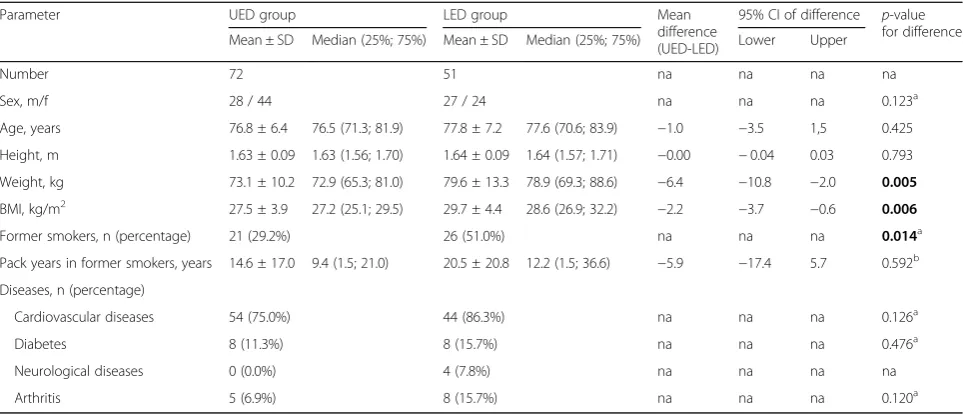
The anthropometric characteristics of the two study groups are given in Table 1. There were no significant differences between UED and LED subjects regarding age, height and sex. However, the percentage of former smokers was higher in the LED group; in former smokers the number of pack years showed a tendency to be higher in the LED vs. UED group, but without statis-tically significant difference. Weight and body mass index (BMI) were slightly higher in the LED group (p< 0.01 each). The prevalences of cardiovascular diseases, diabetes and arthritis were similar; neuro-logical diseases were only present in 4 subjects of the LED group.
Spirometry
Data on spirometry are given in Table 2. Corresponding to the selection criterion for the groups, LED subjects showed lower mean FEV1 and FVC (difference of
predicted values between groups Δ= 39.4%pred and
a lower FEV1/FVC ratio (Δ= 10.7%). If the LLN criterion
for FEV1/FVC [18] was applied, 37.3% of subjects from
the LED group showed airflow limitation, in the absence of respiratory symptoms or a history of respiratory disease.
Body plethysmography
sGaw and Gaw in terms of %predicted were different between both groups (p < 0.001 each; Table 3). In 13.8% of subjects (31.4% LED, 1.4% UED) sGaw was below the 5th percentile [14]. TLCpleth was lower (Δ= 10.9%pred) in
LED subjects (p< 0.001), whereas no significant differ-ences occurred for RV and ITGV. RV/TLCplethand ITGV/
TLCpleth were higher (Δ= 14.0%pred and Δ= 10.3%pred,
respectively;p< 0.001 each) in the LED group (Table 3).
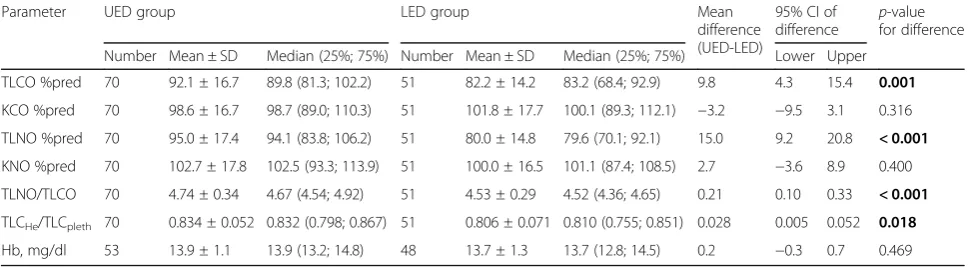
CO and NO uptake of the lung
The transfer factors TLCO (p < 0.001), TLNO (p < 0.001) and the ratio TLNO/TLCO (p < 0.001) were lower in the LED group, whereas no significant differences occurred for the transfer coefficients TLCO/VA (KCO) and TLNO/ VA (KNO) (Table 4). There were also significant differ-ences regarding the ratio TLCHe/TLCpleth with higher
values in the UED subjects (p< 0.05). Haemoglobin levels for which CO transfer factors were corrected did not sig-nificantly differ between LED and UED subjects.
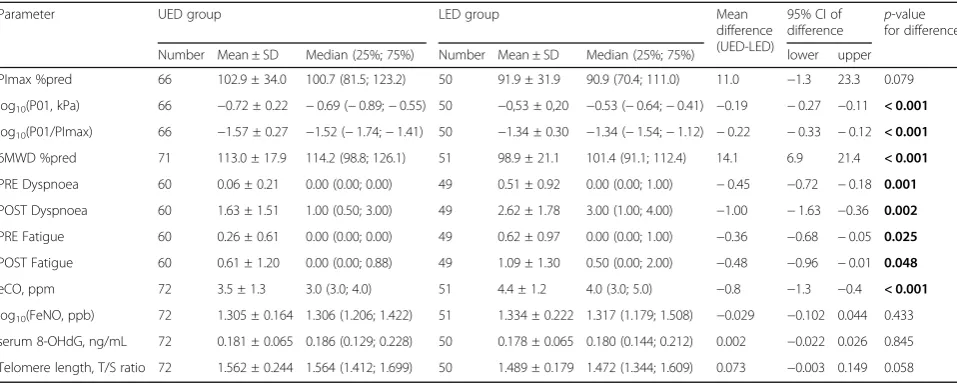
Respiratory pump function, 6-min-walk distance and biomarkers
PImax was lower in LED subjects (Δ= 11.0%pred), while P01 and P01/PImax were higher (p< 0.001 each; Table 5). Table 1Characteristics of the study population
Parameter UED group LED group Mean
difference (UED-LED)
95% CI of difference p-value for difference
Mean ± SD Median (25%; 75%) Mean ± SD Median (25%; 75%) Lower Upper
Number 72 51 na na na na
Sex, m/f 28 / 44 27 / 24 na na na 0.123a
Age, years 76.8 ± 6.4 76.5 (71.3; 81.9) 77.8 ± 7.2 77.6 (70.6; 83.9) −1.0 −3.5 1,5 0.425
Height, m 1.63 ± 0.09 1.63 (1.56; 1.70) 1.64 ± 0.09 1.64 (1.57; 1.71) −0.00 −0.04 0.03 0.793
Weight, kg 73.1 ± 10.2 72.9 (65.3; 81.0) 79.6 ± 13.3 78.9 (69.3; 88.6) −6.4 −10.8 −2.0 0.005
BMI, kg/m2 27.5 ± 3.9 27.2 (25.1; 29.5) 29.7 ± 4.4 28.6 (26.9; 32.2) −2.2 −3.7 −0.6 0.006
Former smokers, n (percentage) 21 (29.2%) 26 (51.0%) na na na 0.014a
Pack years in former smokers, years 14.6 ± 17.0 9.4 (1.5; 21.0) 20.5 ± 20.8 12.2 (1.5; 36.6) −5.9 −17.4 5.7 0.592b
Diseases, n (percentage)
Cardiovascular diseases 54 (75.0%) 44 (86.3%) na na na 0.126a
Diabetes 8 (11.3%) 8 (15.7%) na na na 0.476a
Neurological diseases 0 (0.0%) 4 (7.8%) na na na na
Arthritis 5 (6.9%) 8 (15.7%) na na na 0.120a
a
Chi-Square test,bMann-Whitney U test
p-values below 0.05 are shown in bold
Table 2Spirometric parameters
Parameter UED group LED group Mean
difference (UED-LED)
95% CI of difference
p-value for difference
Number Mean ± SD Median (25%; 75%) Number Mean ± SD Median (25%; 75%) Lower Upper
FEV1%pred 72 124.9 ± 10.3 124.6 (116.9; 131.4) 51 85.5 ± 10.9 85.1 (77.1; 91.4) 39.4 35.5 43.3 < 0.001 FVC %pred 72 127.2 ± 10.9 129.8 (119.3; 134.4) 51 101.8 ± 13.0 102.0 (95.6; 108.8) 25.4 21.0 29.8 < 0.001
FEV1/FVC %pred 72 97.5 ± 6.2 97.7 (92.7; 102.3) 51 83.9 ± 10.4 84.4 (78.3; 91.0) 13.6 10.4 16.9 < 0.001 FEF25–75%pred 72 124.7 ± 34.8 120.4 (99.3; 148.8) 49 56.1 ± 23.6 49.2 (39.5; 65.0) 69.8 59.3 80.2 < 0.001 FEF75%pred 72 168.0 ± 66.3 159.7 (118.3; 204.9) 49 74.1 ± 39.5 65.5 (49.2; 86.8) 93.9 74.8 113.0 < 0.001 FEV1 z-score 72 1.465 ± 0.587 1.433 (0.991; 1.862) 51 −0.819 ± 0.610 −0.847 (−1.288;−0.527) 2.284 2.068 2.500 < 0.001
FVC z-score 72 1.514 ± 0.579 1.629 (1.124; 1.889) 51 0.101 ± 0.728 0.112 (−0.270; 0.524) 1.413 1.180 1.647 < 0.001
FEV1/FVC z-score 72 −0.221 ± 0.579 −0.200 (−0.654; 0.230) 51 −1.389 ± 0.857 −1.349 (−1.953;−0.798) 1.168 0.911 1.424 < 0.001 FEF25–75z-score 72 0.479 ± 0.702 0.451 (−0.014; 0.990) 49 −1.229 ± 0.721 −1.343 (−1.721;−0.955) 1.709 1.448 1.969 < 0.001 FEF75z-score 72 0.697 ± 0.614 0.752 (0.274; 1.108) 49 −0.658 ± 0.750 −0.659 (−1.147;−0.241) 1.355 1.109 1.602 < 0.001 FEV1/FVC 72 0.749 ± 0.048 0.752 (0.713; 0.785) 51 0.642 ± 0.079 0.652 (0.595; 0.697) 0.107 0.082 0.132 < 0.001
Reference values were calculated according to Quanjer et al. [1]
LED subjects had a lower 6MWD (Δ= 14.1%pred) than UED subjects (p < 0.001). Moreover, baseline values of perceived fatigue and dyspnoea during the walk test were higher in LED subjects (p= 0.001 and p= 0.025, respectively; Table 5).
No significant differences between both groups were found for FeNO (Table 5). eCO was slightly higher (Δ= 0.8 ppm) in LED versus UED subjects (p < 0.001). For 8-OHdG no significant difference between groups was observed. The same was true for telomere length but there was a tendency towards shorter telomeres in LED subjects (p= 0.058).
Correlation of functional indices with biomarkers
In multiple regression analyses including all subjects, no significant relationships between lung function indices and telomere length or 8-OHdG levels were found, except for a positive association between RV/TLC and telomere length (p= 0.048).
Discussion
In the present study we compared two subgroups from a larger population-based cohort which were selected to show FEV1either at the lower end (LED) or the upper
end (UED) of the distribution in the whole cohort. These subgroups were selected to be lung-healthy according to clinical history, symptoms and risk factors. The broad set of parameters allowed to compare the two groups regarding a number of functional domains. Deteriora-tions in spirometric values are sometimes interpreted as indicators of premature aging of the lung [2] but it is not clear whether these reflect a general respiratory status that would justify the terminology of an individual (overall) “lung age”. The adequacy of this notion can only be evaluated by comparison of a broad panel of lung function parameters, preferentially in a longitudinal cohort. However, the comparison between parameters should also be possible in carefully selected individuals of a cross-sectional analysis. Our study was suited for such a comparison, as it comprised spirometry, body plethysmography, transfer factors for CO and NO, and respiratory pump function. Additionally, telomere length of peripheral blood leukocytes and 8-OHdG were included as markers of biological age and stress.
We found a difference of about 40% predicted FEV1
between the LED and UED group. This was the result of the definition of both groups but nonetheless reflected the huge difference in FEV1 even among lung-healthy Table 3Body plethysmographic parameters
Parameter UED group LED group Mean
difference (UED-LED)
95% CI of difference
p-value for difference
Number Mean ± SD Median (25%; 75%) Number Mean ± SD Median (25%; 75%) Lower Upper
TLCpleth%pred 72 113.2 ± 11.9 115.9 (104.8; 122.2) 51 102.3 ± 12.4 102.6 (94.4; 112.2) 10.9 6.5 15.4 < 0.001
RV %pred 72 94.4 ± 16.7 96.6 (82.9; 103.5) 51 99.7 ± 18.5 102.5 (92.1; 110.5) −5.3 −11.8 1.1 0.104
RV/TLCpleth%pred 72 84.9 ± 9.4 85.2 (78.1; 91.7) 51 98.9 ± 11.9 98.0 (91.2; 108.0) −14.0 −18.0 −10.0 < 0.001
ITGV %pred 72 99.7 ± 18.8 100.4 (85.8; 110.2) 51 101.3 ± 19.5 101.1 (86.2; 118.0) −1.6 −8.5 5.4 0.656
ITGV/TLCpleth%pred 72 83.8 ± 9.0 83.1 (76.8; 89.9) 51 94.1 ± 10.4 93.8 (86.9; 102.1) −10.3 −13.9 −6.7 < 0.001
GAW %pred 72 125.7 ± 40.1 121.0 (97.8; 145.3) 51 77.2 ± 36.1 70.2 (52.0; 97.6) 48.6 34.8 62.3 < 0.001
sGAW %pred 72 138.4 ± 42.1 134.6 (112.8; 153.2) 51 88.3 ± 47.7 84.2 (62.3; 107.7) 50.0 33.5 66.5 < 0.001
Reference values were calculated according to Koch et al. [14]
p-values below 0.05 are shown in bold
Table 4Parameters of the diffusing capacity for CO and NO
Parameter UED group LED group Mean
difference (UED-LED)
95% CI of difference
p-value for difference
Number Mean ± SD Median (25%; 75%) Number Mean ± SD Median (25%; 75%) Lower Upper
TLCO %pred 70 92.1 ± 16.7 89.8 (81.3; 102.2) 51 82.2 ± 14.2 83.2 (68.4; 92.9) 9.8 4.3 15.4 0.001
KCO %pred 70 98.6 ± 16.7 98.7 (89.0; 110.3) 51 101.8 ± 17.7 100.1 (89.3; 112.1) −3.2 −9.5 3.1 0.316
TLNO %pred 70 95.0 ± 17.4 94.1 (83.8; 106.2) 51 80.0 ± 14.8 79.6 (70.1; 92.1) 15.0 9.2 20.8 < 0.001
KNO %pred 70 102.7 ± 17.8 102.5 (93.3; 113.9) 51 100.0 ± 16.5 101.1 (87.4; 108.5) 2.7 −3.6 8.9 0.400
TLNO/TLCO 70 4.74 ± 0.34 4.67 (4.54; 4.92) 51 4.53 ± 0.29 4.52 (4.36; 4.65) 0.21 0.10 0.33 < 0.001
TLCHe/TLCpleth 70 0.834 ± 0.052 0.832 (0.798; 0.867) 51 0.806 ± 0.071 0.810 (0.755; 0.851) 0.028 0.005 0.052 0.018
Hb, mg/dl 53 13.9 ± 1.1 13.9 (13.2; 14.8) 48 13.7 ± 1.3 13.7 (12.8; 14.5) 0.2 −0.3 0.7 0.469
Reference values were calculated according to van der Lee et al. [15]
elderly subjects. The differences in FVC and in FEV1/
FVC were smaller. On the other hand, those of the FEFs as well as airway conductance and specific airway con-ductance were even larger. The scales of these parame-ters were comparable with each other, since airway conductance was chosen instead of resistance and impairment was always associated with a reduction towards zero. The comparison with the differences in plethysmo-graphic volume parameters was less straightforward, since in principle, although not in practice, there is no upper bound of these parameters and no commonly accepted transformation analogous to conductance. Based on the differences in scale and physiologically possible range, it is understandable that the volume parameters showed smaller differences between the two groups.
In contrast, NO and CO transfer factors also decrease upon impairment, having zero as lower bound, and are in this respect comparable to the spirometric and airway conductance parameters. Despite this similarity the differences between LED and UED groups were only about 10% in case of TLCO and about 15% in case of TLNO. Both of these parameters involve lung volume, therefore the transfer coefficients which in first order correct for volume are of particular interest, as CO diffusing capacity is sensitive to changes pulmonary ca-pillary blood volume and NO diffusing capacity to those of the diffusion barrier. Both are likely to be affected by aging processes, thus a general aging of the lung should also have effects.
Remarkably, however, the differences in KCO and KNO between the two groups were small and not significantly different from zero indicating that the differences in transfer factors were primarily due to differences in volume, i.e. of lung-mechanical nature.
KCO values were also similar when using the reference values by Garcia-Rio et al. [19] for KCO (84.4%pred in UED vs. 82.9%pred in LED subjects). Moreover, the 95%-confidence intervals for the differences in transfer factors and coefficients did not overlap with those of FEV1%pred and FVC%pred as well as airway conductance.
There were no significant differences in Hb values which might have influenced the values of the CO transfer factor despite the correction for Hb. The differences in PImax they were lower than those of FEV1 and sGAW, which
showed values in a range of 30%pred or more, but still beyond 10%pred and larger than those of transfer coeffi-cients KCO and KNO. Overall, these observations indicated a marked difference between the lung-mechanical and gas uptake domains. Regarding the concept of a general “lung age” our observations suggest that a differentiated descrip-tion of funcdescrip-tional domains is more adequate.
The difference in 6MWD between the LED and UED group was between those of mechanical and gas exchange parameters. Dyspnoea and fatigue scores could not be scaled as percent predicted, therefore their differ-ences were not directly comparable to the other parame-ters. Still, the fact that they differed between the two groups, in terms of pre and post values, indicated a greater 6MWD and at the same time lower dyspnoea and fatigue in subjects of the UED group.
FeNO was included as it might indicate eosinophilic airway inflammation if elevated, or oxidative stress if decreased, but no significant differences were found. There was a small difference regarding eCO despite the fact that we had excluded current smokers and subjects with values > 6 ppm. The source of this small difference might be unreported active or passive smoking, or endogenous production related to oxidative stress [20]. Table 5Parameters of respiratory pump function, exercise capacity and biomarkers
Parameter UED group LED group Mean
difference (UED-LED)
95% CI of difference
p-value for difference
Number Mean ± SD Median (25%; 75%) Number Mean ± SD Median (25%; 75%) lower upper
PImax %pred 66 102.9 ± 34.0 100.7 (81.5; 123.2) 50 91.9 ± 31.9 90.9 (70.4; 111.0) 11.0 −1.3 23.3 0.079
log10(P01, kPa) 66 −0.72 ± 0.22 −0.69 (−0.89;−0.55) 50 −0,53 ± 0,20 −0.53 (−0.64;−0.41) −0.19 −0.27 −0.11 < 0.001 log10(P01/PImax) 66 −1.57 ± 0.27 −1.52 (−1.74;−1.41) 50 −1.34 ± 0.30 −1.34 (−1.54;−1.12) −0.22 −0.33 −0.12 < 0.001 6MWD %pred 71 113.0 ± 17.9 114.2 (98.8; 126.1) 51 98.9 ± 21.1 101.4 (91.1; 112.4) 14.1 6.9 21.4 < 0.001
PRE Dyspnoea 60 0.06 ± 0.21 0.00 (0.00; 0.00) 49 0.51 ± 0.92 0.00 (0.00; 1.00) −0.45 −0.72 −0.18 0.001
POST Dyspnoea 60 1.63 ± 1.51 1.00 (0.50; 3.00) 49 2.62 ± 1.78 3.00 (1.00; 4.00) −1.00 −1.63 −0.36 0.002
PRE Fatigue 60 0.26 ± 0.61 0.00 (0.00; 0.00) 49 0.62 ± 0.97 0.00 (0.00; 1.00) −0.36 −0.68 −0.05 0.025
POST Fatigue 60 0.61 ± 1.20 0.00 (0.00; 0.88) 49 1.09 ± 1.30 0.50 (0.00; 2.00) −0.48 −0.96 −0.01 0.048
eCO, ppm 72 3.5 ± 1.3 3.0 (3.0; 4.0) 51 4.4 ± 1.2 4.0 (3.0; 5.0) −0.8 −1.3 −0.4 < 0.001
log10(FeNO, ppb) 72 1.305 ± 0.164 1.306 (1.206; 1.422) 51 1.334 ± 0.222 1.317 (1.179; 1.508) −0.029 −0.102 0.044 0.433 serum 8-OHdG, ng/mL 72 0.181 ± 0.065 0.186 (0.129; 0.228) 50 0.178 ± 0.065 0.180 (0.144; 0.212) 0.002 −0.022 0.026 0.845
Telomere length, T/S ratio 72 1.562 ± 0.244 1.564 (1.412; 1.699) 50 1.489 ± 0.179 1.472 (1.344; 1.609) 0.073 −0.003 0.149 0.058
Reference values were calculated according to Enright et al. [16] for PImax and according to Enright and Sherrill [17] for 6MWD
However, serum 8-OHdG, as an indicator of systemic oxidative stress, was similar in the two groups. The same was true for telomere length in peripheral blood leuko-cytes which is often considered as a marker of biological age and/or stress but there was a tendency (p= 0.058) towards decreased telomere length in the LED group.
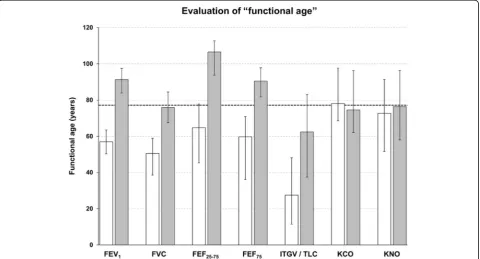
One might argue that the results in terms of percent predicted values simply reflected different coefficients of age-dependence in the reference equations despite the fact that the mean age was similar in the two groups. To evaluate this we inserted the measured values into the respective reference equations and solved for the age that resulted in the observed values; for non-linear equations (e.g. GLI) linear approximations within the adequate range were used. This analysis was not meaningful for all parameters as it made sense only with an obvious and monotonous relationship to age to avoid absurd individ-ual age estimates. Figure 1 shows median values and quartiles for FEV1, FVC, FEF25–75, FEF75, ITGV/TLC,
KCO and KNO. It illustrates the large differences for mechanical versus much smaller differences for gas up-take parameters, taking into account the coefficients of age-dependence via the prediction equations.
As one of the limitations of our study, we did not meas-ure individual rates of ageing. Still, the cross-sectional ana-lysis used by us allowed for the comparison of different functional domains. Naturally, it is not possible to decide whether the differences between the two groups existed
from the beginning, i.e. from young age, or whether they developed over time [21], e.g. due to environmental factors and cigarette smoke exposure. Therefore, an interpretation of our data in terms of“aging”or“premature aging”is not straightforward, since even telomere length might also have been shorter from the beginning. This objection does, how-ever, not compromise the aim of our study which was the analysis of the notion“lung age”that is commonly derived from spirometry alone. The sample size ofn= 123 did not allow to adjust for a broad variety of potential confounders; we therefore present only pairwise comparisons. Adjust-ment for weight or sex did not markedly change the results. Furthermore, it was not possible to directly compare all parameters, either because no reference values were available, or because, e.g. for ITGV, pathological changes can occur in both directions and scales were different. Our study has the strength of a broad panel of high-quality assessments that allowed direct comparisons in the same subjects. This aspect seems particularly important in view of the marked differences between the functional domains.
Conclusions
Two groups of elderly, lung-healthy subjects were chosen from the lower and upper end of the distribution of FEV1%predicted from a population-based sample. The
differences of lung function parameters between groups depended on the functional domain. While those of FEV1, FVC and (specific) airway conductance were large,
those of KCO and KNO transfer coefficients were small and not significantly different from zero. Therefore, the differences in lung-mechanics associated with the selec-tion of the two groups were not in parallel with those in gas uptake. Using the respective prediction equation, a “functional age” is often computed for FEV1, especially
for pedagogical purposes. When adopting this approach for other parameters, the differences between groups translated into corresponding differences in the “ func-tional ages”. This again underlined that the notion of a unique “lung age” is ill-founded, at least when referring to functional indices, and a differentiated description should be preferred.
Additional file
Additional file 1:Supplementary Methods. The additional file provides details on the methods used in the present study. (DOCX 28 kb)
Abbreviations
6MWD:Six minute walking distance; 8-OHdG: 8-hydroxydeoxyguanosine; ANCOVA: Analysis of covariance; BMI: Body mass index; CO: Carbon monoxide; eCO: Exhaled carbon monoxide; FEF25–75: Forced expiratory flow at 25–75% of forced vital capacity; FEF75: Forced expiratory flow when 75% of FVC has been exhaled; FeNO: Fraction of exhaled nitric oxide; FEV1: Forced expiratory volume in 1 s; FVC: Forced vital capacity; Gaw: Airway
conductance; ITGV: Intrathoracic gas volume; KCO: Transfer coefficient for carbon monoxide; KNO: Transfer coefficient for nitric oxide;
KORA: Cooperative Health Research in the Augsburg Region; LED: Lower end of the FEV1distribution; LLN: Lower limit of normal; NO: Nitric oxide; P01: Mouth occlusion pressure 0.1 s after the onset of tidal inspiration; PImax: Peak maximal static inspiratory mouth occlusion pressure; RV: Residual volume; sGaw: Specific airway conductance; TLCHe: Total lung capacity determined by helium dilution; TLCO: Transfer factor of the lung for carbon monoxide; TLCpleth: Total lung capacity determined by body
plethysmography; TLNO: Transfer factor of the lung for nitric oxide; UED: Upper end of the FEV1distribution; VA: Alveolar volume
Acknowledgements
We thank all participants in the study. We are also grateful to Dorothea de la Motte, Rosalind Egg and Thi An Vy Huynh for their support during the examinations and indebted to the KORA study group and all coworkers who are responsible for the design and conduct of the KORA studies.
Funding
The KORA study was initiated and financed by the Helmholtz Zentrum München–German Research Center for Environmental Health, which is funded by the German Federal Ministry of Education and Research (BMBF) and by the State of Bavaria. The KORA-Age project was financed by the BMBF (BMBF FKZ 01ET0713 and 01ET1003A) as part of the‘Health in old age’ program. Further support was provided by the Competence Network ASC-ONET, subnetwork COSYCONET (FKZ 01GI0882). The funders had no role in study design, data collection and analysis, decision to publish, or preparation of the manuscript.
Availability of data and materials
The informed consent given by KORA study participants does not cover data posting in public databases. However, data are available upon request from KORA (https://epi.helmholtz-muenchen.de/) by means of a project agreement. Requests should be sent to [email protected] and are subject to approval by the KORA Board.
Authors’contributions
SK, RAJ, and HS conceptualized the paper. SK performed the statistical analysis and SK, RAJ, HS, JB, RMH, DN, AP and RH interpreted the data. RAJ,
HS, JB, RMH, DN, AP, and RH were involved in the conception of the study, SK, RAJ, HS, SP, RH, and AP were involved in the coordination and the data acquisition of the study. SK, RAJ and HS drafted the manuscript. All authors critically reviewed the manuscript drafts and approved the final manuscript.
Ethics approval and consent to participate
The KORA-Age study was approved by the Ethics Committee of the Bavarian Medical Association, written informed consent has been obtained from all participants and the investigations have been conducted according to the principles expressed in the Declaration of Helsinki.
Consent for publication Not applicable.
Competing interests
The authors declare that they have no competing interests.
Publisher’s Note
Springer Nature remains neutral with regard to jurisdictional claims in published maps and institutional affiliations.
Author details
1Institute of Epidemiology I, Helmholtz Zentrum München - German
Research Center for Environmental Health, Ingolstaedter Landstrasse 1, D-85764 Neuherberg, Germany.2Institute and Outpatient Clinic for
Occupational, Social and Environmental Medicine,
Ludwig-Maximilians-Universität, Ziemssenstrasse 1, 80336 Munich, Germany.
3
Department of Internal Medicine V, Comprehensive Pneumology Center Munich, Ludwig-Maximilians-Universität, Ziemssenstrasse 1, 80336 Munich, Germany.4Comprehensive Pneumology Center Munich (CPC-M), Member of
the German Center for Lung Research, Max-Lebsche-Platz 31, 81377 Munich, Germany.5Division of Respiratory Medicine and Thoracic Oncology, Department of Medicine, Innenstadt, Ludwig-Maximilians-University, Ziemssenstrasse 1, 80336 Munich, Germany.6Institute of Epidemiology II,
Helmholtz Zentrum München - German Research Center for Environmental Health, Ingolstaedter Landstrasse 1, 85764 Neuherberg, Germany.7Institute of Health Economics and Health Care Management, Helmholtz Zentrum München - German Research Center for Environmental Health, Ingolstaedter Landstrasse 1, 85764 Neuherberg, Germany.
Received: 7 December 2016 Accepted: 10 January 2018
References
1. Quanjer PH, Stanojevic S, Cole TJ, Baur X, Hall GL, Culver BH, Enright PL, Hankinson JL, Ip MS, Zheng J, et al. Multi-ethnic reference values for spirometry for the 3-95-yr age range: the global lung function 2012 equations. Eur Respir J. 2012;40(6):1324–43.
2. Morris JF, Temple W. Spirometric“lung age”estimation for motivating smoking cessation. Prev Med. 1985;14(5):655–62.
3. Peters A, Doring A, Ladwig KH, Meisinger C, Linkohr B, Autenrieth C, Baumeister SE, Behr J, Bergner A, Bickel H, et al. Multimorbidity and successful aging: the population-based KORA-age study. Z Gerontol Geriatr. 2011;44(Suppl 2):41–54.
4. Karrasch S, Flexeder C, Behr J, Holle R, Huber RM, Jorres RA, Nowak D, Peters A, Wichmann HE, Heinrich J, et al. Spirometric reference values for advanced age from a south german population. Respiration. 2013; 85(3):210–9.
5. Miller MR, Hankinson J, Brusasco V, Burgos F, Casaburi R, Coates A, Crapo R, Enright P, van der Grinten CP, Gustafsson P, et al. Standardisation of spirometry. Eur Respir J. 2005;26(2):319–38.
6. Middleton ET, Morice AH. Breath carbon monoxide as an indication of smoking habit. Chest. 2000;117(3):758–63.
7. Criée CP, Berdel D, Heise D, Jörres RA, Kardos P, Köhler D, Leupold W, Magnussen H, Marek W, Merget R, et al. Recommendations on whole body plethysmography: part 1. Atemwegs- und Lungenkr. 2009;35(6):256–72. 8. Criée CP, Berdel D, Heise D, Jörres RA, Kardos P, Köhler D, Leupold W,
Magnussen H, Marek W, Merget R, et al. Recommendations for whole body plethysmography: part 2. Atemwegs- und Lungenkr. 2009;35(8):349–70. 9. Macintyre N, Crapo RO, Viegi G, Johnson DC, van der Grinten CP, Brusasco
single-breath determination of carbon monoxide uptake in the lung. Eur Respir J. 2005;26(4):720–35.
10. Criee CP. Recommendations of the German airway league (deutsche Atemwegsliga) for the determination of inspiratory muscle function. Pneumologie. 2003;57(2):98–100.
11. American Thoracic S, European Respiratory S. ATS/ERS recommendations for standardized procedures for the online and offline measurement of exhaled lower respiratory nitric oxide and nasal nitric oxide, 2005. Am J Respir Crit Care Med. 2005;171(8):912–30.
12. A. T. S. Committee on Proficiency Standards for Clinical Pulmonary Function Laboratories. ATS statement: guidelines for the six-minute walk test. Am J Respir Crit Care Med. 2002;166(1):111–7.
13. Albrecht E, Sillanpaa E, Karrasch S, Alves AC, Codd V, Hovatta I, Buxton JL, Nelson CP, Broer L, Hagg S, et al. Telomere length in circulating leukocytes is associated with lung function and disease. Eur Respir J. 2014;43(4):983–92. 14. Koch B, Friedrich N, Volzke H, Jorres RA, Felix SB, Ewert R, Schaper C, Glaser
S. Static lung volumes and airway resistance reference values in healthy adults. Respirology. 2013;18(1):170–8.
15. van der Lee I, Zanen P, Stigter N, van den Bosch JM, Lammers JW. Diffusing capacity for nitric oxide: reference values and dependence on alveolar volume. Respir Med. 2007;101(7):1579–84.
16. Enright PL, Adams AB, Boyle PJ, Sherrill DL. Spirometry and maximal respiratory pressure references from healthy Minnesota 65- to 85-year-old women and men. Chest. 1995;108(3):663–9.
17. Enright PL, Sherrill DL. Reference equations for the six-minute walk in healthy adults. Am J Respir Crit Care Med. 1998;158(5 Pt 1):1384–7. 18. Quanjer PH, Pretto JJ, Brazzale DJ, Boros PW. Grading the severity of airways
obstruction: new wine in new bottles. Eur Respir J. 2014;43(2):505–12. 19. Garcia-Rio F, Dorgham A, Galera R, Casitas R, Martinez E, Alvarez-Sala R, Pino
JM. Prediction equations for single-breath diffusing capacity in subjects aged 65 to 85 years. Chest. 2012;142(1):175–84.
20. Gajdocsy R, Horvath I. Exhaled carbon monoxide in airway diseases: from research findings to clinical relevance. J Breath Res. 2010;4(4):047102. 21. Fletcher C, Peto R. The natural history of chronic airflow obstruction. Br Med
J. 1977;1(6077):1645–8.
• We accept pre-submission inquiries
• Our selector tool helps you to find the most relevant journal
• We provide round the clock customer support
• Convenient online submission
• Thorough peer review
• Inclusion in PubMed and all major indexing services
• Maximum visibility for your research
Submit your manuscript at www.biomedcentral.com/submit