Volume-7 Issue-4
International Journal of Intellectual Advancements
and Research in Engineering Computations
Performance analysis of CI engine using blends of Karanja biodiesel-diesel as a
fuel
M. Leela Ramesh
1, B. Malsoor
2, V.Mahesh Reddy
31, 2, 3
Dept of Mech Engg, Holy Mary Institute of Technology and Science, Hyderabad, Telangana.
ABSTRACT
The automobile industry is concerned the new alternative fuels are being developed to replace conventional petroleum oils. Biodiesel, one of the alternative fuels can be the best choice for engine especially when blended with diesel. In blended form with diesel it improves the efficiency of Compressed Ignition engine reduces emission, and more important reduces stress on the diesel. Variable compression ratio Engine Test Setup is used for conducting trials. It uses Eddy Current Dynamometer for loading the engine. Engine tests were conducted using various blends of biodiesel with the diesel viz. KBD5 (5% Karanja biodiesel+95% diesel) KBD10 and KBD15 as a fuel. In addition exhaust gas analysis is carried out for different blends and compression ratios to check the amount of CO, CO2, HC and NOx in the exhaust of engine. Various performance characteristic were plotted and studied which leads to the final conclusion that blends are efficient and especially KBD10 is more useful.
Keywords:
Biodiesel, Blend, Engine performance, Exhaust gas analysis.INTRODUCTION
Biodiesel is an attractive fuel for diesel engines that it can be made from any vegetable oil (edible or non- edible oils), used cooking oils, animal fats as well as microalgae oils. It is a clean energy, renewable, non- toxic and sustainable alternative to petroleum based fuels, and it is able to reduce toxic emissions when is burned in a diesel engine. The interest of this alternative energy resource is that fatty ester acids, known as biodiesel, have similar characteristics of petro-diesel oil which allows its use in compression motors without any engine modification. The problem is that biodiesel has viscosities approximately twice those of conventional diesel fuels. So biodiesel esters can used directly or blended with diesel.
Just like petroleum diesel, biodiesel operates in compression-ignition engines. Biodiesel has physical properties very similar to conventional diesel .The biodiesel was characterized by determining its density, viscosity, high heating value, certain index, cloud and pour points, characteristics of distillation, and flash and
combustion points according to ISO norms. Viscosity is one of the most important properties that should be considered while using biodiesel, as it affects the fuel injection equipment. Sometimes, especially during cold weather preheating is necessary to increase the viscosity of the oil. Density is another important property of biodiesel. It is greater than that of diesel. Fuel injection equipment operates on a volume metering system, hence a higher density for biodiesel results in the delivery of a slightly greater mass of fuel. Calorific value (CV) of biodiesel is a very interesting property which is always lower than
that of diesel. The biodiesel consists of more amount of O2 than petro diesel. But this higher amount of O2 is related with the low amount of C and H2 which are the sources of thermal energy. Thus biodiesel has lower CV than diesel. Biodiesel can be blended at any level with petroleum diesel to create a biodiesel blend. It can be used in compression-ignition (diesel) engines with little or no modifications (Kim et al, 2004). These blends are denoted by acronyms such as B20, which indicates 20% blend of biodiesel and 80% of petro- diesel. B100 is denominated pure
biodiesel at 100%. These blends are used to minimize the different properties between biodiesel and conventional diesel fuel [1-3].
EXPERIMENTAL SETUP AND TEST
PROCEDURE
The performance tests were conducted on a computerized VCR Engine Setup 1 Cylinder, 4 strokes, Diesel, water cooled, power 3.5 kW at 1500 rpm. The typical engine setup is as shown in bellow fig 1. The engine is directly connected to the eddy current dynamometer for carrying load. The signal for combustion pressure and crank angle is shown on computer, along with it
computer shows many other readings like rpm, load, various temperatures, water flow etc. The digital engine indicator is fitted to the control panel from which various controls like load; water flow etc. can be controlled. The various readings like temperatures, rpm, load; fuel consumed can be measured directly on digital indicator panel.
Window based operating software is used for data acquisition, online display, graphical representation, calculation, & result sheet. Various sensors are attached to the engine for measuring parameters like rpm, crank angle (8.3700.1321.0360), piezo sensors for pressure measurement (model M111A22), thermocouple to measure temperatures etc.
Fig.1 CI Engine Test Setup
Fig.2 Different Biodiesel
At the beginning tests were conducted by using diesel fuel for comparison. Biodiesel is blended with diesel in proportion like 5%, 10% and 15%. Blends are represented as KBD05 (5% karanja biodiesel + 95% diesel), KBD10, KBD15. Fig 2 shows the biodiesel and blends from KBD5 to
(BSFC) were calculated using the collecting data at the same time the flue gas analysis using Flue Gas Analyzer was done [4-9].
RESULTS AND DISCUSSION
Effect of Barke Power
The influence of load on brake power for different fuels is found to be as expected that is brake power increases with load for all samples of fuels. This is due to increase is torque with load. When the brake power produced by the engine at constant loads for different mixtures of dual fuel is compared (Fig 3), it is found that the brake power
increases up to KBD10 and then it decreases. When compared the brake power for diesel with other duel fuel, it is observed that KBD 5 and KBD 10 have higher values than diesel. For KBD 15 it is nearly equal to that of diesel. While considering the variation of brake power with compression ratio, it is found that at higher compression the brake power is also higher. Increase in compression ratio induces greater turning effect on the cylinder crank which results in more push on the piston, and more torque is generated. More torque is nothing but more brake power. Thus as per as brake power is concerned KBD10 is the best choice as a fuel in CI engine.
Fig.3 Variation of Brake Power with blends at varying Compression Ratios at Constant Load
Brake Specific Fuel Consumption
Brake specific fuel consumption (BSFC) is a measure of volumetric fuel consumption for any particular fuel. Fig. 4 shows the graph of BSFC versus Load for different blends of Biodiesel and diesel. BSFC seems to be decreasing with increase in load. This is due to higher percentage increase in Break power with load as compared to increase in the fuel consumption. BSFC of KBD10 is lowest among all fuels for all loads. Out of all four fuels tested, the diesel has the lower value of BSFC.
The behavior of BSFC can be explained more clearly and accurately from fig 3.3, which shows the graph of BSFC versus blends. It seems that the BSFC decreases continuously up to KBD10 for all compression ratios and suddenly starts increasing after KBD10. So as far as BSFC is concerned KBD10 is found to be more efficient. Diesel has more percentage of carbon (C) and hydrogen (H)
and less percentage of oxygen (O2) than biodiesel. Carbon and hydrogen are the source of thermal energy as their oxidation is an exothermic one. On the other hand oxygen helps to burn. At lower blends there is sufficient amount of carbon (C) and hydrogen (H) from diesel and appropriate amount of oxygen (O2) from biodiesel. The result is complete combustion of carbon and hydrogen evolving more heat i.e. higher brake power and lower BSFC. At higher loads though oxygen is more, BSFC is lower; it is because of reduction in C and H content in the duel fuel because of reduction in diesel percentage. BSFC also depends upon the density of the fuel. Higher the density more is the mass flow rate i.e. less fuel is required to generate
same amount of heat. Biodiesel (875 kg/m3) has
Fig.4 Variation of B P with blends for different at varying at Constant Load
Fig.5 Variation of BSFC with Blends at varying Compression Ratios
BRAKE THERMAL EFFICIENCY
Brake thermal efficiency is a performance parameter which is used to evaluate how well an engine converts the heat from a fuel to mechanical energy. From fig. 6 it is clear that for all 4 fuels thermal efficiency increases with load. From fig 6 and 7 it can be concluded that among all tested fuels KBD10 has the highest value of brake thermal efficiency at all loads. This can be correlated to the respective decrease in BSFC.
In fig.7 curves are plotted showing variation of brake thermal efficiency with blends. Each curve represents constant compression ratio. As the compression ratio increases, the fuel mixture is sufficiently compressed thereby increasing the thermal efficiency, so that less fuel is required to produce the same amount of energy. Brake thermal efficiency shows behavior just opposite to that of BSFC as expected. For all compression ratios it shows similar trend of increase in brake thermal efficiency up to 10% blend, reaches to maximum and then decreases.
Fig.7 Variation of Brake Thermal Efficiency at varying Compression Ratios
EXHAUST GAS EMISSION ANALYSIS
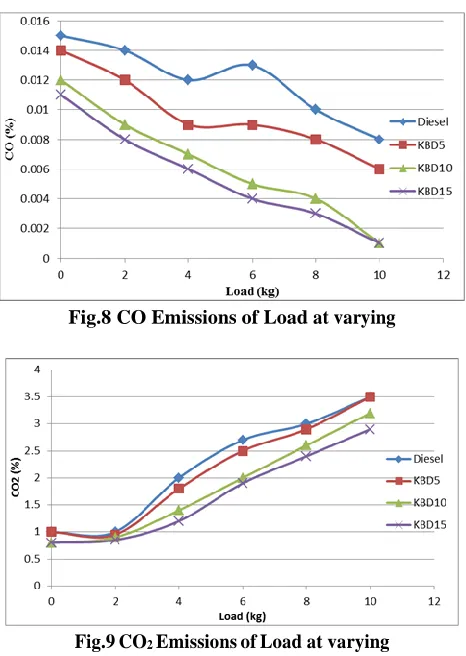
Exhaust gas composition was measured using exhaust gas analyzer. The analyzer measures carbon monoxide (CO), hydrocarbons (HC), and nitric oxides (NOx) in the exhaust. The emission analysis graphs for different dual fuels are shown in Fig 8 to Fig 10.
All blends tested shows that for all loading conditions their CO emission is less than that of
diesel. The presence of extra dissolved oxygen in biodiesel could be the reason behind the complete combustion and thus reducing the CO percentage in the exhaust gases. For each fuel, CO emission was found to be decreased with increase in engine load. The higher combustion temperature at higher engine load contributes to the general decreasing trend.
Fig.8 CO Emissions of Load at varying
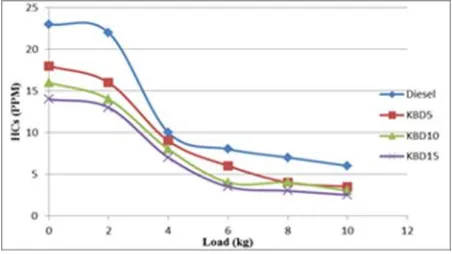
Fig.10 HC Emissions of Load at varying
Fig. 9 represents emission of CO2 at different
loads for different fuels. The CO2 percentage was increasing with increase in engine load. The CO2 emission was lower for all three blends and was decreasing with increase in biodiesel share in blends. When blend percentage increases, as mentioned earlier, the C components in fuel decreases which results in less amount of CO2.
As shown in Fig. 10, for Diesel, the HC emission decreases with increase of engine load, due to the increase in combustion temperature associated with higher engine load. For biodiesel blended fuel, the HC emission is lower than that of diesel and decreases with increase of biodiesel in the fuel. The lower volatility of biodiesel compared with diesel contributes to the larger difference in HC emission at low engine loads (Shirneshan et al, 2012).
CONCLUSION
For all the fuel samples tested, torque, brake power and brake thermal efficiency reach maximum values at load of 10 kg.
Brake specific fuel consumption of all blends was found lower than that of diesel. Among all
fuel tested KBD10 has the lowest value of BSFC. From KBD10 and onwards it then increases with increases in biodiesel percentage in blend.
The BSFC of KBD10 and KBD15 is reduced by 9.01% and 4.96% respectively as compared to BSFC of Diesel.
Brake thermal efficiency for KBD10 and KBD15 is increased by 8.34 % and 5.50 % respectively than that of diesel.
The volumetric efficiency of KBD5 and KBD10 is increased by 2.61 % as compared to volumetric efficiency of diesel.
All the blends of biodiesel emit CO, CO2 and HC lower than that of diesel. KBD15 has the lowest emission of all fuel tested. Emission by KBD10 is slightly higher than that of KBD15. CO, CO2 and HC emission by KBD10 are 12%, 6 % and 13% higher than that of KBD15 respectively.
The blend KBD10 can be a superior choice for use in the diesel engines without making any engine modifications. Also the cost of blend (KBD10) can be considerably reduced than petro diesel.
REFERENCES
[1]. J.M. Encinar, J.F. Gonzalez, J.J. Rodriguez, Biodiesel Fuels from Vegetable Oils: Trans esterification of Cynara Carunculous L. Oils with Ethanol, Energy Fuel, 16, 2002, 443–450.
[2]. M. Balat, Fuel Characteristics and the use of Biodiesel as a Transportation Fuel”, Energy Sour, 28, 2006, 855–864.
[3]. M. Md. Z. Shahadat, Md. E. Hoque , Making Biodiesel and Performance Test of a Diesel Engine using Diesel -Biodiesel Blends as a Fuel with inlet Air Preheating Attachment, International Conference on Mechanical Engineering, Dhaka, Bangladesh, 2007, 29- 31.
[5]. A. Demirbas, Global Biofuel Strategies, Energy Edu Sci Technology, 17, 2006, 33–63.
[6]. C.Satyanarayanal and P.V. Rao , Influence of Key Properties of Pongamia Biodiesel on Performance, Combustion and Emission Characteristics of a DI Diesel Engine, WSEAS Transactions on Heat and Mass Transfer, 4 (2), 2009, 1790-5044.
[7]. H. J. Kim, B. S. Kang, M.J. Kim, trans esterification of Vegetable Oil to Biodiesel using Heterogeneous Base Catalyst, Catal Today, 2004, 315–320.
[8]. T. Aina, C.O. Folayan and G. Y. Pam, “Influence of Compression Ratio on the Performance Characteristics of a Spark Ignition Engine”, Advances in Applied Science Research, 3 (4), 2012, 1915-1922.