CONTENT OF COPPER AND NICKEL IN SOILS OF VISTULA RIVER
CATCHMENT
Elżbieta Skorbiłowicz1, Anna Samborska1
1 Department of Technology in Engineering and Environmental Protection, Technical University in Bialystok,
Wiejska 45A, 15-351 Bialystok, Poland, e-mail: [email protected]; [email protected]
INTRODUCTION
Metal pollution attracts growing interest mainly due to their toxic effects on the entire nat-ural environment [Hsio et al, 2007, Skorbiłowicz E., 2012]. It is therefore necessary to monitor, not to exceed acceptable standards of elements in ecosystems. Heavy metals in soils are derived from natural and anthropogenic sources. The most important natural source of heavy metals in the soil, which is the bedrock, provides di-verse amounts of metals, depending on its type, mineralogical composition and origin [Karcze -wska, 2002]. Anthropogenic sources of metals are primarily associated with steel industry and metallurgy [Kabata-Pendias and Pendias 1999]. Gruca-Krulikowska and Wacławek [2006] claim that rapidly developing industry and transport, or improper use of pesticides in agriculture, con-Volume 15, No. 2, April 2014, pp. 53–59
DOI: 10.12911/22998993.1094978 Research Article
ABSTRACT
Metal pollution attracts growing interest mainly due to their toxic effects on the entire natural environment. It is therefore necessary to monitor, not to exceed acceptable stan-dards of elements in ecosystems. Heavy metals in soils are derived from natural and anthropogenic sources. The purpose of this article is to present the contents of copper and nickel in agricultural soils within the Vistula river catchment based on research carried out by the Institute of Soil Science and Plant Cultivation in the period since 1995 to 2010. The assessment of a degree of soil contamination by these elements ac-cording to standards has been also performed. It has been proven that about 91% of ag-ricultural soils in Vistula river catchment shows natural (0°), while approximately 9% higher (Io) copper concentrations. It was found that in the total agricultural area of the
Vistula river catchment, soils not contaminated with nickel (0°), with elevated (Io), and
weakly contaminated soils (IIo) are respectively 85%, 11%, 4% of the analyzed soils
area. There was a significant relationship between the content of copper and nickel in soils and such features as organic matter and pH. Analysis of results confirmed that the highly developed industrial activity affects the increased amount of pollutants in soils; the greatest accumulation occurred in soils of the upper Vistula river catchment, which is caused primarily by interaction of the Upper Silesian Industrial District.
Keywords: soil, copper, nickel, Vistula river catchment.
Received: 2014.01.05 Accepted: 2014.03.10 Published: 2014.04.04
tributes to the acidification of soils and hence the accumulation of heavy metals in the envi-ronment. Gray and McLaren [2005]have shown that the activity of metals in the soil solution is dependent on the soil pH, metal concentration, and the total content of potential sorption centers within the soil. Ottosen et al. (2001) in their study showed that metals have a tendency to transfer onto larger areas in contaminated soil, mainly in the finest fractions.
METHODS
Vistula is the longest and largest Polish river, which flows into the Baltic Sea, and its length is 1047 km. Source of the Vistula river is located in the southern part of Polish part of Silesian Beskid. Tributaries of the Vistula represent almost 54% of the Polish area. Vistula river consists of 3 sec-tions: Upper Vistula, Central Vistula, and Lower Vistula. Table 1 shows dominant soil types in the Vistula river catchment divided into provinces.
Table 1. Types of soils in Vistula river catchment
Province Predominating soil type Lesser Poland Lithosols, Cambisols, Haplic Phaeozems
Subcarpathian Lithosols, Arenosols, Podzols Holy Cross Cambisols, Podzols, Arenosols Lublin Cambisols, Podzols, Arenosols, Haplic Phaeozems
Łódź Podzols, Arenosols, Luvisols, Phaeozems Masovian Podzols, Arenosols, Luvisols Warmian-Masurian Cambisols, Podzols, Arenosols Kuyavian-Pomeranian Eutric Fluvisols, Cambisols, Podzols, Luvisols, Arenosols
Pomeranian Arenosols, Luvisols, Eutric Phaeozems, Eutric Cambisols
Climate in Poland should be counted to tran-sitional between oceanic in western part of the country and continental temperate in the eastern part. The climate is characterized by frequent variability and different states of the weather. The growing season amounts to about 200 days, the shortest it continues in the southern part of the country, while the longest in western Poland. Av-erage annual rainfall is about 600 mm, while mean annual air temperature is 8 °C. Winds are char-acterized by high changeability, although western winds predominate. In winter, winds blow mainly from east [Kożuchowski, 2011].
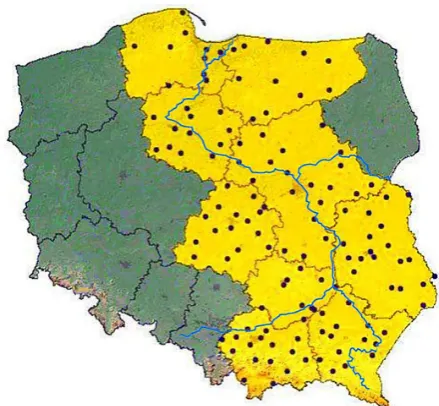
The research presented in this work have been carried out by the Institute of Soil Science and Plant Cultivation, Puławy, on agricultural soils. The study contains the analysis of copper and nickel contents in years: 1995, 2000, 2005, and 2010, in nine provinces (Lesser Poland, Sub-carpathian, Holy Cross, Lublin, Łódź, Masovian, Warmian-Masurian, Kuyavian-Pomeranian, and Pomeranian) located in the catchment of the Vis-tula river. The studied object is shown in Figure 1. The total number of soil samples was 129. Sam-pling was done at a depth of 0–20 cm and from
the surface of approximately 100 m2 area [http://
www.gios.gov.pl/chemizm_gleb/].
Copper and nickel were determined using a spectrophotometer by means of ASA technique. Digestion was performed applying closed CEM Mars-5 system in teflon vials using hydrochloric and nitric acids. The pH of H2O and KCl suspen-sions was determined by potentiometry. The or-ganic matter in the soil samples was determined by volumetric modified Tiurin method that in -volves the wet combustion of organic substances.
RESULTS AND DISCUSSION
The data in Table 2 indicate that copper con-tent varies slightly, and the average level is in the range from 4.7 ± 2.3 mg·kg-1 to 15.6 ± 7.6 mg·kg-1.
The minimum amount of copper was recorded for 1.2 mg·kg-1 in Lublin province, while the highest
32.3 mg·kg-1 in Subcarpathian province.
Differ-entiation of copper content in agricultural soils of Vistula river catchment is associated with many factors, such as mineralogical composition and grain size of the soil, bedrock origin, and human activities. Kabata-Pendias and Pendias [1999] reports concentration of copper in Polish soils within the range: 50–140 mg·kg-1. According to
the Decree of the Minister of Environment from 9 September 2002 on standards for soil quality and land quality standards, the limiting copper concentration, which is 150 mg·kg-1 DM, is not
exceeded in soils of Vistula river catchment.
Data in Table 2 indicate that the largest areas of soils with natural (0 °) copper content are pres-ent in the lower Vistula river catchmpres-ent. Soils of the upper Vistula river catchment are character-ized by increased copper content in provinces: Lesser Poland, Subcarpathian, and Holy Cross, which exceed 10%. Also increased copper con-tent occurred in Warmian-Masurian region: (0 °) – 84%, (I °) – 16% (Table 2).
Referring to lowlands, the average copper content in soils is 3 mg·kg-1, while in the bedrock,
this amount is slightly higher than 7.1 mg·kg-1
[Pasieczna, 2003]. According to research by Za -wadzki (2002), copper content in soils of central part of the country occurred at the level of 10 mg·kg-1. Studies conducted in the area of
Lub-lin revealed that copper content was 3.1–11.4 mg·kg-1 [Zgłobicki and Rodzk 2007].
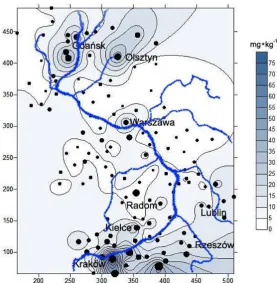
Spatial distribution of copper in Vistula river catchment (Figure 2) in the period under research shows that the highest accumulation of this ele-ment occurred in the upper catchele-ment of the river.
Table 2. Copper content and soil proportions according to the level of contamination with this element
Area
Arithmetic mean
and standard deviation [mg·kg-1] in contamination levels (%)Share of soils
1995 2000 2005 2010 0o Io IIo IIIo IVo Vo
Lesser Poland N = 68 14.0±6.3 14.7±6.5 15.6±7.6 14.3±6.1 90.0 10.0 0.0 0.0 0.0 0 Subcarpathian N = 56 10.7±7.1 11.4±7.1 10.7±6.2 11.9±7.5 86.0 14.0 0.0 0.0 0.0 0.0 Holy Cross N = 36 9.0±7.9 9.0±8.3 8.8±9.0 6.6±5.3 89.0 11.0 0.0 0.0 0.0 0.0 Lublin N = 80 6.7±3.4 6.2±3.0 6.0±2.9 6.2±3.5 90.0 10.0 0.0 0.0 0.0 0.0 Łódź N = 64 4.7±2.3 5.1±2.6 5.1±3.3 6.2±5.9 100.0 0 0.0 0.0 0.0 0.0 Masovian N = 80 5.0±4.3 4.9±3.8 5.3±4.5 5.5±4.6 87.5 12.5 0.0 0.0 0.0 0.0 Warmian-Masurian N = 44 9.1±7.2 8.8±6.8 8.0±6.0 8.0±4.9 84.0 16.0 0.0 0.0 0.0 0.0 Kuyavian-Pomeranian N = 52 5.4±2.7 5.0±2.2 5.6±2.6 5.0±2.5 100.0 0.0 0.0 0.0 0.0 0.0 Pomeranian N = 36 11.5±6.9 12.1±7.7 11.5±7.1 9.7±6.4 100.0 0.0 0.0 0.0 0.0 0.0 Vistula river catchment 8.4±2.2 8.6±2.4 8.5±2.3 8.2±1,5 91.0 9.0 0.0 0.0 0.0 0.0
N – total number of samples in 1995–2010.
This is due to the impact of the Legnica-Głogów Copper District (LGOM). Annual emissions of dust containing heavy metals, especially Cu and Pb, into the atmosphere from steel works of LGOM progressively increased since the launch of plants (Legnica 1954 as well as Głogów I and II in 1971 and 1977) till the mid-eighties, when each year these plants emitted more than 2600 t of metallurgical dusts, including more than 200 t Cu and 150 t Pb. Controlling the emission in the next few years did not solve the problem of existing soil contamination with heavy metals, mainly Cu and Pb, as well as Zn, Cd, As and others. He contents of Cu and Pb in soils decreases with increasing the distance from steel works. The highest contents of these metals were recorded in the immediate vi-cinity of these plants (at distances <200 m), which amounted to 9800 mg∙kg-1 Cu and 45 080 mg∙kg-1
Pb in the area of Legnica smelter as well as 5000 mg∙kg-1 Cu and 18 400 mg∙kg-1 Pb in the region
of Głogów steel work [Karczewska, 2002]. Quan -tity of analyzed element in the south-western part of the country was, according to Kaszubkiewicz and Kawałko [2009], from 6.5 to 1016 mg∙kg-1.
A much smaller proportion of Cu recorded in the heavily industrialized village. Studies performed by Lu, Bai [2006] indicate that the average cop -per content in the soils of China amounted to 44.1 mg∙kg-1 Cu in the eastern part. According to a study
conducted in Botswana, South Africa, concentra -tion of this metal ranges from 20 mg∙kg-1 to 372
mg∙kg-1 (Cngole and Ekosse 2012). The copper
content of soils in New Zealand averaged from 2 to 2116 μg·g-1 [Gray and McLaren, 2005].
Exces-sive copper concentrations in the soil involve a negative impact on the whole environment.
Analysis of middle and lower parts of Vistula river catchment reveals the highest copper con-centrations were found near Warsaw, Olsztyn, and Tricity Gdynia-Sopot-Gdańsk (Figure 2).
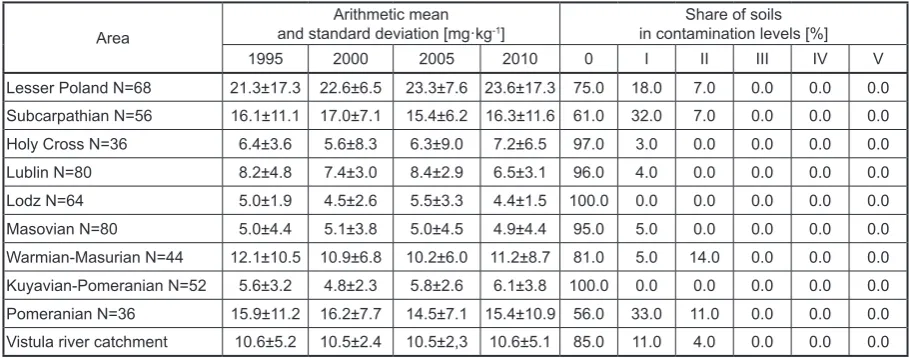
The arithmetic mean of nickel in soils of Vistula river catchment was recorded at 10.5 ± 2.4 mg·kg-1 (Table 3). Nickel content
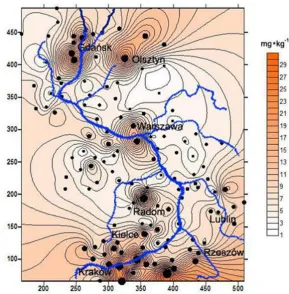
analy-sis showed that the maximum quantities of the element, like in the case of copper, occurred in the lower and upper catchments of the river. In Lesser Poland province, the average nickel con-tent in 1995 was 21.3 ± 17.3 mg·kg-1. In
subse-quent years, mean nickel content increased to 23.6 ± 17.3 mg·kg-1 (2010). High amounts of
nickel were also reported in Subcarpathian prov-ince, which ranged from 15.4 ± 6.2 to 17.0 ± 7.1 mg·kg-1. Amounts of nickel in soils of the lower
river basin in Pomeranian province appeared to be on a similar level (15.9 ± 11.2 mg·kg-1) in
1995, whereas the concentration of nickel slight-ly decreased in 2010 (15.4 ± 10.9 mg·kg-1). The
city of Gdańsk exerts significant impact on an elevated state of soil contamination in the lower Vistula river catchment; there are major pollution emitters including: “Lotos” refinery, shipbuild -ing industry, as well as landfill GZHF “Phos -phates”. Large accumulation of nickel in soils of the southern Poland is associated with continued development of industrial activities. Accord-ing to Telerak [2005], Polish soils contain small amounts of heavy metals; their higher accumu-lation occurred in the industrialized parts of the country, such as the southern and the south-west regions. The largest soil surface area of natural nickel content (0°) (Table 3, Figure 3) is located in Lodz and Kuyavian-Pomeranian provinces
Area
Arithmetic mean
and standard deviation [mg·kg-1] in contamination levels [%]Share of soils
1995 2000 2005 2010 0 I II III IV V
Lesser Poland N=68 21.3±17.3 22.6±6.5 23.3±7.6 23.6±17.3 75.0 18.0 7.0 0.0 0.0 0.0 Subcarpathian N=56 16.1±11.1 17.0±7.1 15.4±6.2 16.3±11.6 61.0 32.0 7.0 0.0 0.0 0.0 Holy Cross N=36 6.4±3.6 5.6±8.3 6.3±9.0 7.2±6.5 97.0 3.0 0.0 0.0 0.0 0.0 Lublin N=80 8.2±4.8 7.4±3.0 8.4±2.9 6.5±3.1 96.0 4.0 0.0 0.0 0.0 0.0 Lodz N=64 5.0±1.9 4.5±2.6 5.5±3.3 4.4±1.5 100.0 0.0 0.0 0.0 0.0 0.0 Masovian N=80 5.0±4.4 5.1±3.8 5.0±4.5 4.9±4.4 95.0 5.0 0.0 0.0 0.0 0.0 Warmian-Masurian N=44 12.1±10.5 10.9±6.8 10.2±6.0 11.2±8.7 81.0 5.0 14.0 0.0 0.0 0.0 Kuyavian-Pomeranian N=52 5.6±3.2 4.8±2.3 5.8±2.6 6.1±3.8 100.0 0.0 0.0 0.0 0.0 0.0 Pomeranian N=36 15.9±11.2 16.2±7.7 14.5±7.1 15.4±10.9 56.0 33.0 11.0 0.0 0.0 0.0 Vistula river catchment 10.6±5.2 10.5±2.4 10.5±2,3 10.6±5.1 85.0 11.0 4.0 0.0 0.0 0.0
Table 3. Nickel content and soil proportions according to the level of contamination with this element
and it is caused by the lack of anthropogenic con-tamination by this element.
Zawadzki [2002] showed the amount of nickel in soils of central Vistula river catchment at the level of 1–31 mg∙kg-1. The central part of
Poland is characterized by a small amount of nickel in soils, which ranges from 4.02 to 31.3 mg∙kg-1 [Jaremko and Kalembasa, 2011]. Soils
of the south-western part of Poland contain aver-age proportions of analyzed element that ranges from 6.2 to 68.3 mg∙kg-1 [Kaszubkiewicz and
Kawałko, 2009]. Areas of mining areas are more contaminated with nickel, which was proved by Cngole and Ekosse [2012], who determined the
Table 4. General soil properties (0–20 cm)
Area
Percentage of samples with pH in H2O
Percentage of samples
with pH in 1N KCl Percentage of samples with humus content <6.6 6.6–7.2 >7.2 <6.6 6.6–7.2 >7.2 ≤1.0 1.0–2.0 >2.0
Lesser Poland 9 4 4 13 3 0 1 3 14
Subcarpathian 7 4 3 13 1 0 0 8 6
Holy Cross 5 4 0 9 0 0 1 7 1
Lublin 8 4 8 12 5 3 1 16 3
Lodz 12 3 1 14 3 0 0 13 4
Masovian 16 2 2 18 2 0 0 15 5
Warmian-Masurian 6 2 3 8 2 1 1 5 5
Kuyavian-Pomeranian 9 1 3 10 0 3 1 9 1
Pomeranian 2 4 3 7 2 0 0 3 6
Figure 3. Spatial distribution of nickel content in soils of Vistula river catchment
amount of this element between 22.3 mg∙kg-1 to
266 mg∙kg-1. In Serbian soils, the average nickel
content was high amounting up to 114,2 ppm [Ja-kovlejevic, 1996].
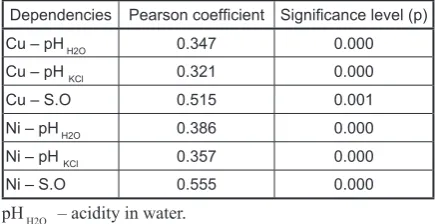
impor-tant in binding heavy metals from the soil solu-tion. Table 4 presents general soil properties: pH and organic matter. The study proved that copper and nickel contents depend on soil characteris-tics such as pH and organic matter. The correla-tion coefficient values for the contents of copper and nickel in soils vs. their properties (Table 5) indicate the existence of significant dependence between: Cu content in the soil and the organic substance (R = 0.515) and pH value (R = 0.341, R = 0.321). Similar correlations were observed in case of nickel (Table 5).
CONCLUSIONS
1. The agricultural soils in the Vistula river catchment are characterized by low content of copper, the average value of which was 8.2 ± 1.5 mg∙kg-1, while the average nickel content
was 10.6 ± 5.1 mg∙kg-1.
2. It has been proved that about 91% of agricul-tural soils in the Vistula river catchment shows natural (0°), while approximately 9% higher (Io) copper concentrations.
3. It was found that in the total agricultural area of the Vistula river catchment, soils are not contaminated with nickel (0°), with elevated (Io), and weakly contaminated soils (IIo) are
respectively 85%, 11%, 4% of the analyzed soils area.
4. There was a significant relationship between the content of copper and nickel in soils and such features as organic matter and pH. This indicates that the levels of analyzed metals in soils are also determined by other factors. 5. Analysis of results confirmed that the highly
developed industrial activity affects the in-creased amount of pollutants in soils; the
greatest accumulation occurred in soils of the upper Vistula river catchment, which is caused primarily by interaction with the Upper Sile-sian Industrial District.
REFERENCES
1. Cngole V.M., Ekosse G.I.E., 2012. Copper, nickel and zinc contamination in soils within the precincts of mining and landfilling environments. Int. J. En -viron. Sci. Technol., 9: 485-494
2. Gray C.W., Mclaren R.G., 2005. Soil factors af-fecting heavy etal solubility in some New Zeland. Agriculture and Life Sciences Division, Lincoln University, Canterbury, New Zealand; Agriculture and Environment Division, Rothamsted Research, Harpenden, Herts, AL5 2JQ, UK.
3. Gruca-Krulikowska S., Wacławek W., 2006. Metale w środowisku. Cz. II. Wpływ metali ciężkich na rośliny. Chemia. Dydaktyka. Ekologia.
Meteorologia 11, nr 1-2.
4. Hsiao M.C., Wang H.P., Huag C.H., Chang J., Wei Y., 2007. Tracking of copper in contaminated soils. Journal of Electron Spectroscopy and Related
Phe-nomena 156–158, 208-210.
5. Jakovljevic M.D., Kostic N.M., Stevanovic D., Blagojevic S., 1996. Factors infkuencing the dis -tribution of heavy metals in the alluvial soils of the Velika Morava valley, Serbia, Faculty of Agrivul-ture, Nemanjina 6.
6. Jaremko D., Kalembasa D., 2011. Specjacja niklu w ornych glebach płowych opadowo-glejowych wysoczyzny siedleckiej, Inżynieria Ekologiczna, nr 27, 19-24.
7. Kabata-Pendias A., Pendias H., 1999. Biogeochemia pierwiastków śladowych, PWN, Warszawa.
8. Kabata-Pendias A., Matowicka-Terelak T., Pio-trowska M., 1993. Ocena stopnia zanieczyszczenia gleb i roślin metalami ciężkimi i siarką, Bib. Moni -toringu Środowiska, Warszawa.
9. Karczewska A., 2002. Metale ciężkie w glebach zanieczyszczonych emisjami hut miedzi – formy i rozpuszczalność, Instytut Gleboznawstwa i Och -rony Środowiska Rolniczego, Wrocław.
10. Kaszubkiewicz J., Kawałko D., 2009, Total con -tent of heavy metals in soils and plant sat the area of Jeleniagóra district, Ochrona Środowiska i Za -sobów Naturalnych nr 40, 2009, 177-189,
11. Kożuchowski K., 2011. Klimat Polski, Nowe spoj-rzenie, wyd. Naukowe PWN, Warszawa.
12. Lu S.G., Bai S.Q., 2006. Study on the correlation of magnetic properties and heavy metals conent in urban soils of Hangzhou City, China. Journal of Applied Geophysics 60, 1-12.
Table 5. Correlation coefficient
Dependencies Pearson coefficient Significance level (p)
Cu – pH H2O 0.347 0.000
Cu – pH KCl 0.321 0.000
Cu – S.O 0.515 0.001
Ni – pH H2O 0.386 0.000
Ni – pH KCl 0.357 0.000
Ni – S.O 0.555 0.000
13. Ottosen L.M., Hansen H.K., Ribeiro A.B., Vil -lumsen A., 2001. Removal of Cu, Pb and Zn in applied electric field in calcareous and non-calcar -eous soils. Journal of Hazardous Materials B85, 291-299.
14. Pasieczna A., 2003. atlas zanieczyszczań gleb miejskich w Polsce. Państwowy Instytut Geolo-giczny, Warszawa.
15. Pasieczna A., 2011. Naturalne i antropogenicz-ne czynniki zanieczyszczenia środowiska. Państwo-wy Instytut Geologiczny, PaństwoPaństwo-wy Instytut Badawczy.
16. Rozporządzenie Ministra Środowiska z dnia 9 września 2002 r. w sprawie standardów jakości gleby oraz standardów jakości ziemi.
17. Siebielec G., Smreczak B., Klimkowicz-Pawlas A., Maliszewska-Kordybach B., Terelak H., Koza P., Hryńczuk B., Łysiak M., Miturski T., Gałązka R., Suszek B., 2012. Monitoring chemizmu gleb ornych w Polsce w latach 2010-2012. IUNG.
18. Terelak H., 2005. Metale ciężkie i siarka w glebach
użytków rolnych Polski. Problemy Ekologii, tom 9, nr 5, 259-264.
19. Terelak H., Motowicka-Telerak T., Stuczyński T., Pietruch C., 2000. Pierwiastki śladowe (Cd, Cu, Ni, Pb, Zn) w glebach użytków rolnych Polski. Ins-pekcja Ochrony Środowiska, Warszawa.
20. Skorbiłowicz E., 2012. Studia nad rozmieszczeniem niektórych metali w środowisku wodnym zlewni górnej Narwi. Oficyna Wydawnicza Politechniki Białostockiej, rozprawy naukowe Nr 222.
21. Zawadzki J., 2002. Badania korelacji przestrzen-nych zawartości wybraprzestrzen-nych pierwiastków ślado-wych w glebach Warszawy i okolic. Ochrona Środowiska nr 4.
22. Zgłobicki W., Rodzik J., 2007. Heavy metals in the slope deposits of loess areas of the Lublin Upland (E Poland). Science Direct, Catena 71, 84-95. 23. http://raportroczny.lotos.pl/zrownowazony-rozwoj/
srodowisko/ograniczanie-wplywu-na-srodowisko.
24. Monitoring Chemizmu Gleb Ornych w Polsce. http: