ORIGINAL RESEARCH
ADULT BRAIN
Association of Automatically Quantified Total Blood Volume
after Aneurysmal Subarachnoid Hemorrhage with Delayed
Cerebral Ischemia
XI.A. Zijlstra,XC.S. Gathier,XA.M. Boers,XH.A. Marquering,XA.J. Slooter,XB.K. Velthuis,XB.A. Coert,XD. Verbaan, X R. van den Berg,XG.J. Rinkel, andXC.B. Majoie
ABSTRACT
BACKGROUND AND PURPOSE: The total amount of extravasated blood after aneurysmal subarachnoid hemorrhage, assessed with semiquantitative methods such as the modified Fisher and Hijdra scales, is known to be a predictor of delayed cerebral ischemia. However, prediction rates of delayed cerebral ischemia are moderate, which may be caused by the rough and observer-dependent blood volume estimation used in the prediction models. We therefore assessed the association between automatically quantified total blood volume on NCCT and delayed cerebral ischemia.
MATERIALS AND METHODS:We retrospectively studied clinical and radiologic data of consecutive patients with aneurysmal SAH admitted to 2 academic hospitals between January 2009 and December 2011. Adjusted ORs with associated 95% confidence intervals were calculated for the association between automatically quantified total blood volume on NCCT and delayed cerebral ischemia (clinical, radiologic, and both). The calculations were also performed for the presence of an intraparenchymal hematoma and/or an intraventricular hematoma and clinical delayed cerebral ischemia.
RESULTS:We included 333 patients. The adjusted OR of total blood volume for delayed cerebral ischemia (clinical, radiologic, and both) was 1.02 (95% CI, 1.01–1.03) per milliliter of blood. The adjusted OR for the presence of an intraparenchymal hematoma for clinical delayed cerebral ischemia was 0.47 (95% CI, 0.24 – 0.95) and of the presence of an intraventricular hematoma, 2.66 (95% CI, 1.37–5.17).
CONCLUSIONS: A higher total blood volume measured with our automated quantification method is significantly associated with delayed cerebral ischemia. The results of this study encourage the use of rater-independent quantification methods in future multicenter studies on delayed cerebral ischemia prevention and prediction.
ABBREVIATIONS:aOR⫽adjusted odds ratio; aSAH⫽aneurysmal subarachnoid hemorrhage; DCI⫽delayed cerebral ischemia; IPH⫽intraparenchymal hematoma; IVH⫽intraventricular hematoma; TBV⫽total blood volume; WFNS scale⫽World Federation of Neurosurgical Societies scale
D
elayed cerebral ischemia (DCI) occurs in 20%–30% of pa-tients with aneurysmal subarachnoid hemorrhage (aSAH) and is associated with poor outcome.1-3Patients who developDCI need costly intensive care. The cause of DCI is multifactorial,
including larger and smaller vessel vasospasm, cortical spreading ischemia, microvascular dysfunction, and thrombosis.3
Blood-breakdown products in the subarachnoid and CSF spaces may cause vasospasm.2Several studies have reported the positive
rela-tionship between the total amount of extravasated blood after SAH and the development of vasospasm (at that time considered the main cause of DCI) by using CT grading scales such as the modified/revisited Fisher grading scale and the Hijdra scale.4-7
These grading scales only provide a rough estimation of the aneu-rysmal total blood volume (TBV) and are observer-dependent, factors that may add to the moderate prediction rates of DCI.8
More reliable quantification of TBV might result in better predic-tion of DCI, which can help clinicians more accurately identify patients at risk and more effectively use scarce resources.9To
as-sess the association of TBV with DCI, a reliable and valid method for measuring subarachnoid blood volume is needed, with cor-rection for possible confounding influences. We recently vali-dated a fully automatic method for TBV quantification on NCCT. Received October 27, 2015; accepted after revision February 7, 2016.
From the Departments of Radiology (I.A.Z, A.M.B., H.A.M, R.v.d.B., C.B.M.), Neuro-surgery (B.A.C., D.V.), and Biomedical Engineering and Physics (A.M.B., H.A.M.), Aca-demic Medical Center, Amsterdam, the Netherlands; Departments of Radiology (B.-K.V.), Intensive Care (A.J.S.), and Neurology (C.S.G., G.J.R.), University Medical Center Utrecht, Utrecht, the Netherlands; and Department of Robotics and Mechatronics (A.M.B.), University of Twente, Enschede, the Netherlands. H.A.M. received a research grant from Fonds NutsOhra (1403– 023) to study the prognostic value of quantified blood in patients with aneurysmal subarachnoid hemorrhage.
Paper previously presented at: Annual Meeting of the European Congress of Radi-ology, March 2– 6, 2016; Vienna, Austria.
Please address correspondence to IJsbrand A. Zijlstra, MD, Department of Radiol-ogy, Academic Medical Center, Meibergdreef 9, 1105 AZ, Amsterdam, the Nether-lands; e-mail [email protected]
This method is based on a relative density increase of blood after aSAH in relation to different brain structures.10In the current
study, we aimed to assess the association of automatically quan-tified TBV with DCI.
MATERIALS AND METHODS
Patient Population
We included consecutive patients with aSAH who were admitted between January 2009 and December 2011 to 2 large university hospitals (Academic Medical Center Amsterdam and University Medical Center Utrecht) in the Netherlands.
“Aneurysmal SAH” was defined as an aneurysmal bleeding pattern with an associated aneurysm. Patients without aneurysms proved on CTA/MRA/DSA were excluded. We further excluded patients with a baseline CT obtained⬎24 hours after ictus be-cause of the risk of blood clearance and patients in whom the CT scans could not be used for the automatic quantification method because of movement artifacts or metal artifacts caused by previ-ous treatment. Patients with technically inadequate scans (scans in 2 parts or incomplete scans) were also excluded. Patients with an external ventricular drain on the first CT were excluded be-cause of artifacts and possible blood clearance. TBV was defined as the sum of subarachnoid (cisternal and sulcal), intraparenchy-mal, intraventricular, and subdural blood.
Clinical and Imaging Data Collection
All baseline characteristics of the included patients were collected through retrospective review of the clinical charts by a single ob-server (C.S.G.). These included age, medical history of hyperten-sion, date of the aSAH ictus, hospital admission date, clinical con-dition on admission according to the World Federation of Neurological Societies scale (WFNS),11NCCT date, the
occur-rence of rebleeding (clinical, not CT-confirmed, or radiologic), aneurysm location (anterior or posterior circulation), aneurysm treatment (coiling, clipping, or no aneurysm treatment), and date of death. The WFNS score on admission was dichotomized into favorable (1–3) and unfavorable (4 –5). This observer also as-sessed the presence of clinical DCI, which was defined as clinical deterioration that could not be explained by any cause other than DCI, and radiologic DCI, which was defined as the presence of cerebral infarction on CT or MR images within 6 weeks after SAH or on the latest CT scan or MR image obtained before death, which could not be attributed to other causes such as surgical clipping or endovascular treatment, according to previously pub-lished criteria.12The patients were followed as long as they were
hospitalized.
For the volume analysis, generally the first CT scan (all 5-mm sections) after the aSAH ictus was used. Only in case of a rebleed-ing within 24 hours and before treatment was the CT scan after rebleeding used because of the larger blood volume. All CT scans were anonymized before assessment (H.A.M. and I.A.Z.) and were thereafter assessed for the appropriateness for automated quantification (I.A.Z.). The TBV (in milliliters) was automatically quantified (Fig 1), and the quality of the automatic segmentation was evaluated by using ITK-SNAP, Version 2.4.0 (www.itksnap. org) (I.A.Z.).13
All CT scans were inspected for the presence of
intraparenchy-mal hematoma (IPH) and/or intraventricular hematoma (IVH) (I.A.Z.). The presence or absence of IPH and IVH was scored dichotomously because it was not possible to measure blood vol-ume in separate locations with our automated quantification method. The differentiation between a blood clot in the Sylvian fissure and an IPH was made on the initial CTA (I.A.Z.).14All
estimates of blood volume and blood location were performed blinded to the presence or absence of DCI.
Statistical Analysis
Descriptive Statistics. Dichotomous variables were presented as percentages. Continuous variables were tested with the Shapiro-Wilk test for normal distribution (W⬎0.9 is considered a nor-mally distributed variable). Nornor-mally distributed variables were expressed as means with SDs, and not normally distributed vari-ables were expressed as medians with interquartile ranges (25%– 75%). Normally distributed variables were tested with the Student
ttest, and not normally distributed variables were tested with the Mann-WhitneyUtest. Categoric variables were tested by using the Fisher exact test.
Modeling. Logistic regression analysis was used to calculate odds ratios with associated 95% confidence intervals. Bivariable anal-yses were performed with previously chosen covariables known to be associated with DCI on the basis of the literature to identify important confounders (defined as variables that changed the crude OR from the univariable analysis by⬎10%).15In the
mul-tivariable analysis, confounders were added to the univariable model to calculate adjusted odds ratios (aORs) with associated 95% CIs.
As our primary analysis, we assessed the association between TBV and clinical DCI (with or without radiologic DCI), logic DCI (with or without clinical DCI), and clinical and radio-logic DCI (patients with both clinical and radioradio-logic DCI) com-bined. Evaluated confounders were age, sex, neurologic status on admission (dichotomized WFNS grade), treatment of the aneu-rysm (clipping/coiling/no treatment), rebleeding, hypertension, IPH, and IVH.
As a secondary analysis, we assessed the association between blood location (IPH and IVH) and clinical DCI (with or without radiologic DCI). We used clinical DCI as the only outcome vari-able because we found similar aORs for all 3 outcome varivari-ables (clinical DCI, radiologic DCI, and both) in the primary analysis. Evaluated confounders were age, sex, neurologic status on admis-sion (dichotomized WFNS grade), treatment of the aneurysm (clipping/coiling/no treatment), rebleeding, hypertension, blood volume, IPH (in the model with IVH as the central determinant), and IVH (in the model with IPH as the central determinant).
Because patients who die within 3 days after the aSAH ictus have a much lower risk of developing DCI, we performed sensi-tivity analyses in the subset of patients who survived⬎3 days after aSAH.
RESULTS
Patient Characteristics
mean TBV was 46.1⫾29.4 mL. Characteristics of the included patients are shown inTable 1.
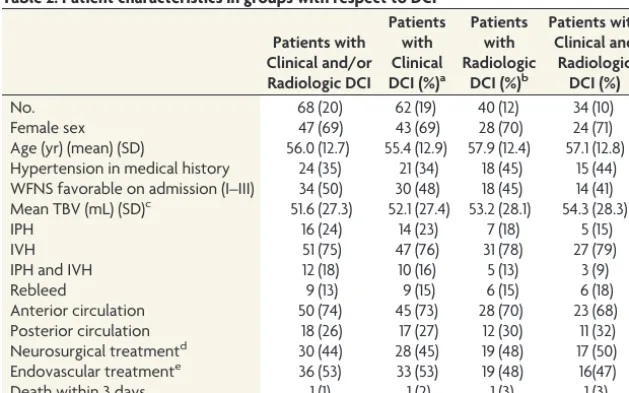
Sixty-eight (20%) patients had clinical and/or radiologic DCI, 62 (19%) had clinical DCI (with or without radiologic DCI), 40 (12%) had radiologic DCI (with or without clinical DCI), and 34 (10%) had both clinical and radiologic DCI. Twenty-eight (8%) patients had only clinical DCI, and 6 (2%) had only radiologic DCI (Table 2). One (2.1%) patient developed clinical signs of DCI 2 days after the aSAH ictus. There were 102 patients (31%) with IPH, 203 patients (61%) with IVH, and 63 patients (19%) with
IPH and IVH combined. Forty-seven (14%) patients died within 3 days of the aSAH ictus. The mean TBV in these patients was 63.0⫾34.1 mL.
Association between Blood Volume and Blood Location and DCI in the Total Group
The aOR (95% CI) of TBV and DCI (clinical, radiologic, both) was 1.02 (1.01–1.03) per milliliter of blood (Table 3). The aOR (95% CI) of IPH and clinical DCI was 0.47 (0.24 – 0.95) and of IVH and clinical DCI, 2.66 (1.37–5.17).
Sensitivity Analysis
In the 286 patients included in the sensitivity analyses, the mean TBV was 43.3⫾27.6 mL. In the subgroup of patients without clinical DCI, the mean TBV was 40.8⫾27.2 mL, and in the sub-group of patients with clinical DCI, 52.3⫾27.5 mL (P⫽.004). IPH occurred in 85 (30%) patients; IVH, in 172 (60%) patients. The association results in the sensitivity analysis (Table 4) are similar to the results in the total group (Table 3).
DISCUSSION
In this study, a higher TBV, quantified with a fully automated method, was significantly associated with the development of DCI. The presence of an intraventricular hematoma was also pos-itively associated with the development of DCI, whereas the
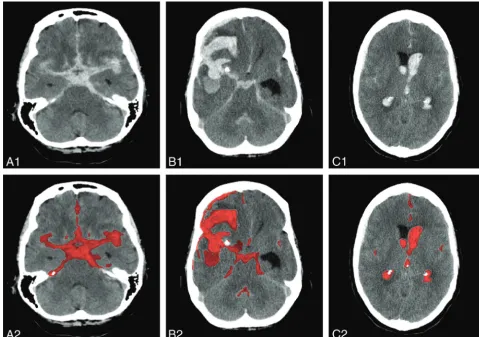
pres-FIG 1. Examples of SAH bleeding patterns on CT (upper), with corresponding segmentations in red as provided by the automatic quantification method (lower).10A, SAH with blood in both Sylvian fissures.B, SAH with the presence of IPH.C, SAH with the presence of IVH.
[image:3.594.52.532.47.384.2] [image:3.594.53.287.423.580.2]ence of an intraparenchymal hematoma was negatively associated with DCI.
The association between TBV and DCI may appear small with an aOR of 1.02 per milliliter of blood. However, considering that the aOR is per milliliter of blood and that in our population, the mean TBV was 46.1 mL and the SD was almost 30 mL, this effect is substantial: A difference of 1 SD of TBV (30 mL) corresponds to an aOR of 1.81.
In both analyses assessing the association between TBV and DCI, we found similar aORs for all 3 outcome variables (clinical DCI, radiologic DCI, and both). This finding could justify using 1 outcome variable in future studies. Clinical DCI would be the most appropriate to use because almost all patients with logic DCI have clinical DCI. Moreover, the importance of radio-logic DCI in the absence of clinical DCI is questionable. CT or MR
imaging might be performed for other reasons, showing areas of ischemia that are clinically unnoticed.
In the first publication on the relation between the amount and distribution of subarachnoid blood detected on NCCT and cerebral vasospasm (detected on an-giography), it was concluded that blood localized in the subarachnoid space in sufficient amounts at specific sites is the only important etiologic factor in vaso-spasm.4Because in our study we found an
association of TBV, IPH, and IVH with clinical and radiologic DCI and not vaso-spasm, these studies are difficult to com-pare. One large difference is that in their study, not 1 patient with IVH developed clinical symptoms of DCI.
Only 1 more recent study investigated a semiautomatic blood quantification to assess the association between cisternal blood volume on NCCT and vasospasm after aSAH.16In this study, a positive
as-sociation was found. However, the method used was laborious because all blood was outlined manually. Moreover, no correction for potential confounders was performed.
Our study results are in line with re-sults from other studies showing that pa-tients without intraventricular blood and with a small amount of cisternal blood af-ter aSAH are less likely to develop DCI, though the results are somewhat different because these studies used vasospasm as an end point instead of DCI.6,7
Neverthe-less, these studies used the modified Fisher score instead of quantified blood volume to assess the amount of intracra-nial blood.4
The positive association between IVH and DCI is not yet understood. Blood can migrate toward the ventricles in 2 ways: first, straight from the aneurysm into the ventricles through a connecting hematoma or, second, by expansion of the subarachnoid blood toward one of the cisternal-ventricular foramina (Luschka, Magendie). The lat-ter implies an initially higher volume of subarachnoid blood, with secondary ventricular redistribution. This might explain the asso-ciation of IVH and DCI in this specific population. Additionally, patients who present with a nonaneurysmal IVH have a very low risk of developing DCI according to a study describing a series of patients with ruptured arteriovenous malformations, of whom 50 had an intraventricular component. Only 1 patient who also had an SAH component developed vasospasm, without signs of DCI.17According to these and our results, it seems that the
com-bination of IVH and aSAH is worse than IVH or aSAH alone. When one tries to explain the negative association of the
pres-Table 1: Patient characteristics
Total Patient Group (%) Patients with Clinical and/or Radiologic DCI Patients without
DCI (%) PValue
No. 333 68 (20) 265 (80) –
Female sex 238 (71) 47 (69) 191 (72) .653
Age (yr) (mean) (SD) 55.7 (11.9) 56.0 (12.7) 55.7 (11.7) .828 Hypertension in medical history 88 (26) 24 (35) 64 (24) .090 WFNS favorable on admission (I–III) 163 (49) 34 (50) 129 (49) .892 Mean TBV (mL) (SD)a 46.1 (29.4) 51.6 (27.3) 44.6 (29.8) .080
IPH 102 (31) 16 (24) 86 (32) .185
IVH 203 (61) 51 (75) 152 (57) .008
IPH and IVH 63 (19) 12 (18) 51 (19) .863
Rebleed 52 (16) 9 (13) 43 (16) .708
Anterior circulation 245 (74) 50 (74) 195 (74) 1.000
Posterior circulation 88 (26) 18 (26) 70 (26)
Neurosurgical treatmentb 141 (42) 30 (44) 111 (42) .325
Endovascular treatmentc 135 (41) 36 (53) 99 (37)
Death within 3 days 47 (14) 1 (1) 46 (17) ⬍.001
a
Automatically quantified total blood volume on noncontrast CT.
b
Two patients treated with bypass surgery.
c
[image:4.594.53.369.56.243.2]One patient treated with stent, and 1 with parent vessel occlusion.
Table 2: Patient characteristics in groups with respect to DCI
Patients with Clinical and/or Radiologic DCI Patients with Clinical DCI (%)a
Patients with Radiologic
DCI (%)b
Patients with Clinical and
Radiologic DCI (%)
No. 68 (20) 62 (19) 40 (12) 34 (10)
Female sex 47 (69) 43 (69) 28 (70) 24 (71)
Age (yr) (mean) (SD) 56.0 (12.7) 55.4 (12.9) 57.9 (12.4) 57.1 (12.8) Hypertension in medical history 24 (35) 21 (34) 18 (45) 15 (44) WFNS favorable on admission (I–III) 34 (50) 30 (48) 18 (45) 14 (41) Mean TBV (mL) (SD)c 51.6 (27.3) 52.1 (27.4) 53.2 (28.1) 54.3 (28.3)
IPH 16 (24) 14 (23) 7 (18) 5 (15)
IVH 51 (75) 47 (76) 31 (78) 27 (79)
IPH and IVH 12 (18) 10 (16) 5 (13) 3 (9)
Rebleed 9 (13) 9 (15) 6 (15) 6 (18)
Anterior circulation 50 (74) 45 (73) 28 (70) 23 (68)
Posterior circulation 18 (26) 17 (27) 12 (30) 11 (32)
Neurosurgical treatmentd 30 (44) 28 (45) 19 (48) 17 (50)
Endovascular treatmente 36 (53) 33 (53) 19 (48) 16(47)
Death within 3 days 1 (1) 1 (2) 1 (3) 1 (3)
aClinical DCI with or without radiologic DCI. b
Radiologic DCI with or without clinical DCI.
cAutomatically quantified total blood volume on noncontrast CT. d
Two patients treated with bypass surgery.
[image:4.594.53.368.298.494.2]ence of an IPH with clinical DCI, it could very well be that in these patients, clinical DCI was less often detected because they already had a neurologic deficit due to the IPH. To our knowledge, there is no literature confirming this theory. Further studies are needed to confirm this and to determine the association between IVH and IPH and DCI. In such a study, blood volume values for each separate compartment can be determined and subsequently asso-ciated with the clinical course.
The strengths of our study are fast and objective estimation of the TBV by using a validated automatic quantification method, adjustment for confounders to make the estimation of the asso-ciation more reliable, and performance of a sensitivity analysis to evaluate the robustness of the model. In addition, we used DCI as an outcome variable instead of vasospasm because DCI is a more clinically relevant outcome measure and because vasospasm and DCI can occur independently.2,12In future studies, it might be
possible to use the automated quantification method to study other subtypes of SAH (eg, due to intracranial dissection, AVM, benign perimesencephalic hemorrhage, and trauma).
Our study has some limitations. This was a retrospective study in which we could only study the data that were available in the clinical charts and on the available NCCTs. Because patients were followed up only during hospitalization, we may have potentially missed patients with DCI after discharge. In patients with clinical rebleeding within 24 hours after aSAH ictus, we might have un-derestimated the blood volume because this rebleeding was not CT-confirmed. Death during admission may be a competing risk for the development of DCI. Unfortunately, due to the composi-tion of our data, we were unable to perform a reliable competing risk analysis.
Limitations of the automated quantification method are that imaging artifacts can make the results unreliable. Although we do
not expect differences in the detection rate of TBV and aSAH between the ante-rior and posteante-rior circulations, we have not yet investigated this possibility. Very small blood volumes with low density are not well-detected with automated detec-tion.10The volume assessments were
per-formed on relatively thick sections of 5 mm. Thinner sections could potentially increase accuracy. However, with thinner sections, the noise level increases as well, which may actually reduce the accuracy. The method was validated by using 5-mm sections, and 5 mm is the standard section thickness used in our hospital and the re-ferring centers. The volume of the IPH and IVH and the blood volume in sepa-rate territories could not be sepasepa-rately delineated.
CONCLUSIONS
We show that a higher TBV, measured with our automated quantification method, is significantly associated with DCI. The results of this study encourage the use of rater-independent quantifica-tion methods in future multicenter studies on DCI prevenquantifica-tion and prediction.
Disclosures: Henk A. Marquering—RELATED:Grant: NutsOhra,*Comments: The evaluation of the prognostic value of the quantitative hemorrhage volume detec-tion is being sponsored by a grant from NutsOhra;UNRELATED:Grants/Grants Pending: NutsOhra.* Rene van den Berg—UNRELATED:Consultancy: DePuy Cod-man, Comments: coil development. Charles B. Majoie—UNRELATED: Grants/ Grants Pending: Dutch Heart Foundation,* Toegepast Wetenschappelijk Instituut voor Neuromodulatie Foundation*;Payment for Lectures (including service on Speakers Bureaus): Stryker.* *Money paid to the institution.
REFERENCES
1. Budohoski KP, Guilfoyle M, Helmy A, et al.The pathophysiology and treatment of delayed cerebral ischaemia following subarach-noid haemorrhage.J Neurol Neurosurg Psychiatry2014;85:1343–53
CrossRef Medline
2. Cossu G, Messerer M, Oddo M, et al.To look beyond vasospasm in aneurysmal subarachnoid haemorrhage.Biomed Res Int2014;2014: 628597CrossRef Medline
3. Macdonald RL.Delayed neurological deterioration after subarach-noid haemorrhage.Nat Rev Neurol2014;10:44 –58CrossRef Medline
4. Fisher CM, Kistler JP, Davis JM.Relation of cerebral vasospasm to subarachnoid hemorrhage visualized by computerized tomo-graphic scanning.Neurosurgery1980;6:1–9CrossRef Medline
5. Frontera JA, Claassen J, Schmidt JM, et al.Prediction of symptom-atic vasospasm after subarachnoid hemorrhage: the modified Fisher scale.Neurosurgery2006;59:21–27, discussion 21–27Medline
6. Claassen J, Bernardini GL, Kreiter K, et al.Effect of cisternal and ventricular blood on risk of delayed cerebral ischemia after sub-arachnoid hemorrhage: the Fisher scale revisited.Stroke2001;32: 2012–20CrossRef Medline
7. de Rooij NK, Greving JP, Rinkel GJ, et al.Early prediction of delayed cerebral ischemia after subarachnoid hemorrhage: development and validation of a practical risk chart.Stroke2013;44:1288 –94
[image:5.594.52.370.68.141.2]CrossRef Medline
Table 3: Associations between blood volume and blood location and DCI in the total group (Nⴝ333)
Dependent Variable
Central
Determinant OR (95% CI) aOR (95% CI) Clinical DCI (with or without radiologic DCI) TBVa 1.01 (1.0–1.02)b 1.02 (1.01–1.03)b
IPHc 0.61 (0.32–1.16) 0.47 (0.24–0.95)
IVHd 2.31 (1.23–4.33) 2.66 (1.37–5.17)
Radiologic DCI (with or without clinical DCI) TBVe 1.01 (1.0–1.02)b 1.02 (1.01–1.03)b
Clinical and radiologic DCI TBVf 1.01 (1.0–1.02)b 1.02 (1.01–1.03)b
a
Confounders: age, WFNS, treatment, IPH, and IVH.
b
Per milliliter of blood.
c
Confounder: treatment.
d
Confounders: WFNS and blood volume.
e
Confounders: age, treatment, IPH, and IVH.
f
Confounder: treatment, IPH, and IVH.
Table 4: Associations between blood volume and blood location and DCI in patients who survived 3 days or more (nⴝ286)
Dependent Variable
Central
Determinant OR (95% CI) aOR (95% CI) Clinical DCI (with or without radiologic DCI) TBVa 1.01 (1.00–1.03)b 1.02 (1.01–1.03)b
IPHc 0.65 (0.33–1.25) 0.43 (0.21–0.89)
IVHd 2.41 (1.27–4.57) 2.03 (1.05–3.92)
Radiologic DCI (with or without clinical DCI) TBVa 1.01 (1.00–1.03)b 1.02 (1.01–1.03)b
Clinical and radiologic DCI TBVa 1.02 (1.00–1.03)b 1.02 (1.01–1.03)b
aConfounders: IPH and IVH. b
Per milliliter of blood.
cConfounders: WFNS, blood volume, and IVH. d
[image:5.594.54.370.224.297.2]8. de Rooij NK, Rinkel GJ, Dankbaar JW, et al.Delayed cerebral isch-emia after subarachnoid hemorrhage: a systematic review of clini-cal, laboratory, and radiological predictors.Stroke2013;44:43–54
CrossRef Medline
9. Crobeddu E, Mittal MK, Dupont S, et al.Predicting the lack of development of delayed cerebral ischemia after aneurysmal sub-arachnoid hemorrhage. Stroke 2012;43:697–701 CrossRef Medline
10. Boers AM, Zijlstra IA, Gathier CS, et al.Automatic quantification of subarachnoid hemorrhage on noncontrast CT.AJNR Am J Neuro-radiol2014;35:2279 – 86CrossRef Medline
11. Report of World Federation of Neurological Surgeons Committee on a Universal Subarachnoid Hemorrhage Grading Scale.J Neuro-surg1988;68:985– 86Medline
12. Vergouwen MD.Vasospasm versus delayed cerebral ischemia as an outcome event in clinical trials and observational studies.Neurocrit Care2011;15:308 –11CrossRef Medline
13. Yushkevich PA, Piven J, Hazlett HC, et al.User-guided 3D active contour segmentation of anatomical structures: significantly im-proved efficiency and reliability. Neuroimage 2006;31:1116 –28
CrossRef Medline
14. van der Zande JJ, Hendrikse J, Rinkel GJ.CT angiography for differ-entiation between intracerebral and intra-Sylvian hematoma in pa-tients with ruptured middle cerebral artery aneurysms.AJNR Am J Neuroradiol2011;32:271–75CrossRef Medline
15. Twisk JW.Inleiding in de toegepaste biostatistiek.Vol 3. Maarssen: Elsevier Gezondheidszorg; 2014:242
16. Friedman JA, Goerss SJ, Meyer FB, et al.Volumetric quantification of Fisher grade 3 aneurysmal subarachnoid hemorrhage: a novel method to predict symptomatic vasospasm on admission comput-erized tomography scans. J Neurosurg 2002;97:401– 07CrossRef Medline