www.atmos-meas-tech.net/9/1613/2016/ doi:10.5194/amt-9-1613-2016
© Author(s) 2016. CC Attribution 3.0 License.
Evaluation of two Vaisala RS92 radiosonde solar radiative dry bias
correction algorithms
Andrew M. Dzambo1, David D. Turner2, and Eli J. Mlawer3
1Cooperative Institute for Mesoscale Meteorological Studies, University of Oklahoma,
Norman, OK, USA
2National Severe Storms Laboratory/NOAA, Norman, OK, USA 3Atmospheric and Environmental Research, Inc., Lexington, MA, USA
Correspondence to: David D. Turner ([email protected])
Received: 28 August 2015 – Published in Atmos. Meas. Tech. Discuss.: 20 October 2015 Revised: 28 March 2016 – Accepted: 30 March 2016 – Published: 12 April 2016
Abstract. Solar heating of the relative humidity (RH) probe on Vaisala RS92 radiosondes results in a large dry bias in the upper troposphere. Two different algorithms (Miloshevich et al., 2009, MILO hereafter; and Wang et al., 2013, WANG hereafter) have been designed to account for this solar radia-tive dry bias (SRDB). These corrections are markedly dif-ferent with MILO adding up to 40 % more moisture to the original radiosonde profile than WANG; however, the im-pact of the two algorithms varies with height. The accu-racy of these two algorithms is evaluated using three dif-ferent approaches: a comparison of precipitable water vapor (PWV), downwelling radiative closure with a surface-based microwave radiometer at a high-altitude site (5.3 km m.s.l.), and upwelling radiative closure with the space-based Atmo-spheric Infrared Sounder (AIRS).
The PWV computed from the uncorrected and corrected RH data is compared against PWV retrieved from ground-based microwave radiometers at tropical, midlatitude, and arctic sites. Although MILO generally adds more moisture to the original radiosonde profile in the upper troposphere com-pared to WANG, both corrections yield similar changes to the PWV, and the corrected data agree well with the ground-based retrievals.
The two closure activities – done for clear-sky scenes – use the radiative transfer models MonoRTM and LBLRTM to compute radiance from the radiosonde profiles to com-pare against spectral observations. Both WANG- and MILO-corrected RHs are statistically better than original RH in all cases except for the driest 30 % of cases in the downwelling experiment, where both algorithms add too much water vapor
to the original profile. In the upwelling experiment, the RH correction applied by the WANG vs. MILO algorithm is sta-tistically different above 10 km for the driest 30 % of cases and above 8 km for the moistest 30 % of cases, suggesting that the MILO correction performs better than the WANG in clear-sky scenes. The cause of this statistical significance is likely explained by the fact the WANG correction also ac-counts for cloud cover – a condition not accounted for in the radiance closure experiments.
1 Introduction
Vaisala RS92 radiosondes have been launched by research and operational centers for over a decade and, compared to most ground and space-based instruments, provide very high (∼10 m) vertical resolution. The RS92 radiosonde utilizes two thin-film capacitive elements to measure water vapor, wherein the capacitance measured by the radiosonde is pro-portional to the number of water vapor molecules that are in contact with the sensor. The resulting relative humidity (RH) measurement is taken as a function of this capacitance and the air temperature, which is measured by a separate thin capacitive wire sensor. While in flight, one of the RH sen-sors measures WV while the other RH sensor is artificially warmed to prevent ice buildup on the sensor; this process al-ternates between sensors. Unlike its predecessors (such as the RS80 radiosonde), the RH sensor is not shielded from solar radiation. If the RH sensor is warmer than the ambient envi-ronment due to solar heating, then the measured RH (as com-puted by Vaisala’s DigiCORA®software) will be lower than its actual value. Many correction algorithms have been de-veloped (e.g., Vömel et al., 2007b; Cady-Pereira et al., 2008; Yoneyama et al., 2008; Miloshevich et al., 2009; Wang et al., 2013) to correct for this solar radiative dry bias (SRDB). Nearly all of the aforementioned algorithms correct RH as a function of pressure, solar elevation (zenith) angle, and/or RH itself.
Two of the most widely used correction algorithms come from the work of Wang et al. (2013) and Miloshevich et al. (2009); for brevity, these will be referred to as WANG and MILO hereafter. WANG used Global Climate Observing System (GCOS) Reference Upper-Air Network (GRUAN) data (Seidel et al., 2009; Dirksen et al., 2014) to develop and test their RS92 correction algorithm. This physically based correction uses the following form:
RHCORR=RH
e
s(T+hf·1TCORR)
es(T )
, (1)
1TCORR=cf·1TCORRRSN, (2)
where T is the sonde-measured air temperature, hf is a heating factor (set to 13), cf is a correction factor (set to 0.4 below 500 hPa and 0.6 above 500 hPa) that accounts for both clear skies and cloud cover, and 1TCORRRSN is a temperature correction given by Vaisala (http://www. vaisala.com/en/products/soundingsystemsandradiosondes/ soundingdatacontinuity/RS92DataContinuity/Pages/ revisedsolarradiationcorrectiontableRSN2010.aspx). Note that1TCORRRSNaccounts for pressure and solar zenith angle. The MILO correction was developed using cryo-genic frost-point hygrometer (CFH), microwave radiometer (MWR), and reference humidity probes during the 2006 Wa-ter Vapor Validation Experiment Satellite/Sondes (WAVES) campaign (Vömel et al., 2007a). MILO consists of an empir-ically developed correction:
RHCORR=G (P ,RH)×RHTLAG, (3)
SRE(α)=SRE 66◦
×fraction(α) , (4)
where G(P ,RH) is an empirically derived function and given as a “look-up” table of coefficients in Miloshevich et al. (2009), and RHTLAGis the original RH data that have been
corrected for time lag1. The MILO correction also includes a correction based on solar zenith angle (Eq. 4), which is applied to Eq. (3): solar radiation error (SRE) is dependent on solar altitude angle (α)and expressed as a fraction of the SRE at 66◦, which represents the mean solar zenith angle for the daytime CFH/RS92 soundings during WAVES (Miloshe-vich et al., 2009). A comparison of these two correction al-gorithms in a typical atmospheric sounding is given in Fig. 1. In 2011, Vaisala upgraded its DigiCORA®software to ver-sion 3.64, which included their own time-lag and SRDB cor-rection algorithm. Although the details of this algorithm are not freely available to the public, it is possible to deactivate the time-lag and SRDB corrections during configuration of the sonde. We note that for results shown later in this study, the RS92 RH data are not corrected for time-lag error2 be-cause the average change in RH between time-lag corrected and non-time-lag corrected data is almost always around 0 % and at most around 2 % for 25 hPa bins (results not shown). This study focuses on RS92 radiosondes collected before this change to the DigiCORA software was made.
We evaluate the WANG and MILO SRDB corrections at sites maintained by the Department of Energy’s (DOE) At-mospheric Radiation Measurement (ARM) program (Acker-man and Stokes, 2003; Mather and Voyles, 2013), at which numerous instruments are deployed that will aid in this evalu-ation. We use data from the ARM sites in the Southern Great Plains (SGP) in Lamont, OK, USA, North Slope Alaska (NSA) in Barrow, AK, USA, and the tropical western Pa-cific (TWP) on Nauru Island, Republic of Nauru (Stokes and Schwartz, 1994). We also use ARM data collected during a 3-month experiment at a 5300 m m.s.l. site at Cerro Toco (CJC) in northern Chile (Turner and Mlawer, 2010). Utilizing sev-eral distinct climate locations ensures a more accurate and in-depth analysis of the two correction algorithms.
2 Comparing the correction algorithms directly The two correction algorithms were applied to RS92 data launched at the SGP, NSA, TWP, and CJC sites. These data spanned all months of the year. The mean change in water
1Although the time-lag correction was developed for RS80 ra-diosondes, RS92 radiosondes also require a time-lag correction. See Miloshevich et al. (2009) and Dirksen et al. (2014) for more infor-mation.
0 20 40 60 80 100 Relative humidity (%) 1000
800 600 400 200 0
Pressure (hPa)
RH_ORIG
RH_WANG
RH_MILO
-5 0 5 10 15 20 Relative humidity difference (%)
WANG - ORIG
MILO - ORIG
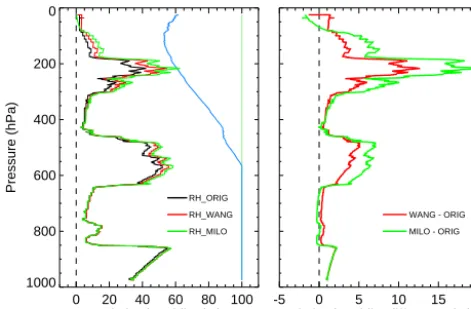
Figure 1. A comparison of the WANG- and MILO-corrected RH
profiles (left plot; red and green, respectively) compared to the orig-inal RH profile (black). The light blue line represents the satura-tion RH with respect to ice. The right plot shows the difference between the original RH profile and the WANG/MILO RH profiles (red/green), respectively. This example is the 18Z sounding for the SGP site on 15 June 2006.
vapor mixing ratio as a function of height (relative to the original radiosonde measurement) for each site is shown in Fig. 2. The largest difference between the two correction algorithms is in the middle and upper troposphere above 7 km, where the MILO algorithm moistens the original ra-diosonde much more than the WANG correction; the differ-ence between MILO and WANG approaches a factor of 1.8 by 14 km. Given the sensitivity of the outgoing long-wave radiation to changes in upper-tropospheric water vapor (e.g., Ferrare et al., 2004), understanding which of these correc-tions is more appropriate is very important. However, a close inspection of Fig. 2 also shows that the WANG correction moistens the radiosonde slightly more than the MILO correc-tion in the lowest 2 km for the moister tropic and midlatitude sites.
We compare the precipitable water vapor (PWV) values derived from integrating the moisture profiles from the orig-inal and corrected radiosonde profiles with those retrieved from the ARM two-channel MWRs using the so-called “MWRRET” algorithm (Turner et al., 2007). ARM has used the MWR-retrieved PWV as a “standard” for correcting for first-order radiosonde biases (Turner et al., 2003; Cady-Pereira et al., 2008), calibrating its Raman lidar (Turner and Goldsmith, 1999), and evaluating infrared radiative transfer models (e.g., Turner et al., 2004).
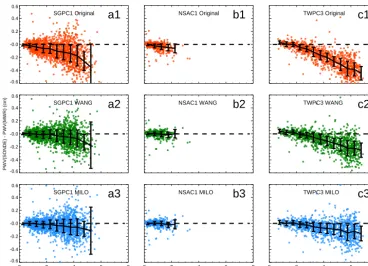
The comparisons of the radiosonde PWV values with those from the MWR (Fig. 3) show that the original un-corrected radiosondes have a dry bias that increases as the PWV increases. Table 1 summarizes the median and stan-dard deviations; in an effort to remove outliers, values that were below/above the 5th/95th percentile were removed be-fore computing the PWV biases. Figure 3a1 shows that the
0 20 40 60 80 100
Mixing ratio percent increase (%) 0
2 4 6 8 10 12 14
Height above sea level (km)
Legend
SGP_C1: WANG SGP_C1: MILO NSA_C1: WANG NSA_C1: MILO CJC_C1: WANG CJC_C1: MILO TWP_C2: WANG TWP_C2: MILO
0 5 10 15
SD (%)
# Profiles
SGP_C1: 237
NSA_C1: 237
CJC_C1: 142
TWP_C2: 239
-2 0 2 4 6 8 10
0 1 2 3 4
Figure 2. The mean relative increase in the water vapor mixing
ra-tio caused by the two correcra-tion algorithms for RS92 radiosondes launched at the SGP, NSA, TWP, and CJC sites (left) and the stan-dard deviation (right) as a function of height. The MILO (WANG)-corrected data are shown with dotted (solid) lines. The number of comparisons for each site is shown in the figure. NSA results are only shown up to the mean tropopause height (10 km). The inset plot on the main figure is the mean relative increase in the water va-por mixing ratio caused by the two correction algorithms, but only from 0 to 4 km.
mean PWV from the original radiosondes at SGP are approx-imately 0.35 cm drier than the MWR-retrieved value in the 4.25–4.75 cm bin; however, the Wang-corrected radiosonde, while moister than the original radiosonde, still has a slight dry bias of 0.10 cm relative to the MWR in this bin (Fig. 3a3). The magnitude of the PWV bias generally increases when more PWV is present in the atmosphere. Both the WANG and MILO corrections increase the sonde’s derived PWV and result in much better agreement with the MWR. This result is consistent with the findings in Yu et al. (2015), where MWR retrievals of PWV and PWV derived from WANG-corrected RH data were found to be within the uncertainty of the MWR instrument (which is∼0.07 cm; Turner et al., 2007).
-0.6 -0.4 -0.2 -0.0 0.2 0.4 0.6
SGPC1 Original
a1
-0.6 -0.4 -0.2 -0.0 0.2 0.4 0.6
PWV(SONDE) - PWV(MWR) (cm)
SGPC1 WANG
a2
0 2 4 6 8
-0.6 -0.4 -0.2 -0.0 0.2 0.4 0.6
SGPC1 MILO
a3
NSAC1 Original
b1
NSAC1 WANG
b2
0 2 4 6 8
Precipitable water vapor (cm)
NSAC1 MILO
b3
TWPC3 Original
c1
TWPC3 WANG
c2
0 2 4 6 8
TWPC3 MILO
c3
Figure 3. A comparison between the PWV derived from the original radiosonde data (top), WANG-corrected (middle), and MILO-corrected
(bottom) radiosonde data with the PWV derived from the collocated MWR at the SGP site (panels a1, a2, and a3), NSA site (panels b1, b2, and b3), and TWP Darwin site (panels c1, c2, and c3). The solid black line superimposed on the data denotes the mean values for each PWV bin, and the vertical lines represent the standard deviations.
Table 1. A summary of the microwave radiometer and radiosonde un/corrected PWV biases (in mm) with±1σuncertainty from the ARM’s SGP, NSA, and TWP (Darwin) site.
SGP site – Lamont, OK, USA NSA site – Barrow, AK, USA TWP site – Darwin, Australia
(ORIG-MWR) PWV bias −0.66±2.16 mm −0.19±0.60 mm −1.98±1.99 mm
N=1745 points
(WANG-MWR) PWV bias −0.17±2.50 mm 0.01±1.57 mm −0.94±1.68 mm
N=371 points
(MILO-MWR) PWV bias −0.19±2.01 mm −0.00±0.52 mm −0.63±1.57 mm
N=1009 points
To evaluate the accuracy of the two SRDB corrections as a function of height, we first considered comparing the cor-rected radiosondes with water vapor measurements made by the ARM Raman lidars (Goldsmith et al., 1998; Ferrare et al., 2006) at the SGP and TWP/Darwin sites. Unfortunately, during the daytime the Raman lidar observations are limited to altitudes below 5 km and thus unable to provide any in-sight into the accuracy of the two corrections in the upper troposphere.
Instead we use two radiance closure experiments to evalu-ate the two corrections in the upper troposphere: one down-welling experiment and one updown-welling experiment. Radi-ance closure studies have been used in prior studies to val-idate sonde-derived brightness temperature (TB)
measure-ments (e.g., Turner et al., 2003; Soden et al., 2004; Mattioli
et al., 2008; Kottayil et al., 2012; Moradi et al., 2013a, b) and offer another method for detecting systematic biases in radiosonde RH measurements. In each experiment, a radia-tive transfer model is used to transform the original RH data, along with the WANG- and MILO-corrected RH data, into simulated brightness temperatures. The model-derived TB
3 Downwelling experiment
The ARM program conducted the second phase of the Radia-tive Heating in Underexplored Bands Campaign (RHUBC-II) in CJC in August through October 2009 (Turner and Mlawer, 2010). The CJC site is located approximately 5.3 km above sea level in the Atacama Desert; this site can be consid-ered a mid-tropospheric site due to its altitude and water va-por conditions. Also, during RHUBC-II, there was a high fre-quency occurrence of clear-sky and dry conditions, making it optimal for studying the accuracy of upper-tropospheric wa-ter vapor measurements.
Our reference instrument is the G-band water vapor ra-diometer profiler (GVRP). The GVRP measures down-welling radiation in 15 channels at 170.0, 171.0, 172.0, . . . , 182.0, 183.0, and 183.31 GHz. Cimini et al. (2009) showed that the GVRP (in that paper, referred to as “MP-183”) agreed within uncertainty with two other collocated 183 GHz radiometers during RHUBC-I, which was held at the NSA site in February–March 2007. The lower frequency channels (e.g., below 178 GHz) are more sensitive to the total PWV, while the higher frequency channels are more sensitive to middle/upper-tropospheric water vapor (Fig. 4; Cimini et al., 2009). The GVRP has an uncertainty of 1.5 K for TB
mea-surements (Cadeddu, 2010; Cadeddu et al., 2013).
The corrected and uncorrected RH data from the 144 RS92 radiosondes launched during RHUBC-II were used as input into version 4.1 of the MonoRTM radiative transfer model (Payne et al., 2008, 2011; Clough et al., 2005) to compute monochromatic downwelling radiance at high spectral reso-lution (10 MHz) from 168 to 185 GHz. Since the Cerro Toco site almost always has clear skies, the model was run to com-pute clear-sky radiances (methodology for identifying cases with environmental inhomogeneity or clouds is described in the next paragraph). These computed clear-sky monochro-matic spectra were convolved with the GVRP’s instrument response function to calculate brightness temperatures corre-sponding to each GVRP channel. These model-derived radi-ances, which were converted toTB, were directly compared
to theTBmeasurements made by the GVRP.
To reduce the complexity of the analysis, we restricted our comparisons to clear-sky conditions only. To identify cloudy-sky conditions as well as inhomogeneous environments (i.e., when there was a horizontal gradient in water vapor across the RHUBC-II site), the standard deviation of the GVRPTB
measurements at 174 GHz over a 30 min window centered at the radiosonde launch time at both 30 and 150◦ was
com-puted. When the standard deviation at either angle (where 90◦ corresponds to zenith) was more than 2.25 K, the sky conditions were not considered uniform and the sonde was removed from subsequent analysis. This additional screen-ing also accounts for inhomogeneity created by localized mountain-scale circulations and a thermally driven circula-tion across the Cerro Toco site (Marín et al., 2013).
170 175 180 185 190 Frequency (GHz)
5 6 7 8 9 10 11 12
Altitude (km MSL)
0 1 0 100 200 300
WV
Jacobian
(K
/
(g
kg
))
-1
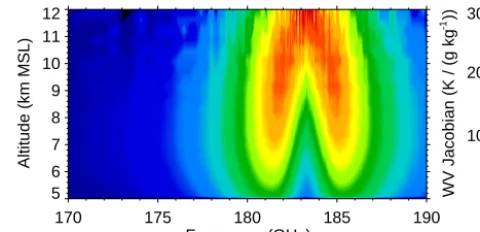
Figure 4. The water vapor Jacobian computed for mean conditions
at Cerro Toco (surface altitude is 5.3 km m.s.l.) at the GVRP fre-quencies. The PWV for this case was 1.1 mm.
The comparison of the MonoRTM TB calculations
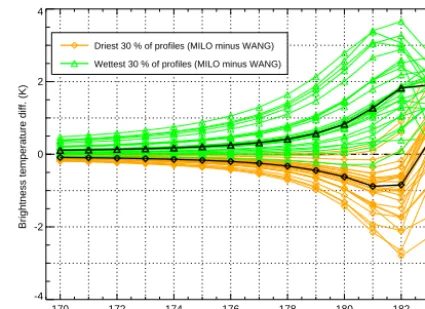
us-ing the MILO- and WANG-corrected radiosondes as input demonstrated a different spectral character based upon the PWV in the profile. For the moistest 30 % of the CJC ra-diosondes (i.e., where the PWV > 0.57 mm, where the max-imum PWV observed at CJC was 1.20 mm), the MILO-computedTBwas typically larger than the WANG-computed
values at all GVRP frequencies (Fig. 5, green spectra), which implies that the MILO-corrected radiosondes are moister over the entire profile. However, for the driest 30 % of the CJC radiosondes (i.e., PWV < 0.37 mm), theTBvalues
com-puted using the WANG-corrected profiles are larger than the MILO-computed radiance for frequencies below 182 GHz (Fig. 5, orange spectra). This suggests that the WANG-corrected radiosondes are moister than the MILO-WANG-corrected data, especially in the lowest several kilometers of the at-mosphere. Most importantly, this analysis suggests that the significant differences in how the two correction algorithms behave at different PWV amounts can be used with GVRP spectral observations to evaluate both algorithms.
The median observed minus computed brightness temper-ature spectra for the WANG- and MILO-corrected radioson-des are shown in Fig. 6; these data are also divided into the 30 % moistest and 30 % driest profiles, each of which has 26 cases. Table 2 summarizes the median biases for the 30 % moistest profiles and 30 % driest profiles with standard devi-ations. For the median of the driest cases, the MonoRTM-derived TB calculations for both correction algorithms are
approximately 1–4 K warmer than the GVRP observations for frequencies between 170 and 178 GHz, increasing to over 13 K warmer than the GVRP at the center of the wa-ter vapor absorption line at 183.3 GHz. This suggests that both correction algorithms actually worsen the MonoRTM-derived TB measurements (compared to TB measurements
T able 2. A summary of the median T b biases between the MonoR TM-deri v ed T b and GVRP T B measurements using original radiosonde RH data and W ANG/MILO-corrected radiosonde RH data. Data are represented as a median bias with ± 1 standard de viation. 170.0 GHz 172.0 GHz 174.0 GHz 176.0 GHz 178.0 GHz 179.0 GHz 180.0 GHz 181.0 GHz 182.0 GHz 183.0 GHz 183.31 GHz Moist 30 % ORIG − 0.70 ± 0.97 K − 0.96 ± 1.15 K − 1.65 ± 1.25 K − 2.20 ± 1.37 K − 2.22 ± 2.17 K − 3.03 ± 2.79 K − 4.94 ± 4.20 K − 3.98 ± 5.47 K − 8.27 ± 5.67 K − 10.41 ± 4.11 K − 10.38 ± 3.89 K Moist 30 % W ANG 0.27 ± 0.97 K 0.22 ± 1.12 K − 0.14 ± 1.16 K − 0.08 ± 1.31 K 1.09 ± 2.07 K 1.27 ± 2.64 K 0.65 ± 4.08 K 3.75 ± 5.22 K 2.46 ± 5.67 K 0.42 ± 4.40 K 0.33 ± 4.09 K Moist 30 % MILO 0.34 ± 0.96 K 0.32 ± 1.11 K 0.01 ± 1.15 K 0.17 ± 1.36 K 1.63 ± 2.08 K 2.19 ± 2.57 K 2.14 ± 4.08 K 5.80 ± 5.32 K 3.737 ± 5.65 K 1.778 ± 4.37 K 1.75 ± 4.06 K Dry 30 % ORIG 1.19 ± 0.61 K 1.56 ± 0.62 K 1.67 ± 0.80 K 1.58 ± 0.65 K 2.47 ± 1.24 K 2.71 ± 1.55 K 2.29 ± 2.048 K 4.91 ± 2.90 K 6.618 ± 4.81 K 3.208 ± 5.89 K 1.73 ± 5.99 K Dry 30 % W ANG 1.53 ± 0.62 K 1.98 ± 0.66 K 2.22 ± 0.80 K 2.37 ± 0.68 K 3.78 ± 1.29 K 4.54 ± 1.65 K 5.17 ± 2.17 K 10.00 ± 3.08 K 15.82 ± 5.24 K 14.75 ± 6.67 K 13.58 ± 6.80 K Dry 30 % MILO 1.47 ± 0.60 K 1.90 ± 0.65 K 2.12 ± 0.78 K 2.22 ± 0.67 K 3.55 ± 1.32 K 4.21 ± 1.66 K 4.51 ± 2.20 K 8.35 ± 3.08 K 14.09 ± 5.17 K 15.67 ± 6.62 K 14.47 ± 6.71 K
170 172 174 176 178 180 182
Frequency (GHz) -4 -2 0 2 4
Brightness temperature diff. (K)
Driest 30 % of profiles (MILO minus WANG)
Wettest 30 % of profiles (MILO minus WANG)
Figure 5. Downwelling brightness temperature differences between
MonoRTM calculations using the WANG- and MILO-corrected RH profile as input. Data are sorted by the moistest 30 % and driest 30 % of all profiles in the CJC data set (green and orange, respectively). The thick black lines are the mean spectral residual for the two sub-sets of data.
170 172 174 176 178 180 182
Frequency (GHz) -15 -10 -5 0 5 10 15 20
Brightness temperature difference (K)
Dry ORIG minus GVRP Dry WANG minus GVRP Dry MILO minus GVRP Moist ORIG minus GVRP Moist WANG minus GVRP Moist MILO minus GVRP
Figure 6. Median MonoRTM minus GVRP spectral residuals,
where the MonoRTM was driven by WANG- and MILO-corrected radiosondes (red/green and blue/brown, respectively) and uncor-rected radiosondes (gray lines). These median residuals were com-puted for the moistest and driest 30 % of the CJC radiosondes, as shown in Fig. 4.
of the two correction algorithms increases the scatter be-tween the GVRP and MonoRTM-computedTBat 183.0 and
0 20 40 60 80 100 Relative humidity (%)
1000 800 600 400 200
Pressure (hPa)
CJC site, Cerro Toco, Chile TWP site, Nauru Island, Nauru SGP site, Lamont, OK NSA site, Barrow, AK
Figure 7. Median (uncorrected) RH profiles for four arm sites. RH
is grouped in 25 hPa bins (starting at 1000 hPa), and the median is computed from that bin. There are 142 soundings for the CJC site, 2500 soundings across the annual cycle for the SGP and TWP (Nauru) sites, and 1712 soundings for the NSA site.
A much different story, however, is seen in the 30 % moistest profiles. The meanTBbias between the GVRP
ob-servations and the MonoRTM calculations using both the WANG and MILO-corrected input data from this moist sub-set is much smaller than for the 30 % driest profiles. The WANG/MILO MonoRTM calculations also yield slightly moist-biased results compared to the original RH MonoRTM calculations, which are dry biased (Fig. 6). The good agree-ment between the observed and computed spectra for fre-quencies less than 177 GHz suggests that both algorithms have the PWV correct, as these channels have relatively constant weighting functions with height. At 183.0 and 183.31 GHz, the MonoRTM-derived TBcalculations for the
WANG calculation are warm biased by 0.42 and 0.33 K, respectively, whereas theTBcalculations using the
MILO-corrected radiosondes are warm biased by approximately 1.8 K. While these results seem to indicate that WANG-corrected radiosondes are in better agreement with the GVRP observations, this result is not statistically significant. Inter-estingly, the scatter in the GVRP minus MonoRTM residuals at these two frequencies is very similar between the calcula-tions that used the original RH profile and either of the two corrected RH profiles (Table 2). The moist 30 % cases in this analysis, when compared to other distinct climatological lo-cations (Fig. 8), are considerably drier when compared to a tropical location (e.g., the ARM TWP Nauru site).
As a consistency check for theTBresiduals (computed as
observed minus computed) derived from original, WANG-and MILO-corrected RH data, a one-sided Student t test is performed on the 30 % partitioned moist and dry cases for all 15 MonoRTM frequencies (results not shown here). For the moistest and driest 30 % of cases, WANG- and MILO-corrected RHs are statistically significant (at the p=0.05
0.0 2.0 4.0 6.0 8.0
Integrated water vapor (mm) 0
5 10 15 20 25 30
Percent occurrence (%)
CJC site, Cerro Toco, Chile
TWP site, Nauru Island, Nauru
SGP site, Lamont, OK
NSA site, Barrow, AK
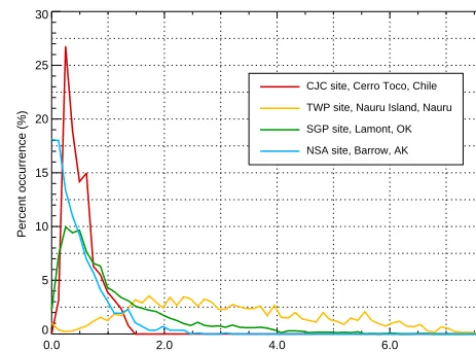
Figure 8. Distributions of upper-tropospheric integrated water
va-por (IWV) from 530 to 200 hPa for four ARM sites, each with dis-tinct climates. The mean surface pressure at the CJC site is 530 hPa, while 200 hPa is the approximate height of the tropopause.
level) from the original RH data. A one-sided Studentt test between WANG and MILO for the moistest or driest 30 % of cases, however, reveals no statistical significance at any frequency. Despite the noted difference in biases from Fig. 6, we cannot reasonably conclude that one correction algorithm is better than the other. Hence, a second experiment is needed to further deduce differences between the WANG and MILO corrections.
4 Upwelling experiment
The downwelling radiance closure experiment demonstrated that both WANG- and MILO-corrected RH data are im-proved over the original RH data only for the moister cases at CJC. However, while the CJC site is representative of a mid-tropospheric site in terms of altitude and pressure, its very dry climate resulted in water vapor amounts (as indicated by the integrated water vapor (IWV) histograms in Fig. 8) that are significantly drier than those found at other ARM sites. Thus, downwelling radiance closure studies at the other sites would prove difficult because lower-tropospheric wa-ter vapor is much higher, meaning the downwelling radiance would have little sensitivity to change in upper-tropospheric humidity. The one-sided Studentttest results further suggest little variation between the correction algorithms despite the fact they correct differently in the upper troposphere.
mea-sured at the ARM’s NSA (Barrow) site (Fig. 8 – blue line), whereas during the warm season at the ARM SGP site the upper-tropospheric IWV is representative of a tropical loca-tion (e.g., the ARM’s TWP sites; see Fig. 8 – orange line). For this reason, radiosonde data from the SGP site are cho-sen for the upwelling radiance closure exercise.
We used the infrared radiance observations made by the Atmospheric Infrared Sounder (AIRS; Aumann and Pagano, 1994). Launched into a sun-synchronous polar or-bit on 4 May 2002 aboard NASA’s Aqua satellite (Parkin-son, 2003), this instrument has provided extensive insight into a host of weather and climate-related phenomena (e.g., Chahine et al., 2006; Shu and Wu, 2009; Shimada and Mi-nobe, 2011). The high spectral resolution of the AIRS, with 2378 channels, provides a wealth of information for our study. Its data have been extensively compared with data from infrared spectrometers flown on aircraft (e.g., Tobin et al., 2006), demonstrating excellent calibration accuracy and stability. One caveat to using the AIRS, like any sun-synchronous polar-orbiting satellite, is the temporal resolu-tion of the data: although approximately 12.5 years of AIRS data are available, surface locations near the poles will have more measurements than surface locations in the midlati-tudes or near the equator. The ARM SGP site launches ra-diosondes around 18:00 UTC every day, which is about 2 to 3 h before the AIRS overpass time (i.e., around 20:00 to 21:00 UTC). For this experiment, AIRSTB and radiosonde
data from a 5-year period from January 2005 through De-cember 2009 were used.
Upwelling infrared radiation is highly sensitive to changes in water vapor, so we needed to ascertain if the PWV changed appreciably between the sonde launch and AIRS overpass. Clouds must also be filtered from the data set, because mea-sured upwelling radiation is very sensitive to changes in cloud properties. The development or advection of clouds at the time of the radiosonde launch or AIRS overpass can obscure the atmosphere below the cloud-top height. To min-imize these impacts, we included data only:
1. where the AIRS overpass occurred within 135 min of the radiosonde launch
2. during cloud-free scenes, as discerned by the AIRS and radiosonde observations (methodology explained in the following paragraphs)
3. when the MWR PWV did not change by more than 5 % between the time of the radiosonde launch and AIRS overpass.
In short, only data during completely cloud-free conditions are examined. This is especially necessary because both the WANG and MILO correction algorithms are intended for use mainly in clear-sky conditions.
The 5 % threshold was determined through a sensitivity study: for two standard atmospheres (summer and winter),
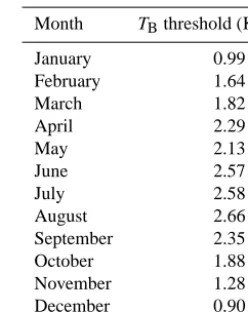
Table 3. A summary of the monthly brightness temperature
thresh-olds used to screen cloudy-sky scenes from the AIRS data.
Month TBthreshold (K)
January 0.99 K
February 1.64 K
March 1.82 K
April 2.29 K
May 2.13 K
June 2.57 K
July 2.58 K
August 2.66 K
September 2.35 K
October 1.88 K
November 1.28 K
December 0.90 K
we perturbed the column water vapor across a range of values for a fixed temperature profile typical for that season (results not shown here) and used the LBLRTM (Clough et al., 2005; see next paragraph for description) to evaluate changes in the peaks of the weighting function height computed for each of 467 total frequencies (subset from the 2378 AIRS channels) from each profile. The vertical resolution of the model for altitudes lower than 16 km was set to 100 m. For a change in PWV of 5 %, approximately 16 % (summer) and 14 % (win-ter) of the weighting function peak heights changed by more than 100 m. It should also be noted that 11 % of the total peaks (for each season) changed by less than 200 m (mean-ing than 5 % (3 %) of the summer (winter) weight(mean-ing func-tion peak heights changed by 200 m or more). Considering we use 1 km altitude bins in the main analysis, and the verti-cal resolution of the model is an order of magnitude smaller than this bin size, we feel this threshold is more than reason-able.
Additional screenings were implemented to account for the effects of cloud cover during this time threshold. The AIRS provides radiance measurements in a “footprint”, which is a 3×3 set of pixels. Data were chosen such that the center pixel was the measurement closest to the SGP site. At 938 cm−1the atmosphere is transparent to nearly all gases except for water vapor, thereby making this channel very sen-sitive to surface temperature in clear conditions. The standard deviation of theTBvalues obtained from the 938 cm−1
chan-nel radiances (TB,938 hereafter) was computed for all nine
pixels and thresholds were determined based on all avail-able footprints (Tavail-able 3). To account for seasonal variability in theTB,938measurements, thresholds are determined on a
monthly basis:TB,938measurements in all pixels (for a
clear-sky scene) result in a small standard deviation (generally less than 2 K).
ap-proximately 1 %, which is about 0.5 at 300 K for 938 cm−1. Tobin et al. (2006) later demonstrated that the root mean square error of brightness temperature and water vapor mea-surements over the ocean approached the theoretical expec-tations of clear-sky conditions. Even in clear-sky data, some variability inTB,938 measurements occurs as a result of
lo-cal differences in surface temperature across the swath of the footprint. To account for these deviations in surface tempera-ture while keeping the error to within∼6 % or∼3 K, we de-fined a clear-sky threshold equal to twice the 25th percentile of theTB,938standard deviation for that month (Table 3). The
factor of 2 ensures that enough cases make it into the anal-ysis while staying under 3 K for any season, which accounts for the prescribed natural variability inTB,938. HighTB
stan-dard deviations are primarily a signature of partly or mostly cloudy skies, since cloud tops are almost always colder than the surface.
Stratiform cloud decks are also accounted for: lowTB,938
standard deviations but lower than averageTB,938values
(rel-ative to the mean for that month) signify a cloud deck and therefore are also screened from the data. Subvisible cirrus clouds, which affect the radiance budget but are too opti-cally thin to be easily identified in the AIRS observations, were identified using the radiosonde RH data. Any original RH profile that has an RHICEmeasurement greater than 90 %
anywhere in the column is removed. Using all of the above criteria to account for cloud coverage and environmental ho-mogeneity, 96 cases pass these screenings.
The line-by-line radiative transfer model LBLRTM (Al-varado et al., 2013; Clough et al., 2005; Turner et al., 2004), which shares the physical basis as the MonoRTM used in the downwelling experiment, is used to compute upwelling infrared radiance from the original and corrected RH data. The LBLRTM computes very high-resolution radiance data; in order to match the 2378 AIRS channels, the monochro-matic LBLRTM output is convolved with the AIRS instru-ment spectral response function for each of the 2378 AIRS channels. The atmosphere is generally opaque in the spec-tral region between approximately 1300 and 2000 cm−1 at the SGP site due to absorption by water vapor. Our analysis focused on the radiative closure in this spectral region, us-ing only AIRS channels where the transmission of the atmo-sphere was 0. By restricting our analysis to this set of chan-nels, uncertainties associated with the emission of the earth’s surface were avoided.
For each radiosonde/AIRS overpass pair, the upwellingTB
was computed using the LBLRTM along the viewing angle of the AIRS instrument, and the observed minus computed
TB differences were assigned to different altitudes. We
at-tributed theTB(λ)difference to the altitude where the
weight-ing function for that wavelength (λ)had its maximum value. The weighting functions as a function of heightW (z)were computed as
W (z)=β (z) e−τ (z), (5)
whereβ(z)is the gaseous absorption coefficient andτ (z)is the cumulative optical depth from the AIRS sensor to height
zcomputed as
τ (z)=
∞
Z
z
β z0dz0, (6)
and the wavelength dependence is inferred. In the 1300– 2000 cm−1 spectral region, water vapor is the primary gaseous absorber. Weighting functions “peak” at various heights depending on the respective channel’s sensitivity to water vapor and the shape of the water vapor profile. For mid-latitude atmospheres, weighting functions for the different spectral channels generally peak between 5 and 12 km de-pending on the water vapor profile (which determines the op-tical depth profile) and the temperature profile. AIRS chan-nels where the weighting function peaks above 2 km and be-low the tropopause are considered valid for this study. If a peak fell within a 1 km altitude range (e.g., 5–6, 6–7 km), the observed minus computedTB residual for that channel
was binned in this height range. Similar to the downwelling experiment, mean residuals are computed according to the 30 % moistest and 30 % driest cases, which corresponded to IWV thresholds (for all radiosondes having valid measure-ments between 525 and 200 hPa) of above 0.96 mm and be-low 0.37 mm, respectively.
Median brightness temperature biases between the AIRS and un/corrected RH data (Fig. 9) reveal an average cor-rection for any given layer of approximately 0.2 to 0.4 K, depending on the correction. Below 5 km,TB computations
using WANG-corrected RH are less biased thanTB
compu-tations using MILO-corrected RH (a result consistent with Fig. 2). Above 5 km, MILO-corrected RH results in model-computed TB that is less biased than WANG, but both
WANG- and MILO-corrected RHs result in TB
computa-tions that are statistically significant fromTBmodel
compu-tations using original RH as input (for all altitude levels). When comparing WANG- and MILO-corrected TB
resid-uals against one another, the corrections become statisti-cally significant (atp=0.05) from one another above the 5–6 km height bin. Also, MILO-correctedTB residuals are
less biased than WANG-correctedTBresiduals except at the
12–13 km height bin. We reasonably conclude that MILO-corrected RH for all cases performs better than WANG-corrected RH; however, we feel it is necessary to partition the cases by upper-tropospheric IWV in order to further deduce differences between the WANG and MILO RH correction al-gorithms.
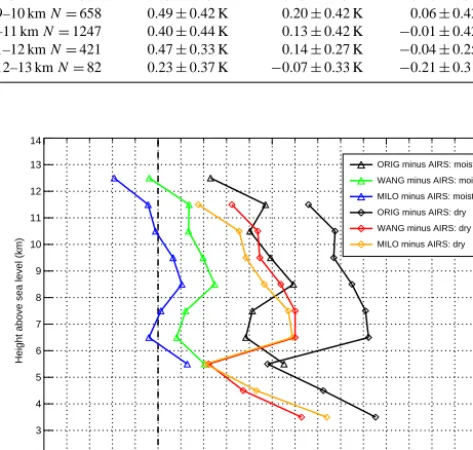
Table 4. A summary of the brightness temperature biases between the AIRS and the LBLRTM derived data over the SGP site using
un/corrected RH data as input as a function of height, where the height for each spectral residual was determined as the height where the weighting function for that profile peaks. The driest 30 % and moistest 30 % of the data correspond to upper-tropospheric IWV thresholds of less than 0.37 mm and greater than 0.96 mm, respectively.
Dry 30 % ORIG Dry 30 % WANG Dry 30 % MILO Moist 30 % ORIG Moist 30 % WANG Moist 30 % MILO
3–4 kmN=334 0.94±0.95 K 0.63±0.88 K 0.74±0.86 K 3–4 kmN=0 4–5 kmN=767 0.72±0.84 K 0.37±0.76 K 0.43±0.76 K 4–5 kmN=0
5–6 kmN=1076 0.48±0.69 K 0.22±0.66 K 0.21±0.66 K 5–6 kmN=558 0.55±1.34 K 0.20±1.26 K 0.13±1.23 K 6–7 kmN=681 0.92±0.45 K 0.60±0.42 K 0.59±0.41 K 6–7 kmN=2061 0.38±0.78 K 0.08±0.77 K 0.04±0.77 K 7–8 kmN=952 0.91±0.75 K 0.60±0.69 K 0.57±0.70 K 7–8 kmN=1277 0.41±0.70 K 0.12±0.71 K 0.01±0.72 K 8–9 kmN=498 0.85±0.61 K 0.54±0.54 K 0.46±0.51 K 8–9 kmN=1307 0.59±0.49 K 0.25±0.49 K 0.10±0.52 K 9–10 kmN=532 0.77±0.51 K 0.45±0.41 K 0.38±0.41 K 9–10 kmN=658 0.49±0.42 K 0.20±0.42 K 0.06±0.43 K 10–11 kmN=255 0.78±0.43 K 0.44±0.37 K 0.36±0.37 K 10–11 kmN=1247 0.40±0.44 K 0.13±0.42 K −0.01±0.42 K 11–12 kmN=191 0.66±0.62 K 0.32±0.55 K 0.18±0.49 K 11–12 kmN=421 0.47±0.33 K 0.14±0.27 K −0.04±0.25 K 12–13 kmN=0 12–13 kmN=82 0.23±0.37 K −0.07±0.33 K −0.21±0.31 K
-0.5 0.0 0.5 1.0 1.5 2.0
Brightness temperature bias (K) 2
3 4 5 6 7 8 9 10 11 12 13 14
Averaging bin height ASL (km)
ORIG minus AIRS
WANG minus AIRS
MILO minus AIRS
Figure 9. The median LBLRTM minus AIRS brightness
tempera-ture difference (residual) as a function of height (for all data), where the residual in a spectral channel was assigned to a particular height (in 1 km intervals) based upon where the weighting function for that channel peaked with altitude (using the original RH profile). Error bars represent the 25th/75th percentile of brightness tempera-ture residuals.
Aside from the 12–13 km layer for WANG and the 6–7, 10– 13 km height bins for MILO, the correction algorithms re-main slightly dry biased. This result is consistent with the findings in Fig. 2: since MILO generally adds more WV in the middle and upper troposphere, it follows that MILO cor-rects more than WANG in these driest cases (though no more than about 0.2 K) and appears to be better. The moist cases, however, result inTBresiduals closer to the observed AIRS TB, with MILO-correctedTBresiduals being less biased than
WANG-correctedTBresiduals at every height bin except the
12–13 km height bin. Again, these results are consistent with Fig. 2: MILO corrects more than WANG (as much as 0.10 to 0.15 K more), which is only possible in the presence of in-creased WV in the middle and upper troposphere. It should be noted that many more observations (i.e., usable channels resulting from the weighting function analysis) are
avail--0.5 0.0 0.5 1.0 1.5
Brightness temperature bias (K) 2
3 4 5 6 7 8 9 10 11 12 13 14
Height above sea level (km)
ORIG minus AIRS: moist
WANG minus AIRS: moist
MILO minus AIRS: moist
ORIG minus AIRS: dry
WANG minus AIRS: dry
MILO minus AIRS: dry
Figure 10. Same as in Fig. 9, but where the residuals are for the
moistest 30 % and driest 30 % of the water vapor profiles. The me-dian values shown in this plot, along with the standard deviations, are given in greater detail in Table 4.
able for the moist case category (especially above the 5– 6 km height bin). In the drier profiles, the opacity of the at-mosphere due to water vapor absorption decreases and thus more AIRS channels are eliminated from the analysis be-cause the channel is sensitive to surface emission, thereby making fewer measurements available. The number of mea-surements (i.e., number of brightness temperature measure-ments between 1300 and 2000 cm−1 from the partitioned cases) per height bin for the driest 30 % and moistest 30 % of data is also given in Table 4.
For both WANG and MILO, Table 4 shows that both cor-rections have a slightly decreased standard deviations com-pared to the original measurements at nearly every height bin. MILO, in most cases, has a slightly lower standard devi-ations compared to WANG.
We also computed statistical significance among the TB
residuals for original, WANG- and MILO-correctedTBdata
WANG- and MILO-correctedTB are significantly different
from the TB derived from the original RH data for all
alti-tudes. When coupled with the fact thatTBresiduals among
the correction algorithms are much less biased compared to
TBresiduals using original RH data, we can conclude that
WANG- or MILO-corrected RH is much improved over the original RH measurements. For the driest 30 % of cases, the WANG and MILO corrections are statistically signifi-cant from each other (at the p=0.05 level) at and above the 9–10 km bin. For the moistest 30 % of cases, WANG- and MILO-correctedTBbecome statistically significant from one
another at and above the 7–8 km bin. In both cases, MILO is less biased than WANG above the stated altitude bins (except the 12–13 km bin); therefore we can also conclude that MILO-corrected RH is better representative of upper-tropospheric RH compared to WANG-corrected RH.
For both the upwelling and downwelling experiments, the dry thresholds are the same (0.37 mm), however, the TB
residuals computed for the upwelling experiment from each correction algorithm reduced the bias, which was not the case for the driest 30 % of results from the downwelling experi-ment. At this time, we cannot conclude why results for the re-spective subsets of data differ. The moist threshold is higher for the upwelling experiment compared to the downwelling experiment (0.96 vs. 0.57 mm) – likely because water vapor can more easily reach the upper troposphere due to phenom-ena such as deep convection at the SGP, while at CJC there are a range of processes at work keeping the troposphere rel-atively dry (Rutllant Costa, 1977). Figures 7 and 8 corrob-orate this idea as well considering the CJC observes lower RH and IWV, respectively, compared to the SGP site. With the exception of the 12–13 km bin, TB residuals (Fig. 10)
computed from MILO-corrected RH are less biased thanTB
residuals computed from WANG-corrected RH but remain slightly dry biased. Despite the limitations present in the up-welling experiment, but given the statistical significance be-tween MILO- and WANG-corrected RH, the results from this experiment suggest that MILO-corrected RH is better repre-sentative of clear-sky RH compared to WANG-corrected RH in the upper troposphere, and both corrections represent im-provements compared to uncorrected sondes.
5 Conclusion
Both the WANG and MILO corrections significantly improve the original Vaisala RS92 RH data, as demonstrated in an analysis of PWV at multiple sites, yielding approximately the same improvement in PWV relative to the MWR-retrieved value. However, the two algorithms differ in their corrections as a function of height due to their different methodologies.
Given this difference, radiative closure experiments were performed to determine whether one of the two corrections was better than the other. Comparing radiative transfer calcu-lations that use the WANG- and MILO-corrected
radioson-des, an analysis of downwelling measurements at the 183.00 and 183.31 GHz channels of the CJC GVRP indicated that the WANG medianTBcalculation was not statistically
dif-ferent compared to the MILO median TB calculation for
the moist cases that are more typical of upper troposphere in midlatitude atmospheres. Also, both corrections signifi-cantly improved theTBbias for the moist cases: the original
medianTBcalculation was∼10 K too warm (implying the
original sonde was too dry) at 183.00 and 183.31 K. How-ever, radiosondes in the very dry category, corresponding to upper-tropospheric conditions not typically found in midlat-itude or tropical locations, were made significantly too moist by both corrections, yielding much poorer agreement with the GVRP than the original uncorrected radiosonde profile. We find WANG- and MILO-corrected RH to be statistically better than the original RH for the moist cases; however, WANG- and MILO-corrected RHs are not statistically dif-ferent when tested against one another.
The upwelling experiment using AIRS measurements re-vealed additional differences between WANG and MILO, likely owing to the fact the SGP site has a great seasonal de-pendence on upper-tropospheric IWV. The driest cases show that WANG is slightly less biased than MILO below 5 km, which is likely due to the fact that WANG corrects more than MILO in the lower troposphere. Otherwise, MILO is less biased than WANG in nearly every other scenario, as indi-cated by the partitioning of radiances by height using weight-ing functions. Both the WANG and MILO corrections result inTBcomputations that are statistically significant fromTB
computations derived from original RH – a result consis-tent with the results found in the downwelling experiment. We find, however, that MILO is statistically different from WANG above 8 km in the moistest 30 % of cases and above 10 km in the driest 30 % of cases. We conclude that MILO of-fers a more realistic representation of upper-tropospheric RH compared to WANG because of the lowerTBbias at nearly
all altitudes coupled with the statistical significance between MILO and WANG.
func-tion of altitude and water phase. If this adjustment could be made, the WANG correction would become more robust and would be applicable to an increased number of applications. Regardless, our results demonstrate the utility of both cor-rection algorithms across a wide range of climatic regimes, where MILO is especially effective in the upper troposphere for clear-sky conditions.
Acknowledgements. The radiosonde, MWR, and GVRP data were
obtained from the Atmospheric Radiation Measurement (ARM) Program sponsored by the US Department of Energy, Office of Science, Office of Biological and Environmental Research, Climate and Environmental Sciences Division. We would also like to thank the Dave Tobin for providing the AIRS footprint data needed to perform the upwelling experiment. Comments from Larry Miloshevich, Isaac Moradi, and one anonymous reviewer helped to improve the clarity of this manuscript. This work was supported by the US Department of Energy’s Atmospheric System Research (ASR) program with grant DE-SC0008830.
Edited by: I. Moradi
References
Ackerman, T. P. and Stokes, G. M.: The atmospheric radiation mea-surement program, Phys. Today, 56, 38–44, 2003.
Alvarado, M. J., Payne, V. H., Mlawer, E. J., Uymin, G., Shephard, M. W., Cady-Pereira, K. E., Delamere, J. S., and Moncet, J.-L.: Performance of the Line-By-Line Radiative Transfer Model (LBLRTM) for temperature, water vapor, and trace gas retrievals: recent updates evaluated with IASI case studies, Atmos. Chem. Phys., 13, 6687–6711, doi:10.5194/acp-13-6687-2013, 2013. Aumann, H. H. and Pagano, R. J.: Atmospheric infrared sounder on
the Earth Observing System, Opt. Eng., 33, 776–784, 1994. Cadeddu, M. P.: G-Band Vapor Radiometer Profiler (GVRP)
Hand-book, DOE Office of Science Atmospheric Radiation Measure-ment (ARM) Program, United States, No. DOE/SC-ARM/TR-091, Pacific Northwest National Laboratory (PNNL), Richland, WA, USA, 2010.
Cadeddu, M. P., Liljegren, J. C., and Turner, D. D.: The Atmo-spheric radiation measurement (ARM) program network of mi-crowave radiometers: instrumentation, data, and retrievals, At-mos. Meas. Tech., 6, 2359–2372, doi:10.5194/amt-6-2359-2013, 2013.
Cady-Pereira, K. E., Shephard, M. W., Turner, D. D., Mlawer, E. J., Clough, S. A., and Wagner, T. J.: Improved daytime column-integrated precipitable water vapor from vaisala radiosonde hu-midity sensors, J. Atmos. Ocean. Tech., 25, 873–883, 2008. Chahine, M. T., Pagano, T. S., Aumann, H. H., Atlas, R., Barnet,
C., Blaisdell, J., Chen, L., Divakarla, M., Fetzer, E. J., Goldberg, M., Gautier, C., Granger, S., Hannon, S., Irion, F. W., Kakar, R., Kalnay, E., Lambrigtsen, B. H., Lee, S., Le Marshall, J., McMillian, W. W., McMillin, L., Olsen, E. T., Revercomb, H., Rosenkranz, P., Smith, W. L., Staelin, D., Strow, L. L., Susskind, J., Tobin, D., Wolf, W., and Zhou, L.: AIRS: improving weather forecasting and providing new data on greenhouse gases, B. Am. Meteorol. Soc., 87, 911–926, 2006.
Cimini, D., Nasir, F., Westwater, E. R., Payne, V. H., Turner, D. D., Mlawer, E. J., Exner, M. L., and Cadeddu, M. P.: Comparison of ground-based millimeter-wave observations and simulations in the Arctic winter, IEEE T. Geosci. Remote, 47, 3098–3106, doi:10.1109/TGRS.2009.2020743, 2009.
Clough, S. A., Shephard, M. W., Mlawer, E. J., Delamere, J. S., Iacono, M. J., Cady-Pereira, K., Boukabara, S., and Brown, P. D.: Atmospheric radiative transfer modeling: a summary of the AER codes, J. Quant. Spectrosc. Ra., 91, 233–244, 2005. Dirksen, R. J., Sommer, M., Immler, F. J., Hurst, D. F., Kivi, R., and
Vömel, H.: Reference quality upper-air measurements: GRUAN data processing for the Vaisala RS92 radiosonde, Atmos. Meas. Tech., 7, 4463–4490, doi:10.5194/amt-7-4463-2014, 2014. Ferrare, R. A., Melfi, S. H., Whiteman, D. N., Evans, K. D.,
Schmidlin, F. J., and Starr, D. O’C.: A comparison of water vapor measurements made by Raman Lidar and radiosondes, J. Atmos. Ocean. Tech., 12, 1177–1195, 1995.
Ferrare, R. A., Browell, E. V., Ismail, S., Kooi, S. A., Brasseur, L. H., Brackett, V. G., Clayton, M. B., Barrick, J. D. W., Diskin, G. S., Goldsmith, J. E. M., Lesht, B. M., Podolske, J. R., Sachse, G. W., Schmidlin, F. J., Turner, D. D., Whiteman, D. N., Tobin, D., Miloshevich, L. M., Revercomb, H. E., Demoz, B. B., and Di Girolamo, P.: Characterization of upper-troposphere water vapor measurements during AFWEX using LASE, J. Atmos. Ocean. Tech., 21, 1790–1808, 2004.
Ferrare, R. A. Turner, D., Clayton, M., Schmid, B., Redemann, J., Covert, D., Elleman, R., Ogren, J., Andrews, E., Goldsmith, J. E. M., and Jonsson, H.: Evaluation of daytime measurements of aerosols and water vapor made by an operational Raman lidar over the Southern Great Plains, J. Geophys. Res., 111, D05S08, doi:10.1029/2005JD005836, 2006.
Goldsmith, J. E. M., Blair, F. H., Bisson, S. E., and Turner, D. D.: Turn-key Raman Lidar for profiling atmospheric water vapor, clouds, and aerosols, Appl. Optics, 37, 4979–4990, 1998. Guichard, F., Parsons, D., and Miller, E.: Thermodynamic and
ra-diative impact of the correction of sounding humidity bias in the tropics, J. Climate, 13, 3611–3624, 2000.
Hagan, D. E. and Minnett, P. J.: AIRS radiance validation over ocean from sea surface temperature measurements, IEEE T. Geosci. Remote, 41, 432–441, 2003.
Hartmann, D. L., Holton, J. R., and Fu, Q.: The heat balance of the tropical tropopause, cirrus, and stratospheric dehydration, Geo-phys. Res. Lett., 28, 1969–1972, doi:10.1029/2000GL012833, 2001.
Jensen, E. J., Toon, O. B., Pfister, L., and Selkirk, H. B.: Dehy-dration of the upper troposphere and lower stratosphere by sub-visible cirrus clouds near the tropical tropopause, Geophys. Res. Lett., 23, 825–828, 1996a.
Jensen, E. J., Toon, O. B., Selkirk, H. B., Spinhirne, J. D., and Schoeberl, M. R.: On the formation and persistence of subvis-ible cirrus clouds near the tropical tropopause, J. Geophys. Res., 101, 21361–21375, 1996b.
Kottayil, A., Buehler, S. A., John, V. O., Miloshevich, L. M., Milz, M., and Holl, G.: On the importance of Vaisala RS92 ra-diosonde humidity corrections for a better agreement between measured and modeled satellite radiances, J. Atmos. Ocean. Tech., 29, 248–259, 2012.
de Reus, M., and Spichtinger, P.: Ice supersaturations and cir-rus cloud crystal numbers, Atmos. Chem. Phys., 9, 3505–3522, doi:10.5194/acp-9-3505-2009, 2009.
Liou, K. N.: Influence of cirrus clouds on weather and climate processes: a global perspective, Mon. Weather Rev., 114, 1167–1200, doi:10.1175/1520-0493(1986)114<1167:IOCCOW>2.0.CO;2, 1986.
Marín, J. C., Pozo, D., Mlawer, E., Turner, D. D., and Curé, M.: Dynamics of local circulations in mountainous terrain during the RHUBC-II project, Mon. Weather Rev., 141, 3641–3656, 2013. Mather, J. H. and Voyles, J. W.: The ARM Climate Research
facil-ity: a review of structure and capabilities, B. Am. Meteorol. Soc., 94, 377–392, 2013.
Mattioli, V., Westwater, E. R., Cimini, D., Gasiewski, A. J., Klein, M., and Leuski, V. Y.: Microwave and millimeter-wave radiometric and radiosonde observations in an Arc-tic environment, J. Atmos. Ocean. Tech., 25, 1768–1777, doi:10.1175/2008JTECHA1078.1, 2008.
Miloshevich, L. M., Vömel, H., Whiteman, D. N., and Leblanc, T.: Accuracy assessment and correction of Vaisala RS92 radiosonde water vapor measurements, J. Geophys. Res.-Atmos, 114, D11305, doi:10.1029/2008JD011565, 2009.
Moradi, I., Soden, B., Ferraro, R., Arkin, P., and Vömel, H.: As-sessing the quality of humidity measurements from global oper-ational radiosonde sensors, J. Geophys. Res.-Atmos., 118, 8040– 8053 doi:10.1002/jgrd.50589, 2013a.
Moradi, I., Buehler, S. A., John, V. O., Reale, A., and Ferraro, R. R.: Evaluating instrumental inhomogeneities in global radiosonde upper tropospheric humidity data using microwave satellite data, IEEE Geosci. Remote S., 51, 3615–3624, 2013b.
Parkinson, C. L.: Aqua: an earth-observing satellite mission to ex-amine water and other climate variables, IEEE T. Geosci. Remote S., 41, 173–183, doi:10.1109/TGRS.2002.808319, 2003. Payne, V. H., Delamere, J. S., Cady-Pereira, K. E., Gamache,
R. R., Moncet, J.-L., Mlawer, E. J., and Clough, S. A.: Air-broadened half widths of the 22- and 183-GHz water vapor lines, IEEE T. Geosci. Remote S., 46, 3601–3617, doi:10.1109/TGRS.2008.2002435, 2008.
Payne, V. H., Mlawer, E. J., Cady-Pereira, K. E., and Mon-cet, J.-L.: Water vapor continuum absorption in the mi-crowave, IEEE T. Geosci. Remote S., 49, 2194–2208, doi:10.1109/TGRS.2010.2091416, 2011.
Revercomb, H. E., Turner, D. D., Tobin, D. C., Knuteson, R. O., Feltz, W. F., Barnard, J., Bösenberg, J., Clough, S., Cook, D., Fer-rare, R., Goldsmith, J., Gutman, S., Halthore, R., Lesht, B., Lilje-gren, J., Linné, H., Michalsky, J., Morris, V., Porch, W., Richard-son, S., Schmid, B., Splitt, M., Van Hove, T., Westwater, E., and Whiteman, D.: The ARM program’s water vapor intensive ob-servation periods: overview, initial accomplishments, and future challenges, B. Am. Meteorol. Soc., 84.2, 217–236, 2003. Rutllant Costa, J.: On the extreme aridity of costal and Atacama
deserts in northern Chile, PhD thesis, University of Wisconsin, Madison, 175 pp., 1977.
Seidel, D., Turner, D. D., Tobin, D. C., Knuteson, R. O., Feltz, W. F., Barnard, J., Bösenberg, J., Clough, S., Cook, D., Ferrare, R., Goldsmith, J., G utman, S., Halthore, R., Lesht, B., Lilje-gren, J., Linné, H., Michalsky, J., Morris, V., Porch, W., Richard-son, S., Schmid, B., Splitt, M., Van Hove, T., Westwater, E., and Whiteman, D.: Reference upper-air observations for climate:
ra-tionale, progress, and plans, B. Am. Meteorol. Soc., 90, 361–369, doi:10.1175/2008BAMS2540.1, 2009.
Shimada, T. and Minobe, S.: Global analysis of the pressure adjustment mechanism over sea surface temperature fronts using AIRS/Aqua data, Geophys. Res. Lett., 38, L06704, doi:10.1029/2010GL046625, 2011.
Shu, S. and L. Wu: Analysis of the influence of Saharan air layer on tropical cyclone intensity using AIRS/Aqua data, Geophys. Res. Lett., 36, L09809, doi:10.1029/2009GL037634, 2009.
Soden, B. J., Turner, D. D., Lesht, B. M., and Miloshevich, L. M.: An analysis of satellite, radiosonde, and lidar observations of upper tropospheric water vapor from the Atmospheric Radia-tion Measurement Program, J. Geophys. Res., 109, D04105, doi:10.1029/2003JD003828, 2004.
Starr, D. and Cox, S. K.: Cirrus clouds. Part II: Numerical experi-ments on the formation and maintenance of cirrus, J. Atmos. Sci., 42, 2682–2694, 1985.
Stokes, G. M. and Schwartz, S. E.: The atmospheric radiation mea-surement program: programmatic background and design of the cloud and radiation test bed, B. Am. Meteorol. Soc., 75, 1201– 1221, 1994.
Suortti, T. M., Kivi, R., Kats, A., Yushkov, V., Kämpfer, N., Leit-erer, U., and Vömel, H.: Tropospheric comparisons of Vaisala ra-diosondes and balloon-borne frost-point and Lyman-α hygrom-eters during the LAUTLOS-WAVVAP experiment, J. Atmos. Ocean. Tech., 25.2, 149–166, 2008.
Tobin, D. C., Revercomb, H. E., Knuteson, R. O., Best, F. A., Smith, W. L., Ciganovich, N. N., Dedecker, R. G., Dutcher, S., Ellington, S. D., Garcia, R. K., Howell, H. B., LaPorte, D. D., Mango, S. A., Pagano, T. S., Taylor, J. K., van Delst, P., Vinson, K. H., and Werner, M. W.: Radiometric and spectral validation of atmospheric infrared sounder observations with the aircraft-based scanning high-resolution interferometer sounder, J. Geo-phys. Res., 111, D09S02, doi:10.1029/2005JD006094, 2006. Turner, D. D. and Goldsmith, J. E. M.: Twenty-four-hour Raman
Lidar water vapor measurements during the Atmospheric Radia-tion Measurement program’s 1996 and 1997 water vapor inten-sive observation periods, J. Atmos. Ocean. Tech., 16, 1062–1076, 1999.
Turner, D. D. and Mlawer, E. J.: Radiative heating in underexplored bands campaign (RHUBC), B. Am. Meteorol. Soc., 91, 911–923, doi:10.1175/2010BAMS2904.1, 2010.
Turner, D. D., Lesht, B. M., Clough, S. A., Liljegren, J. C., Rever-comb, H. E., and Tobin, D. C.: Dry bias and variability in Vaisala RS80-H radiosondes: the ARM experience, J. Atmos. Ocean. Tech., 20, 117–132, 2003.
Turner, D. D., Tobin, D. C., Clough, S. A., Brown, P. D., Elling-son, R. G., Mlawer, E. J., KnuteElling-son, R. O., Revercomb, H. E., Shippert, T. R., Smith, W. L., and Shephard, M. W.: The QME AERI LBLRTM: a closure experiment for downwelling high spectral resolution infrared radiance, J. Atmos. Sci., 61, 2657– 2675, 2004.
Turner, D. D., Clough, S. A., Liljegren, J. C., Clothiaux, E. E., Cady-Pereira, K., and Gaustad, K. L.: Retrieving liquid water path and precipitable water vapor from the atmospheric radiation measurement (ARM) microwave radiometers, IEEE T. Geosci. Remote, 45, 3680–3690, 2007.
Morel, B., Ogino, S.-Y., Read, W. G., Ryan, S. C., Saraspriya, S., Selkirk, H., Shiotani, M., Valverde-Canossa, J., and White-man, D. N.: Validation of Aura Microwave Limb Sounder wa-ter vapor by balloon-borne Cryogenic Frost point Hygrom-eter measurements, J. Geophys. Res.-Atmos., 112, D24S37, doi:10.1029/2007JD008698, 2007a.
Vömel, H., Selkirk, H., Miloshevich, L., Valverde-Canossa, J., Valdés, J., Kyrö, E., Kivi, R., Stolz, W., Peng, G., and Diaz, J. A.: Radiation dry bias of the Vaisala RS92 humidity sensor, J. Atmos. Ocean. Tech., 24, 953–963, 2007b.
Wang, J. and Zhang, L.: Systematic errors in global ra-diosonde precipitable water vapor data from comparisons with ground-based GPS measurements, J. Climate, 21, 2218–2238, doi:10.1175/2007JCLI1944.1, 2008.
Wang, J., Zhang, L., Dai, A., Immler, F., Sommer, M., and Vömel, H.: Radiation dry bias correction of Vaisala RS92 humid-ity data and its impacts on historical radiosonde data, J. Atmos. Ocean. Tech., 30, 197–214, 2013.
Yoneyama, K., Fujita, M., Sato, N., Fujiwara, M., Inai, Y., and Hasebe, F.: Correction for radiation dry bias found in RS92 ra-diosonde data during the MISMO field experiment, SOLA, 4, 13–16, 2008.