DOI 10.1007/s10152-008-0109-8 O R I G I N A L A R T I C L E
Spatial variability of epifaunal communities in the North Sea
in relation to sampling e
V
ort
Hermann Neumann · Siegfried Ehrich · Ingrid Kröncke
Received: 30 July 2007 / Revised: 4 February 2008 / Accepted: 5 February 2008 / Published online: 29 February 2008
© Springer-Verlag and AWI 2008
Abstract Benthic epifauna was sampled in six areas from the German Bight towards the Norwegian Sea using a 2-m standard beam trawl. Nine replicates were taken in each area and year from 1999 to 2006. This data set (60–67 rep-licates per area) was used to describe the spatial variability in local species composition and to assess the eVect of increasing sampling eVort on species richness and commu-nity structure. Our results conWrmed the importance of the 50-m depth contour for the separation of benthic fauna in the North Sea. Low species richness, sparse sessile fauna and high abundances of scavenging species such as Aste-rias rubens, Liocarcinus holsatus, Astropecten irregularis
and Ophiura albida were characteristic of the low-water area south of the 50-m contour. DiVerences in community structure were less conspicuous in deeper waters north of the 50-m contour, but distribution patterns and abundances of single species such as Echinus elegans, Hyalinoecia tubicola, Ophiothrix fragilis, Scaphander lignarius as well as several hermit crabs resulted in well-deWned epifaunal communities. One replicate caught 17–28% of the species found in 60–67 samples and was suYcient to separate the community in the German Bight from those in the central and northern North Sea by using multidimensional scaling. Nine replicates sampled a proportion of 53–60% and
provided additional information on the spatial variability of community structure in the central and northern North Sea. Our study indicates that appropriate replication enhances the quality of the data and can partly overcome the con-straints of sampling with a 2-m beam trawl. This might be helpful for future monitoring programmes.
Keywords Epifauna · Community structure · Species accumulation curves · Multidimensional scaling (MDS) · North Sea
Introduction
Epifauna is a major food resource for Wshes (Braber and De Groot 1973; Klemetsen 1993; Bowman et al. 2000), birds and seals (Lydersen et al. 1989). First spatial investigations on epifauna communities in the North Sea were carried out by Dyer et al. (1982, 1983), resulting from the analysis of W sher-ies’ by-catch. Since then epifaunal communities in diVerent parts of the North Sea and the entire North Sea have been investigated and described by several authors (Basford et al. 1989; Frauenheim et al. 1989; Duineveld and van Noort 1990; Jennings et al. 1999; Rees et al. 1999; Zühlke et al. 2001a; Callaway et al. 2002). These investigations focused on the epifaunal large-scale distribution patterns and the environ-mental factors related to these patterns. The studies generally supported the results of Glèmarec (1973) who established three benthic regions in the North Sea separated by the 60- and 100-m depth contours. Several environmental factors such as depth, temperature, sediment composition and large-scale hydrodynamic phenomena were regarded to be respon-sible for the distribution patterns of the North Sea epifauna.
Most of the existing studies were based on large-scale surveys with large-scale sampling resolution and single Communicated by H.-D. Franke.
H. Neumann (&) · I. Kröncke
Department for Marine Research, Senckenberg Institute, Südstrand 40, 26382 Wilhelmshaven, Germany e-mail: [email protected]
S. Ehrich
replicates, leading to underestimations in abundance and biomass, especially as epifauna is sampled with a 2-m beam-trawl or dredges (Kaiser et al. 1994; Reiss et al. 2006). Thus, a small-scale sampling design with higher numbers of repli-cates in a smaller area is necessary to study benthic processes as well as anthropogenic eVects on the benthic communities such as pollution, Wsheries’ impact or climate change. The German Small-scale Bottom Trawl Survey (GSBTS) was initiated in 1987 to provide high resolved process-oriented information to large-scale Wshery surveys like the “Interna-tional Bottom Trawl Survey (IBTS)”. The GSBTS was sup-plemented by hydrographical measures and nutrient analysis and since 1998 was accompanied by benthic studies. Sam-pling took place each summer in areas of 10£10 nautical miles, the so-called Boxes, which were regularly distributed over the entire North Sea (Ehrich et al. 2007, for further information). Nine replicates were taken in each Box and year for benthic investigations so that up to now a total of 60–67 samples were available for each of the Boxes.
The speciWc objectives of this study were (a) to describe the spatial variability in species composition of the epifau-nal communities in six areas (Boxes) of the North Sea, and (b) to assess the eVect of increasing numbers of replicates on the number of species (species richness) and the com-munity structures.
Material and methods
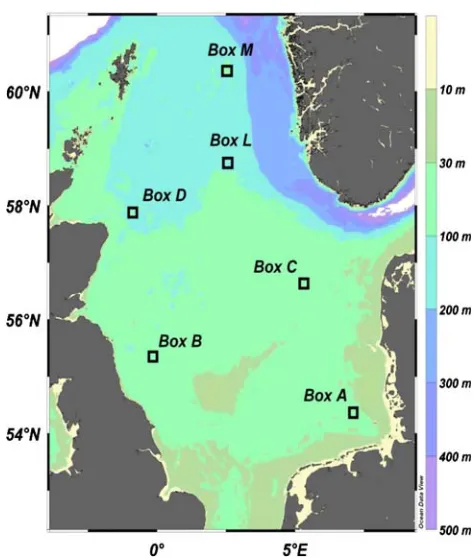
Epifauna sampling took place in the six Boxes A, B, C, D, L and M (each 10£10 nm) of the “German Small-Scale Bottom Trawl Survey (GSBTS)” (Ehrich et al. 2007) every July and August, in years 1999–2006 with FRV Walter Herwig III (Fig.1).
Beam trawl sampling
Epifauna was sampled with a standardized 2 m beam trawl made of galvanized steel with a chain matt attached. The beam trawl was Wtted with a 20-mm net and a cod end of 4 mm mesh size. A Scanmar depth Wnding sonar was attached to the top of the net just behind the steel beam to determine the exact time and position of contact with the seabed. From the moment of contact the beam was towed with a speed of about 1.5–2 knots for 5 min. In total, 384 hauls (60–67 replicates per Box) were run from 1999 to 2006. If possible, nine replicates were taken in each Box and year.
Sample treatment
Samples were sieved over 5 mm mesh size and epibenthic fauna was separated from the remains. The majority of
species were identiWed on board. UnidentiWed species were preserved in a 4% seawater formalin solution for later iden-tiWcation in the laboratory. Abundance and wet weight of the free-living epifauna was determined using a motion-compensated marine scale (Pols) with an accuracy of 1 g. Modular epifauna were recorded as present or absent and, if possible, weighed. All animals were identiWed on the lowest possible taxonomic level.
Data analysis
Epifauna catches were standardised to a tow length of 250 m (area sampled = 500 m²). Species were separated into free-living and sessile epifauna. Species numbers were analysed as total number of species (species richness) recorded in the Boxes during the study period. Smoothed species accumulation curves were calculated to assess the maximum species number per Box and the eVects of a higher number of replicates on the species richness. Non-metric multidimensional scaling (MDS) in the PRIMER v6 package (Plymouth Marine Laboratory) was used based on presence/absence and fourth root transformed abundance data. MDS ordination plots were calculated for both trans-formations using one and nine (+mean) replicates per Box in 1999, 2003 and 2006, and additionally all taken repli-cates per Box (+mean) to investigate the eVects of a higher sampling eVort on the MDS ordination. Data similarities
Fig. 1 Location and depth of the study areas in the North Sea (Boxes
between the Boxes were calculated using the Bray–Curtis coeYcient. ANOSIM randomisation tests were performed to test the diVerences in the community composition of the Boxes (H0= no diVerences in community composition). Species which were predominantly responsible for the sim-ilarity within clusters were determined with the PRIMER program SIMPER.
Results
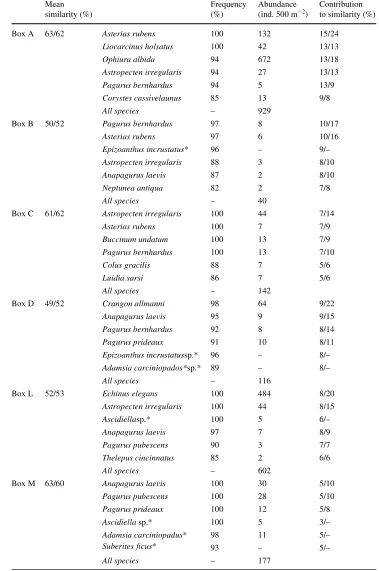
A total of 275 species were recorded in 384 samples; 166 were classiWed as free-living and 109 as sessile species. Table1 gives the frequency of occurrence and the mean abundance per 500 m² of the dominant species in each Box.
Species numbers and taxonomic groups
Generally, the total number of species was highest in the northern Box L with 120 taxa, but was also high in the Boxes B, D and M (114, 116 and 115 Taxa). The lowest number of species occurred in Box A with 53 taxa (Fig.2). Thus, the total species number in the deeper Boxes (depth between 73 m in Box B and 110 m in Box L) was about twice as high as in the shallow Box A (depth 40 m). Species number of sessile and free-living fauna, respectively, coin-cided with the pattern of total species numbers (Fig.2). For both groups, lowest values were found in the Boxes A and C. However, the highest number of free-living species was recorded in Boxes L and M oV the Norwegian coast (81 and 79 taxa), while highest numbers of sessile species were recorded in Boxes B and D oV the British coast (46 and 49 taxa). Most of the sessile fauna belonged to the Hydrozoa and Bryozoa. A high species number of Bryozoa (17 taxa) was found in Box B and of Hydrozoa in Box D (17 taxa) (Fig.3). In each Box species number of free-living fauna was dominated by Crustacea and Echinoderma (Fig.4). In Boxes A and L, the species numbers of the Gastropoda (8 and 18 species, respectively) were somewhat higher than those of the Echinodermata (6 and 17 species, respec-tively).
Spatial distribution of species
Generally, sea stars (Asterias rubens; Astropecten irregu-laris) and hermit crabs (Pagurus bernhardus; P. pubescens;
P. prideaux; Anapagurus laevis) were the dominant species in the Boxes (Table1). However, mean abundance of these species was highly variable. The brittle star Ophiura albida
(Box A) and the sea urchin Echinus elegans (Box L) were common species and occurred in extremely high abun-dances in Boxes A and L, respectively. The only common
sessile species were the anthozoans Epizoanthus incrusta-tus (Boxes B and D) and Adamsia carcinopadus, the sponge Suberites Wcus (Box M) as well as the sea squirt
Ascidiella sp. (Boxes L and M). Epizoanthus incrustatus
and Adamsia carcinopadus were always associated with hermit crabs and could thus regarded as “free-living” spe-cies.
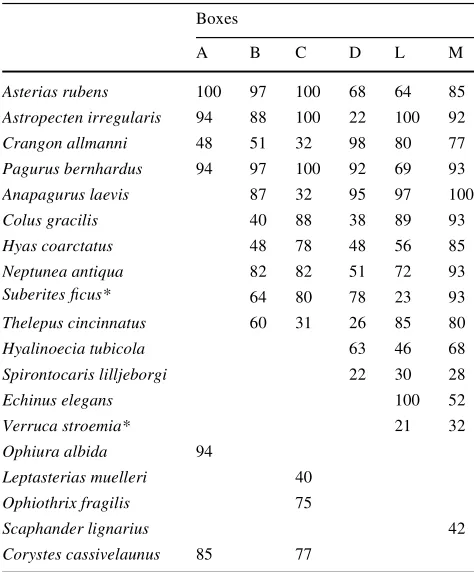
Asterias rubens, Astropecten irregularis, Pagurus bern-hardus as well as the shrimp Crangon allmanni were com-mon species in all Boxes (Table2). Many species such as the great spider crab Hyas coarctatus, the red whelk Nept-unea antiqua, the sponge Suberites Wcus or the polychaet
Thelepus cincinnatus were recorded only in the Boxes deeper than 50 m (all Boxes except Box A). The polychaet
Hyalinoecia tubicola, the shrimp Spirontocaris lilljeborgi, the sea urchin Echinus elegans or the barnacle Verruca stroemia were found only in the Boxes D, L and M (depth >100 m) or Boxes L and M (Norwegian coast; depth >100 m). The masked crab Corystes cassivelaunus was recorded only in the Boxes A and C situated in low water and near the 50-m depth contour, respectively. Other spe-cies such as the brittle stars Ophiura albida (Box A) and
Ophiothrix fragilis (Box C) or the opisthobranch Scap-hander lignarius (Box M) were found only in one Box (Fig.2).
Species accumulation curves
The number of species (species richness) in the Boxes was found to be a function of increasing sampling eVort (Fig.5). With one replicate 17% (Box B) to 28% (Box M) of the species recorded in 60–67 replicates were caught, with nine replicates 53% (Box A) to 60% (Box M) (Fig.5). The spe-cies accumulation curves did not even approach the asymp-tote in any Box after 60–67 replicates. The increase of species numbers after 60–67 replicates made up only 0.2–0.6 species per additional sample. This ratio was higher in the species-rich Boxes B, D, L, and M (0.4–0.6 species) than in the species-poor Boxes A and C (0.2 species) due to a higher number of rare species found in these Boxes.
Multivariate community analysis
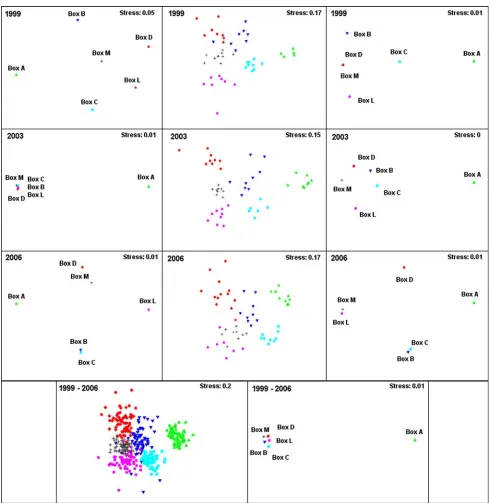
to the community in Box A in 1999 (presence/absence) and 2003 (fourth root). In contrast, all communities in the Boxes were rather evenly distributed in 1999 (fourth root) and 2006 (presence/absence). Additionally, a high similar-ity was found between the communities in Boxes L and M
in 2003 (presence/absence), whereas Box M was grouped together with Box D in 2006 (fourth root).
The MDS analyses based on nine replicates per Box re X-ect similar results in 1999, 2003 and 2006 for both transfor-mations. Additionally, the spatial similarities based on nine
Table 1 Frequency of
occurrence, mean abundance and contribution to similarity within the Boxes of the Wve dominant species in Boxes A, B, C, D, L and M
Mean similarity (%)
Frequency (%)
Abundance (ind. 500 m¡2)
Contribution to similarity (%)
Box A 63/62 Asterias rubens 100 132 15/24
Liocarcinus holsatus 100 42 13/13
Ophiura albida 94 672 13/18
Astropecten irregularis 94 27 13/13 Pagurus bernhardus 94 5 13/9 Corystes cassivelaunus 85 13 9/8
All species – 929
Box B 50/52 Pagurus bernhardus 97 8 10/17
Asterias rubens 97 6 10/16
Epizoanthus incrustatus* 96 – 9/– Astropecten irregularis 88 3 8/10
Anapagurus laevis 87 2 8/10
Neptunea antiqua 82 2 7/8
All species – 40
Box C 61/62 Astropecten irregularis 100 44 7/14
Asterias rubens 100 7 7/9
Buccinum undatum 100 13 7/9
Pagurus bernhardus 100 13 7/10
Colus gracilis 88 7 5/6
Luidia sarsi 86 7 5/6
All species – 142
Box D 49/52 Crangon allmanni 98 64 9/22
Anapagurus laevis 95 9 9/15
Pagurus bernhardus 92 8 8/14
Pagurus prideaux 91 10 8/11
Epizoanthus incrustatussp.* 96 – 8/– Adamsia carciniopados*sp.* 89 – 8/–
All species – 116
Box L 52/53 Echinus elegans 100 484 8/20
Astropecten irregularis 100 44 8/15
Ascidiellasp.* 100 5 6/–
Anapagurus laevis 97 7 8/9
Pagurus pubescens 90 3 7/7
Thelepus cincinnatus 85 2 6/6
All species – 602
Box M 63/60 Anapagurus laevis 100 30 5/10
Pagurus pubescens 100 28 5/10
Pagurus prideaux 100 12 5/8
Ascidiella sp.* 100 5 3/–
Adamsia carciniopadus* 98 11 5/–
Suberites Wcus* 93 – 5/–
All species – 177
replicates coincide with those based on 60–67 replicates per Box. They reveal a high dissimilarity of the community in Box A to all other Boxes, but a similar community structure in Boxes B and C in the central North Sea as well as in Boxes D, L and M in the northern North Sea. They also show a rather high small-scale variability within a single Box, but the communities were signiWcantly diVerent as conWrmed by the ANOSIM test (Table3). The ANOSIM test based on 60–67 replicates and provided R values of 0.83
Fig. 2 Total number of species per haul for total epifauna, free-living
epifauna and sessile epifauna
0 20 40 60 80 100 120 140 160
A B C D L M
Boxes
No. species
total epifauna free-living epifauna sessil epifauna
Fig. 3 Total number of sessile species per haul and taxonomic group
0 10 20 30 40 50 60 70
A B C D L M
Boxes
No
. species
Bryozoa Ascidiacea Hydrozoa Cirripedia Anthozoa others
Fig. 4 Total number of free-living species per haul and taxonomic
group
0 20 40 60 80 100
A B C D L M
Boxes
No
. species
Bivalvia Echinodermata Gastropoda others Crustacea
Table 2 Frequencies (%) of species in the Boxes
Frequencies below 8% are not shown. Sessile species are marked with an asterisk (*)
Boxes
A B C D L M
Asterias rubens 100 97 100 68 64 85 Astropecten irregularis 94 88 100 22 100 92 Crangon allmanni 48 51 32 98 80 77 Pagurus bernhardus 94 97 100 92 69 93 Anapagurus laevis 87 32 95 97 100 Colus gracilis 40 88 38 89 93 Hyas coarctatus 48 78 48 56 85 Neptunea antiqua 82 82 51 72 93 Suberites Wcus* 64 80 78 23 93 Thelepus cincinnatus 60 31 26 85 80 Hyalinoecia tubicola 63 46 68 Spirontocaris lilljeborgi 22 30 28
Echinus elegans 100 52
Verruca stroemia* 21 32
Ophiura albida 94
Leptasterias muelleri 40 Ophiothrix fragilis 75
Scaphander lignarius 42
Corystes cassivelaunus 85 77
Fig. 5 Species accumulation curves for the Boxes A, B, C, D, L and M
0 20 40 60 80 100 120 140 160
0 20 40 60 80
No
. species
No. hauls
Box A Box B Box C
to 0.94 at P= 0.001 (H0 can be rejected), indicating that there were signiWcant diVerences between the communities in the Boxes A, B, C, D, L and M (Table3). The average similarities between replicates within the Boxes varied between 49% and 63% (based on 60 to 67 replicates); spe-cies contributing to these similarities are listed in Table1.
The MDS analyses based on the mean of nine and 60–67 replicates, respectively, revealed almost the same spatial
pattern as the non-averaged nine and 60–67 replicates for both transformations. However, in 2006 (presence/absence) and 1999 (fourth root), this spatial pattern became evident only if more than one replicate per Box was used. Gener-ally, nine and more replicates per Box as well as their means provide similar spatial patterns using multidimen-sional scaling and thus provide better results than single replicates per Box.
Fig. 6 Multidimensional scaling (MDS) plots based on
presence/ab-sence transformed data of the Boxes A, B, C, D, L and M. MDS were calculated using one replicate (left), nine replicates (centre), and the
Discussion
The number of epifaunal species was generally lower in the southern North Sea than in central and northern areas. Also distribution patterns of single species found already in pre-vious studies were reXected in our results (Table2). For example, the limitation of the masked crab Corystes cassi-velaunus and the brittle star Ophiura albida to an area north of the Dogger Bank (Box A; Table2) was already
mentioned by Frauenheim et al. (1989). Zühlke et al. (2001a) found the polychaet Hyalinoecia tubicola limited to an area north of the 80-m contour (Box D, L and M; Table2), and the polychaet Thelepus cincinnatus, the sponge Suberites
Wcus as well as the spider crab Hyas coarctatus and the her-mit crab Anapagurus laevis limited to an area north of the 50-m contour (all Boxes except Box A; Table2). Species such as the sea stars Asterias rubens and Astropecten irreg-ularis as well as the hermit crab Pagurus bernhardus were
Fig. 7 Multidimensional scaling (MDS) plots based on 4th root
trans-formed data of the Boxes A, B, C, D, L and M. MDS were calculated using one replicate (left), nine replicates (centre), and the mean of nine
frequently found in all Boxes (Table2) and their ubiquity in the North Sea was consistent with distribution patterns found in previous studies (Frauenheim et al. 1989; Zühlke et al. 2001a; Callaway et al. 2002).
Spatial community structure
Glèmarec (1973) introduced the concept of the three infau-nal étages in the North Sea, which largely correspond with the areas separated by the 50, 100 and 200-m depth con-tour. This concept for the benthic infauna was conWrmed and diVerentiated by Künitzer et al. (1992). Also, most epi-faunal large scale studies conWrmed the importance of this depth contours for the separation of epifaunal communities in the North Sea (Dyer et al. 1983; Basford et al. 1989; Fra-uenheim et al. 1989; Duineveld and van Noort 1990; Jen-nings et al. 1999; Rees et al. 1999; Zühlke et al. 2001a; Callaway et al. 2002). Especially, the 50-m depth line was the most conspicuous boundary for epifaunal communities separating the southern and central-northern North Sea (Callaway et al. 2002). The 50-m depth contour closely matches the boundary between mixed and stratiWed waters and more abrupt changes in the biotic and abiotic environ-ment in this area are most likely responsible for the distinct faunal separation. The distinctness of the 50-m contour is reXected in our results by greater diVerences in community structure between Box A and the remaining Boxes as shown by MDS analyses, even those based on one replicate per Box (Fig.6, 7). In general, higher abundances of scav-enging species, the scarcity of sessile fauna and the low species richness in Box A contribute most to these diV er-ences (Table1; Fig.2), and these results coincided with several previous large-scale studies (Jennings et al. 1999; Zühlke et al. 2001a; Callaway et al. 2002). One of the four diVerent communities in the southern North Sea identiWed by Callaway et al. (2002) was characterised by the scaveng-ing species Asterias rubens, Liocarcinus holsatus, Ophiura albida, Astropecten irregularis, Pagurus bernhardus and
Corystes cassivelaunus, which were in turn the most fre-quently found species in Box A (Table1). Similar to our results Hinz et al. (2004) and Reiss and Kröncke (2004) found high abundances of Asterias rubens and Ophiura
albida in the area of Box A. The sea urchin Psammechinus miliaris was found to be a characteristic species of the south (Dyer et al. 1983; Cranmer 1985; Jennings et al. 1999; Callaway et al. 2002), but was scarce in Box A. More frequent records in the beginning of this study indicate the disappearance of this species in Box A.
The diVerences in community structure between the Boxes north of the 50-m contour only becomes evident if nine or more replicates are used. Basford et al. (1989) mentioned the importance of the 100-m depth contour since it separates the more stable northern environment from the more variable central area. In our study it sepa-rates the Boxes B and C in the central North Sea from the Boxes D, L and M in the northern North Sea. But the MDS analysis revealed a less obvious separation of the communities in the central and northern North Sea. How-ever, the results of the ANOSIM analysis and the high mean similarity of the replicates per Box (49–63%) indi-cate diVerent communities in the Wve Boxes. But species composition partly diVers from that determined in corre-sponding parts of the North Sea by previous large-scale studies.
Box C (mean depth 60 m) was a species-poor Box pro-viding an intermediate state between the southern and the central North Sea (Fig.2). High abundances of the sea star
Astropecten irregularis as well as frequent records of gas-tropods such as Buccinum undatum and Neptunea antiqua
or species such as the spider crab Hyas coarctatus were found (Table1), which is characteristic of the central North Sea (Basford et al. 1989; Jennings et al. 1999; Callaway et al. 2002). But additionally, the masked crab Corystes cassivelaunus was a common species in Box C (Table2), which is a characteristic species of the southern North Sea (Callaway et al. 2002). The brittle star Ophiothrix fragilis
was exclusively found in Box C. The intermediate state of Box C was also reXected in the results of the MDS (Figs.6, 7), particularly in those based on the mean of nine or more replicates.
Low abundances were characteristic of the slightly deeper Box B (mean depth 75 m), which was situated in the central North Sea near the British coast. Mean abundance reached 40 individuals/500 m² in 67 replicates and the her-mit crab Pagurus bernhardus was the most abundant spe-cies (8 ind./500 m²). In general, low densities of spespe-cies and high numbers of sessile fauna were characteristic of the central part of the North Sea (Zühlke et al. 2001a) coincid-ing with our results (Table1; Figs.2, 5). But species distri-bution was partly diVerent. Species such as Hyalinocia tubicola and Echinus sp. were described as characteristic of the central North Sea by Callaway et al. (2002), but were rare in our study in Box B (occurrence <8%; Table2). Additionally, the area surrounding Box B was deWned as “NW North Sea gravelly group” by Rees et al. (1999), but
Table 3 ANOSIM results of presence/absence and 4th root
trans-formed data
P< 0.001
Presence/absence Fourth root
Nine replicates 1999 2003 2006 1999 2003 2006 0.83 0.91 0.90 0.90 0.94 0.94 60–67 replicates 1999–2006 1999–2006
characteristic species such as Hyas coarctatus or Colus gracilis were found rather irregular in Box B, whereas
Astropecten irregularis as a common species in Box B was not found by Rees et al. (1999).
The community in Box D also provided an intermediate state between the central and the northern North Sea. High numbers of sessile fauna as in Box B, together with the fre-quent occurrence of species such as Epizoanthus incrusta-tus leads to suspect that Boxes B and D belong to a community in front of the British coast, which was deWned as “NW North Sea gravelly group” by Rees et al. (1999). Furthermore, the shrimp Crangon allmanni, the most abun-dant and frequent species in Box D, was described by Jen-nings et al. (1999) as a characteristic species of the central North Sea and was also found in high abundances by Bas-ford et al. (1989) and Zühlke et al. (2001a) in the area of Box D. On the other hand, the hermit crab Pagurus pri-deaux is a northerly distributed species (Basford et al. 1989; Zühlke et al. 2001a) and was a characteristic species of Boxes D and M (Table1).
High abundances of sea urchins of the genus Echinus
were mentioned on the edge of the Norwegian channel by Ursin (1960), Dyer et al. (1983), Cranmer (1985), Basford et al. (1989) and Zühlke et al. (2001a) what corresponds with our results in Box L (Table1). We identiWed Echinus elegans in Boxes L and M, but the cited authors found also
Echinus acutus or its variations E. a. Xemmingii (Forbes) and E. a. norvegicus (Duben and Koren). Gage et al. (1986) mentioned that it is usually not possible to separate smallest specimens of E. a. var. norvegicus and E. elegans. Addi-tionally, the hybridisation of these species might be possi-ble (Mortensen 1977; Zühlke et al. 2001b). The hermit crab
Pagurus pubescens and the sea squirts of the genus Ascidi-ella were common species in Boxes L and M and were found to be more north easterly distributed species (Basford et al. 1989; Zühlke et al. 2001a). The opisthobranch Scap-hander lignarius is a speciWc species of Box M and were also found in high abundances in the area of this Box by Basford et al. (1989).
The eVect of higher replication on species number
The research on epifaunal communities in the North Sea started in the 1980s (Dyer et al. 1982; Dyer et al. 1983). Since then, several authors described the distribution of epi-faunal species in the North Sea on large-scale surveys (Fra-uenheim et al. 1989; Duineveld and van Noort 1990; Jennings et al. 1999; Zühlke et al. 2001a; Callaway et al. 2002). A wide range of sampling gears and methods as well as diVerent data analyses were used in these studies. For example, Basford et al. (1989) sampled the epifauna of the northern North Sea using a 2-m Agassiz trawl, while Dyer et al. (1983) used a commercial otter trawl of the Cranton
type. The use of small semi-quantitative beam trawls and the standardizations of the sampling methods described by Jennings et al. (1999) were a useful improvement. The stan-dard 2-m beam trawl provided better qualitative results than larger otter trawls (Jennings et al. 1999), and the subse-quent use has made the following studies easier to compare. However, catching eYciency of the 2-m beam trawl is low and varied greatly between species. Reiss et al. (2006) found catching eYciencies varying between 9% ( Liocarci-nus holsatus) and 72% (Processa spp.) for the same 2-m beam trawl as used in this study. Thus, the abundance of epifauna will be underestimated by a factor of 1.4 up to 11. Therefore, trawls were generally regarded as semi-quantita-tive gears, which may be used for qualitasemi-quantita-tive sampling (Eleftheriou and Moore 2005). Appropriate replication can partly overcome the low catching eYciency of the 2-m beam trawl and, thus, improve the quality of the data. But little is known about the eVect of increasing numbers of replicates on the quality of data sampled with beam trawls. For benthic infauna, Rumohr et al. (2001) found that more than ten replicates with a van Veen grab are required in order to include more than two-thirds of the species found in 70 replicates. This partly corresponds with our results for the 2-m beam trawl even though the results depend on the area sampled. We need 11 (Box C) to 19 (Box A) replicates in order to include two-thirds of the species found in 60–67 replicates, probably due to the larger sampling area in our study compared to those of Rumohr et al. (2001) and a bet-ter qualitative sampling by the van Veen grab compared to the 2-m beam trawl. The numbers of replicates are often a problem of time and Wnancial constraints. Therefore, most large-scale studies used a low-replicated sampling strategy in favour of a great sampling grid. For example, Callaway et al. (2002) took one to three samples in each 139 ICES rectangles of 30£30 nautical miles covering the whole North Sea. They found 5–19 species in the area of Box A while we found 28 species in 9 replicates and 53 species in 66 replicates. This indicates an underestimation of species richness by Callaway et al. (2002) by a factor of 2.8–11. However, temporal variability of species richness in the Boxes is not completely excluded in our study what can bias the species accumulation curves. Neumann (2006) found an increasing species richness in Box A from 1999 to 2004 while it were rather constant in Boxes C and L over the same period. Thus, the estimation of species richness could be slightly over- or under estimated in the present study, particularly those in Box A.
The eVect of higher replication on community structure
2004; Reiss and Kröncke 2004). The MDS technique attempts to place samples on a “map” in such a way that distances between samples agree with the rank order of the corresponding (dis)similarities (Clarke and Warwick 2001). Thus, it is necessary to sample a representative community assemblage to get an adequate “map” of the temporal or spatial diVerences between communities. Our results show that this can hardly be achieved with one replicate due to the qualitative and quantitative constraints of the 2-m beam trawl described above. Thus, the MDS plots based on one replicate per Box revealed completely inconsistent spatial patterns of the communities in the Boxes. On the other hand, even those MDS show the distinctness of the 50-m depth contour expressed by the high dissimilarity of Box A to all other Boxes. Thus, even one replicate could be suY -cient where the samples are expected to divide into well-deWned groups. But a consistent spatial pattern between the communities of the Boxes was only revealed if nine or more replicates were used. Here, the MDS plots again show the high dissimilarity of Box A to the other Boxes but addi-tionally a temporal consistent spatial pattern of the boxes north of the 50-m contour. The speciWc species distribution in the Boxes leads to well-deWned communities as con-Wrmed by the ANOSIM analysis, and the less obvious sepa-ration of these communities by the MDS analysis coincides with less clearly deWned faunal boundaries in the northern and central North Sea mentioned by Callaway et al. (2002). Additionally, the MDS plots based on nine or more repli-cates were similar for fourth root (quantitative) and pres-ence/absence (qualitative) transformation indicating still useful quantitative results for 2-m beam trawls with an appropriate replication.
Acknowledgments We thank the captains and crews of FRV
“Wal-ther Herwig III” for their help with sampling. The data analysis was funded by the EWE-Foundation (Oldenburg), which is kindly acknowledged.
References
Basford DJ, Eleftheriou A, RaVaelli D (1989) The epifauna of the north-ern North Sea (56°–61°N). J Mar Biol Assoc UK 69:387–407 Bowman RE, Stillwell CE, Michaels WL, Grosslein D (2000) Food of
Northwest Atlantic Fishes and Two Common Species of Squid. National Oceanic and Atmospheric Administration (NOAA), Technical Memorandum NMFS-NE-155, Woods Hole, Braber L, De Groot SJ (1973) The food of Wve XatWsh species
(Pleuronetiformes) in the southern North Sea. Neth J Sea Res 6:163–172
Callaway R, Alsvag J, de Boois I, Cotter J, Ford A, Hinz H, Jennings S, Kröncke I, Lancaster J, Piet G, Prince P, Ehrich S (2002) Diver-sity and community structure of epibenthic invertebrates and Wsh in the North Sea. ICES J Mar Sci 59:1199–1214
Clarke KR, Warwick RM (2001) Change in marine communities: an approach to statistical analysis and interpretation. Plymouth Ma-rine Laboratory, Plymouth
Cranmer GJ (1985) Recent investigation into the distribution of regular echinoids in the North Sea. J Mar Biol Assoc UK 65:351–357 Duineveld GCA, van Noort GJ (1990) Geographical variation in the
epifauna of the southern North Sea and adjacent regions, vol 9. ICES CM 1990/MINI, p 7
Dyer MF, Fry WG, Fry PD, Cranmer GJ (1982) A series of north sea benthos surveys with trawl and headline camera. J Mar Biol As-soc UK 62:297–313
Dyer MF, Fry WG, Fry PD, Cranmer GJ (1983) Benthic regions within the North Sea. J Mar Biol Assoc UK 63:683–693
Ehrich S, Adlerstein S, Brockmann U, Floeter J, Garthe S, Hinz H, Kröncke I, Neumann H, Reiss H, Sell AF, Stein M, Stelzenmüller V, Stransky C, Temming A, Wegner G, Zauke GP (2007) 20 years of the German small-scale bottom trawl survey (GSBTS): a re-view. Senckenb Marit 37:13–82
Eleftheriou A, Moore DC (2005) Macrofauna techniques. In: Elefthe-riou A, McIntyre A (eds) Methods for the study of marine ben-thos. Blackwell, Oxford, pp 1–418
Frauenheim K, Neumann V, Thiel H, Türkay M (1989) The distribu-tion of the larger epifauna during summer and winter in the North Sea and its suitability for environmental monitoring. Senckenb Marit 20:101–118
Gage JD, Tyler PA, Nichols D (1986) Reproduction and growth of Echinus acutus var. norvegicus Düben & Koren and E. elegans Düben & Koren on the continental slope oV Scotland. J Exp Mar Biol Ecol 101:61–83
Glèmarec M (1973) The benthic communities of the European North Atlantic continental shelf. Oceanogr Mar Biol Ann Rev 11:263– 289
Hinz H, Kröncke I, Ehrich S (2004) Seasonal and annual variability in an epifaunal community in the German Bight. Mar Biol 144:735– 745
Jennings S, Lancaster J, Woolmer A, Cotter J (1999) Distribution, diversity and abundance of epibenthic fauna in the North Sea. J Mar Biol Assoc UK 79:385–399
Kaiser MJ, Rogers SI, McCandless DT (1994) Improving quantitative surveys of epibenthic communities using a modiWed 2 m beam trawl. Mar Ecol Prog Ser 106:131–138
Klemetsen A (1993) The food of the long-rough dab (Hippoglossoides platessoides Limandoides Bloch) in Balsfjorden, North Norway. Sarsia 78:17–24
Künitzer A, Basford D, Craeymeersch JA, Dewarumez JM, Dörjes J, Duineveld GCA, Eeleftheriou A, Heip C, Herman P, Kingston P, Niermann U, Rachor E, Rumohr H, de Wilde PAJ (1992) The benthic infauna of the North Sea: species distribution and assem-blages. ICES J Mar Sci 49:127–143
Lydersen C, Gjertz I, Weslawski JM (1989) Stomach contents of au-tumn-feeding marine vertebrates from Hornsund, Svalbard. Polar Rec 25:107–114
Mortensen T (1977) Handbook of the Echinoderms of the British Isles. Backhuys, Rotterdam
Neumann H (2006) Räumliche und zeitliche Variabilität unterschiedli-cher Epifaunagemeinschaften in der Nordsee. Diploma thesis. Carl von Ossietzky University, Oldenburg
Rees HL, Pendle MA, Waldock R, Limpenny DS, Boyd SE (1999) A comparison of benthic biodiversity in the North Sea, English Channel, and Celtic Seas. ICES J Mar Sci 56:228–246
Reiss H, Kröncke I (2001) Spatial and temporal distribution of macro-fauna in the Otzumer Balje (East Frisian Wadden Sea, Germany). Senckenb Marit 31:283–298
Reiss H, Kröncke I (2004) Seasonal variability of epibenthic commu-nities in diVerent areas of the southern North Sea. ICES J Mar Sci 61:882–905
Rumohr H, Karakassis I, Jensen JN (2001) Estimating species rich-ness, abundance and diversity with 70 macrobenthic replicates in the Western Baltic Sea. Mar Ecol Prog Ser 214:103–110 Ursin E (1960) A quantitative investigation of the echinoderm fauna of
the central North Sea. Meddelelser fra Danmarks Fiskeri-Og Havundersogelser 2:1–204
Zühlke R, Alsvag J, de Boois I, Cotter J, Ehrich S, Ford A, Hinz H, Jarre-Teichmann A, Jennings S, Kröncke I, Lancaster J, Piet G,
Prince P (2001a) Epibenthic diversity in the North Sea. Senckenb Marit 31:269–281