INTERNATIONAL JOURNAL OF PHARMACEUTICAL, CHEMICAL AND BIOLOGICAL SCIENCES
Available online atwww.ijpcbs.com
DEVELOPMENT AND OPTIMIZATION OF FIXED DOSE
ANTIHYPERTENSIVE COMBINATION DRUGS USING DOUBLE
LAYER SUSTAINED RELEASE MICROSPHERE TECHNOLOGY
Anant Kumar
R.K.D.F School of Pharmaceutical Sciences, Bhopal, Madhya Pradesh, India.
INTRODUCTION
Microspheresare spherical empty particles with size varying from 50 nm to 2 mm. The microspheres arecharacteristically free flowing powers consisting of synthetic powder, which are biodegradable in nature ideallyhaving a particle size less than 200 μm. Solid biodegradable microspheres1 incorporating a drug dispersed ordissolved throughout particle matrix have the potential for the controlled release of drug. Traditional microspheredrug delivery systems using a single polymer have several inherent flaws such as high initial burst, lowencapsulation efficiency for highly water soluble drugs, inability to lend themselves to pulsatile or zero order releaseand lack of sustained release for periods suitable for periodic therapy. Composite double-walled microspheresadapted for the encapsulation of a highly water-soluble, have the ability to circumvent some of theselimitations1. The limitation of microspheres made of a single polymer encapsulating drugs includes an initial burstcaused by the release of the drug trapped on the surface during the encapsulation process and a progressively slowerrelease rate.
Therefore, microspheres made with a two-layered structure may have certain advantages over theircounterparts made from single polymers. In some applications, where the therapeutic range of the drug is wide orthe drug is nontoxic, this burst is not detrimental. However, for molecules with narrow therapeutic ranges or hightoxicity, this initial burst of drug can be a problem for the patient. In an attempt to better control the release kinetics, the formation of double-walled. Microspheres with the drug loaded in the inner core could provide release kinetics with a lower burst effect than polymeric microspheres made from a single polymer. There are several methods of making microspheres with a two-layered structure from polymer blends. One method is to simply encapsulate atherapeutic agent in microspheres using a conventional micro encapsulation technique and then to coat themicrospheres with a second polymer. This coating would reduce the burst effect since no protein or drug would beencapsulated on the surface. A second method entails polymer– polymer phase separation of binary blend of polymer solutions, which results in the
Research Article
ABSTRACT
For the development of Double walled microspheres, we have selected polymer: Chitosan and EudragitE100. The inner core which is made up of polymer chitosan will contain drug; propranolol hydrochloride and outershell which is made up of polymer Eudragit E100 contain; frusemide. Since Eudragit E100 is dissolving below pH5,will release the drug (furosemide) and attain therapeutic plasma concentration, which reduces the body fluid thus also reduces blood pressure then the inner core chitosan’s is a muco-adhesive, contains propranolol hydrochloride, adhesive to mucous layer of Stomach or GIT will provide the sustain release of the drug for a longer period (24hr).Therefore, it was the goal of present study to adapt methods of double-walled fabrication with modifications, for the successful encapsulation of water-soluble. Propanolol hydrochloride and water insoluble Furosemide, resulting in reduced-initial bursts as well as sustained release profiles suitable for the treatment of hypertension.
formation of microspheres that have a two-layered structure2. The solvent evaporation method has been modified to prepare double-walled microspheres .The usual process of microencapsulation by solvent evaporation entails the formation of an ‘‘oil in-water’’ emulsion of a polymer solution inan aqueous non-solvent. This emulsion creates the spherical droplets, which then harden as the solvent evaporates, creating solid polymer microspheres3. To form microspheres from a single polymer, the polymer is dissolved in avolatile organic solvent, such as methylene chloride, and mixed with the substance to been capsulated (i.e. drug orprotein), before adding to an aqueous nonsolvent bath. The solvent evaporation method has been used extensively toprepare microspheres from PLA and PLGA .In the modified solvent evaporation process used to form double-walledmicrospheres, two polymer solutions are briefly mixed before adding to the aqueous non-solvent bath. As the solventis slowly lost, the droplets of the polymer–polymer solution become more concentrated and the polymers begin tophase-separate. A homogeneous polymer solution undergoes phase separation into one phase rich in one polymer,and a second phase rich in the second polymer. For the treatment of hypertension, combination therapy is used. Inpractice large majority of hypertensive require two or more drugs. Near about 70% patients who achieve target BP (blood pressure) were being treated with two drugs. Even initial treatment of mild to moderate hypertension withlow dose combination is being advocated as an alternative strategy i.e. combination of -blocker and diuretics. Inour formulation, there are two drugs; propranolol hydrochloride and furosemide were selected as the combination of -blocker & diuretics.In spite of above reason, we are using diuretic furosemide and -blocker propranololhydrochloride, in our formulation. Since both the above drugs don’t have any type of chemical and pharmacologicalinteraction so that we have selected the combination of these drugs. But, when propranolol hydrochloride is co-administeredwith furosemide, the plasma concentration of propranolol hydrochloride is increased. Due to above reason in our double walled microspheres formulation, inner core which is made up of chitosan polymer containspropranolol hydrochloride will maintain sustain release of drug (24 hr) and outer shell which is made up of EudragitE100 (dissolve below pH 5) contains furosemide, will release the drug in the stomach and reduces the BP.
MATERIALS AND METHODS
5.1 Preparation, Optimization and Characterization of Chitosan Core Microspheres
Chitosan was obtained as gift sample from Central Institute of Fisheries Technology, kochi. The microspheresystem was prepared by ionic precipitation and chemical cross linking4 method. A specific amount of chitosan wasdissolved in 100 ml of 0.1M acetic acid solution. To the above solution 1% w/v Tween-80 was added with constantsstirring. Then sodium sulphate (20% w/v) solution was added during the stirring process, drop wise, until uniformturbidity was observed. To this, 1% w/v cross linking agent, glutaraldehyde was added and solution was stirred oradditional 1.0 hour to stabilize the microspheres. The stirring was made by mechanical stirrer. Now the microspheresuspension was centrifuged at 3000 rpm for 30 minutes and microspheres were collected. The microspheres werewashed twice with distilled water and freeze-dried.
5.1.2 Process Variables
There are various process variables which could affect the preparation and properties of the microspheres. Thepreparation procedure was accordingly optimized and validated.
5.1.3 Optimization of process variables The preparation of chitosan microspheres involves various process variables, but out of them the followingwere selected.
(A) Effect of polymer concentration (B) Effect of sodium sulphate (20% w/v) (C) Effect of surfactant (Tween-80) (D) Effect of stirring rate.
The effects of variables were observed on the final particle size, drug loading and percentage yield of microspheres.During the preparation of a particular system, the other variables were kept constant. The observations are shown in Table 5.1.2, 5.1.3, 5.1.4 and 5.1.5 after using different variables.
5.1.4 Characterizations of chitosan microspheres
(i) Size and Surface Morphology
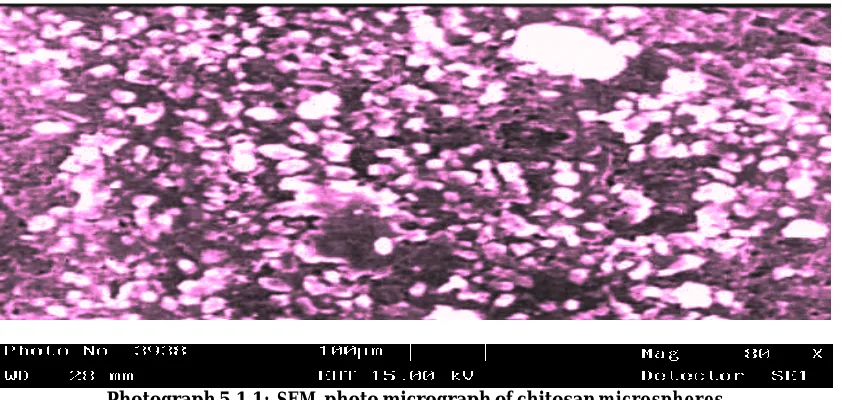
observationsare shown in table 5.1.2, 5.1.3, 5.1.4 and 5.1.5 after using different variables.The surface morphology and structure were visualized by scanning electron microscopy. The samples wereprepared by lightly sprinkling the microspheres powder on a double side adhesive tape which already shucked to onaluminum stubs. The stubs were then placed into fine coat ion sputter for gold coating. After gold coating sampleswere randomly scanned for particle size and microscopic structure showed in photograph 5.1.1.
(ii) Drug Contents
The drug content was calculated as per method(5) 100 mg of dried microspheres were weighted accuratelyand drug was extracted from microspheres by digesting for 36 hr with 10 ml of phosphate buffer saline (PBS pH-7.4) containing 60% methanol. During this period the suspension was agitated. After, 36 hours the suspension wascentrifuged at 3000 rpm for about 30 min. The supernatant obtained was assayed spectrophotometrically for drug contents.
(iii) Yield of MicrospheresAfter drying of microspheres in the round bottom flask, the microspheres were collected and weightedaccurately. The yields of microspheres obtaned after using different variables are given in table 5.1.2, 5.1.3, 5.1.4 and 5.1.5.
Yield of microspheres=
100
5.2 Preparation, Optimization and Characterization of Double Walled Microspheres
Eudragit E 100 is a cationic copolymer based on dimethylaminoethyl methacrylate and neutral methacrylicesters. Eudragit E 100 polymer kindly supplied from Alembic Ltd. Vadodara (India).
5.2.1 Method
Double walled micro spheres were prepared by emulsion evaporation method. In this method: chitosanmicrospheres (optimized formulation) were dispersed in aqueous media. Eudragit E 100 (2% w/v) solutions indichloromethane were prepared and the drug (furosemide) was dispersed. The aqueous phase was added with Span-80 solution (2%v/v). Now organic phase was added drop wise to aqueous phase to form w/o emulsion andhomogenized for 15 min at 2000 rpm. The resulting emulsion was added to
the aqueous solution of polyvinylalcohol (PVA, 2%w/v) with stirring at approximate at 1500 rpm for 2 hr until the organic phase was evaporated. The microspheres were prepared in aqueous PVA solution was filtered, washed and freeze-dried.
5.2.2 Process Variables
There are various process variables which could affect the preparation and properties of the microspheres. The preparation procedure was accordingly optimized and validated.
5.2.3 Optimization of process variables The preparation of double walled microspheres of Eudragit E100 involves various process variables but outof them the following were selected.
(A) Effect of core microspheres concentration and polymer concentration
(B) Effect of surfactant (Span-80) (C) Effect of stirring rate
The effects of variables were observed on the final particle size, drug loading and percentage yield ofmicrospheres. During the preparation of a particular system, the other variables were kept constant. Theobservations are shown in table5.2.2, 5.2.3 and 5.2.4 after using different variables.
5.2.4 Characterizations of double walled microspheres
(i) Size and Surface Morphology
The double walled microspheres were examined by optical microscope and electron microscope. Thefreshly prepared suspension of microspheres was examined on an optical microscope and size of the microsphereswas measured by using a pre-calibrated ocular micrometer and stage micrometer. The least count of ocularmicroscope was calculated as 8.1μm. Around 100 particles of each formulation were counted and observed. Theobservations are shown in table5.2.2, 5.2.3 and 5.2.4 after using different variables.
(ii) Drug Contents
.
(iii) Yield of Microspheres
After drying of microspheres in the round bottom flask, the microspheres were collected and weighted accurately. The percent yield of microspheres was calculated according to formula. The yields of microspheres obtained after using different variables are given in Table 5.2.2, 5.2.3 and 5.2.4.
5.3 In vitro Drug Release Studies
The different formulations were prepared by changing the drug-polymer ratio and subjected to in vitro drugrelease study in SGF (pH 1.2) and PBS (pH-7.4) solutions respectively and the observations are given in Table 5.3.1, 5.3.2, 5.3.3 and 5.
5.3.2 In vitro Drug Release Profile chitosan Microspheres
In vitro drug release from the various microspheres was performed in different mediums
(i) SGF (pH-1.2). (ii) PBS (pH-7.4).
These studies show that the effect of different fluid environment of the body on the drug release pattern from the prepared microspheres. For determination of drug release behavior of chitosan microspheres, 50 mg of chitosan microsphereswhere suspended in small amount of water. This suspension was placed in an open ended test tube; one end of test tube was tied with cellophane membrane and the test tube was placed in the beaker containing 100 ml of releasemedia (SGF/PBS). This solution was stirred at 100 rpm with magnetic stirrer at 37±10 C .Sink conditions weremaintained during the drug dissolution study. Sampling was done at specific interval (1hr). At each sampling, 1 mlof the solution withdrawn and was replaced with fresh media .The drug concentration was measured at respective λ-max in respective medium using “Shimadzu- 1700 pharmaspec UV/visible spectophotometer” after proper dilution. The above drug release procedure was applied on the different formulations (PC1 PC2, PC3 and PC4), whichwere prepared by changing the drug polymer ratio, in different pH (SGF and PBS) media. The study was donecontinuous for 10 hours and the total release of the drug after 24 hr was also observed by using “Shimadzu- 1700 pharmaspec UV/visible spectrophotometer” after proper dilution. The cumulative percentage drug release profile at interval of 1 hr was calculated and given in Table 5.3.1 and 5.3.2 for SGF (pH-1.2) and PBS (pH-7.4) respectively.
5.3.3 In vitro Drug Release Profile of double walled Microspheres
In vitro drug release from the various microspheres was performed in different mediums
(i) SGF (pH-1.2). (ii) PBS (pH-7.4).
These studies show that the effect of different fluid environment of the body on the drug release patternfrom the prepared microspheres. As in our double walled microspheres contains two layers and each layer contains adifferent drug, so, it is necessary to measure the release profile in individual layer. During the release study ofdouble walled microspheres, it may be possible that both drugs are present in the same release study medium. Sothat, for the measurement of release profile of both drugs, the analytical method must be necessary to develop. Theouter layer is made up of Eudragit E 100 which dissolves in stomach (below pH 5) is expected to release furosemideand the inner layer which consists of polymer chitosan dissolves throughout the GIT. Since, outer core, which is made up Eudragit E 100 is soluble in 0.1 N HCl, the microspheres was dissolved in SGF (pH-1.2) and release theouter shell’s drug which will give quick action. But, after dissolution of outer shell, inner core (microspheres ofchitosan) will be free and give sustain release of the drug (propranolol hydrochloride). Since, chitosan microsphers are mucoadhesive in nature, so, some chitosan microsphers will remain in stomach and rest will be passed to thestomach. So, in vitro study, it is necessary that release studies were performed in SGF (pH-1.2) for 24 hour and alsoin SGF (pH1.2) for 2 hr, PBS (pH-7.4) till to 24 hr. For determination of drug release behavior of double walled microspheres 50 mg of double walledmicrospheres where suspended in small amount of water. This suspension was placed in an open ended test tube; theone end of test tube was tied with cellophane membrane and test tube was placed in the beaker containing 100 ml ofrelease media (SGF/PBS).This solution was stirred at 100 rpm with magnetic stirrer at 37±10 C. The sampling was done at specific interval. Sink conditions were maintained during the drug dissolution study. Sampling was done at specific interval (1 hr). At each sampling, 1 ml of the solution withdrawn and was replaced with fresh media. The drug concentration was measured at respective λ-max in respective medium using “Shimadzu- 1700 pharmaspec UV/visible spctrophotometer” after proper dilution.
EC4 and EC5), which were prepared by changing the optimized core microspheres (chitosan microspheres) and Eudragit E 100polymer ratio, in different pH (SGF and PBS) media. The study was done continuous for 10 hr and the total releaseof the drug after 24 hr was also observed by using UV/visible spctrophotometer” after proper dilution. Thepercentage cumulative drug
release profile at interval of 1 hr was calculated and given in Table 5.3.3 and .3.4 forSGF (pH-1.2) and PBS (pH-7.4) respectively.
(ii) Drug Contents
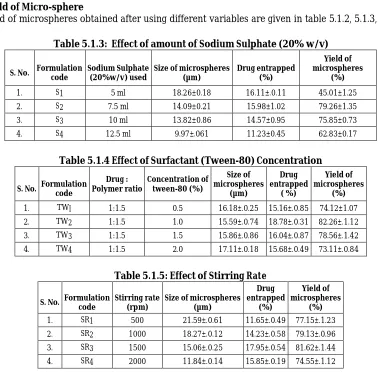
The results are given in the Table 5.1.2, 5.1.3, 5.1.4 and 5.1.5.
Table 5.1.2: Effect of Polymer Concentration
S. No
Formulation code
Drug : Polymer ratio
Size of microspheres
(µm)
Drug entrapped
(%)
Yield of microspheres
(%)
1. PC1 1:1 16.53±0.14 8.07±1.33 60.50±2.67
2. PC2 1:1.5 15.29±0.31 17.13±0.85 83.12±1.55
3. PC3 1:2 15.66±0.26 12.05±.097 77.24±1.48
4. PC4 1:2.5 17.09±0.19 8.91±1.31 67.48±0.91
(iii) Yield of Micro-sphere
The yield of microspheres obtained after using different variables are given in table 5.1.2, 5.1.3, 5.1.4 and 5.1.5.
Table 5.1.3: Effect of amount of Sodium Sulphate (20% w/v)
S. No. Formulation code
Sodium Sulphate (20%w/v) used
Size of microspheres (µm)
Drug entrapped (%)
Yield of microspheres
(%)
1. S1 5 ml 18.26±0.18 16.11±.0.11 45.01±1.25
2. S2 7.5 ml 14.09±0.21 15.98±1.02 79.26±1.35
3. S3 10 ml 13.82±0.86 14.57±0.95 75.85±0.73
4. S4 12.5 ml 9.97±.061 11.23±0.45 62.83±0.17
Table 5.1.4 Effect of Surfactant (Tween-80) Concentration
S. No. Formulation code
Drug : Polymer ratio
Concentration of tween-80 (%)
Size of microspheres
(µm)
Drug entrapped
( %)
Yield of microspheres
(%)
1. TWI 1:1.5 0.5 16.18±.0.25 15.16±.0.85 74.12±1.07
2. TW2 1:1.5 1.0 15.59±.0.74 18.78±.0.31 82.26±.1.12
3. TW3 1:1.5 1.5 15.86±.0.86 16.04±.0.87 78.56±.1.42
4. TW4 1:1.5 2.0 17.11±.0.18 15.68±.0.49 73.11±.0.84
Table 5.1.5: Effect of Stirring Rate
S. No. Formulation code
Stirring rate (rpm)
Size of microspheres (µm)
Drug entrapped
(%)
Yield of microspheres
(%)
1. SR1 500 21.59±.0.61 11.65±.0.49 77.15±.1.23
2. SR2 1000 18.27±.0.12 14.23±.0.58 79.13±.0.96
3. SR3 1500 15.06±.0.25 17.95±.0.54 81.62±.1.44
Photograph 5.1.1: SEM, photo micrograph of chitosan microspheres
5.2.3 Optimization of process variables The observations are shown in table5.2.2, 5.2.3 and 5.2.4 after using different variables.
(i)Size and Surface Morphology
The surface morphology and structure were visualized by scanning electron microscopy. The samples were prepared by same as chitosan microspheres and particle size and microscopic structure showed in photograph 5.2.1.
(ii) Drug Contents
The results are given in the Table 5.7, 5.8, and 5.9.
(iii) Yield of Microspheres
The yield of microspheres obtained after using different variables are given in Table 5.2.2, 5.2.3 and 5.2.4.
Table 5.2.2: Effect of core microspheres concentration and polymer concentration
S. No
Formulation code
CM*:Polymer ratio
Size of microspheres
(µm)
Drug F* mg
Drug entrapped
(%)
Yield of microspheres
(%)
1. EC1 1:1 28.35±2.26 200 42.15±1.16 56.61±1.23
2. EC2 1:2 33.53±2.42 200 58.07±1.33 78.50±2.67
3. EC3 1:3 34.29±1.81 200 67.13±0.85 83.12±1.55
4 EC4 1:4 35.66±2.26 200 72.35±1.15 85.24±1.48
5. EC5 1:5 51.09±1.19 200 45.21±1.56 82.48±0.91
F * = Furosemide CM* = Core microspheres
5.3 In vitro Drug Release Studies
Results are given in Table 5.3.1, 5.3.2, 5.3.3 and 5.3.4.
Table 5.2.3: Effect of Stirring Rate
S.No. Formulation code
Stirring Rate (rpm)
Size of microspheres(µm)
Drug entrapped(%)
Yield of microspheres(%)
1. EC4R1 500 45.46±1.35 71.62±0.52 82.52±1.64
2. EC4R2 1000 38.29±1.25 75.83±0.64 82.78±1.87
3. EC4R3 1500 34±47±1.65 78.61±0.53 83.18±0.98
4. EC4R4 2000 32.66±0.89 81.45±0.35 84.96±1.24
Table 5.2.4: Effect of Surfactant (Span-80) Concentration
S.No. Formulation code
Stirring Rate (rpm)
Size of microspheres(µm)
Drug entrapped(%)
Yield of microspheres(%)
1. EC4R4S1 0.5 38.35±2.26 72.32±0.43 75.82±1.65
2. EC4R4S2 1.0 33.53±2.42 79.23±0.68 82.43±1.74
3. EC4R4S3 1.5 31.29±1.81 82.71±0.35 83.38±0.98
4. 5.
EC4R4S4 EC4R4S5
2.0 2.5
32.66±2.26 32.89±2.53
80.15±1.02 78.57±1.24
79.96±1.24 83.13±2.14
1. EC4R4S1 0.5 38.35±2.26 72.32±0.43 75.82±1.65
Photograph 5.2.1: SEM of double walled microspheres
5.3.2 In vitro Drug Release Profile chitosan Microspheres
In vitro drug release from the various microspheres was performed in different mediums (i) SGF (pH-1.2).
(ii) PBS (pH-7.4).
The cumulative percentage drug release profile at interval of 1 hr was calculated and given in
Table 5.3.1 and 5.3.2 for SGF (pH-1.2) and PBS (pH-7.4) respectively
S. No. Time (hour)
Drug release in percent (%)
Formulation Code PC1 PC2 PC3 PC4 1. 0 0.00 0.00 0.00 0.00
2. 1 7.42 3.63 3.24 3.61 3. 2 14.61 8.82 7.21 6.92
4. 3 21.16 20.14 18.32 12.24
5. 4 33.16 25.44 22.21 20.43 6. 5 41.83 32.64 28.54 24.67
7. 6 46.65 40.58 36.21 32..22 8. 7 55.47 49.11 45.25 40.88
9. 8 62.24 58.97 55.20 53.24 10. 9 68.24 64.55 63.27 60.73
11. 10 72.81 70.70 68.23 63.12
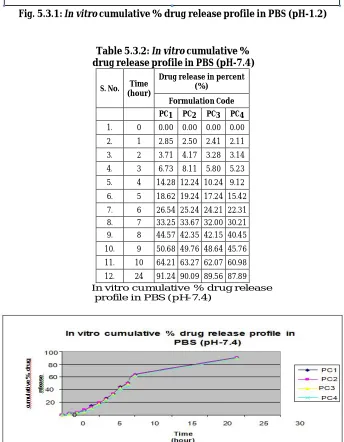
Fig. 5.3.1: In vitro cumulative % drug release profile in PBS (pH-1.2)
Table 5.3.2: In vitro cumulative % drug release profile in PBS (pH-7.4)
S. No. Time (hour)
Drug release in percent (%)
Formulation Code PC1 PC2 PC3 PC4 1. 0 0.00 0.00 0.00 0.00
2. 1 2.85 2.50 2.41 2.11 3. 2 3.71 4.17 3.28 3.14
4. 3 6.73 8.11 5.80 5.23 5. 4 14.28 12.24 10.24 9.12
6. 5 18.62 19.24 17.24 15.42
7. 6 26.54 25.24 24.21 22.31 8. 7 33.25 33.67 32.00 30.21 9. 8 44.57 42.35 42.15 40.45
10. 9 50.68 49.76 48.64 45.76
REFERENCES
1. Vyas SP and Khar RK. Targeted and controlled drug delivery. 2004;1:417-425.
2. Ofokansi KC and Adikwu MU. Formulation and Evaluation of Microspheres Based on Gelatin-Mucin mixtures for Rectal delivery of Cefuroxime Solution. Tropical J Pharm. 2007;6:825-832.
3. YooHS. Preparation biodegradable polymeric hollow microspheres using O/O/W emulsion stabilized Colloids Surf B Biointerfaces. Epub. 2006;52(1):47-51
4. Berthold, Berkland C, Cox A, Kim KK and Pack DW. Three-month, zero-order piroxicam release from monodispersed double- walled microspheres of controlled shell thickness. J Biomed Mater Res. 1996;70A:576–84.