Division VI
APPLICABILITY EVALUATION OF STEEL PLATE REINFORCED
CONCRETE STRUCTURE TO PRIMARY CONTAINMENT VESSEL OF
BWRs
(10) TESTING JOINED PART OF TOP-SLAB AND SHELL WALL
Tadashi Tamura1, Kazuya Ota1, Tomohisa Kurita 2, Masashi Tanabe 3, Yukiharu Ohga4, Tetsuo Abiru5
1 Senior Engineer, Shimizu Corporation, Japan 2 Chief Specialist, Toshiba Corporation, Japan 3 Specialist, Toshiba Corporation, Japan
4 Senior Engineer, Hitachi-GE Nuclear Energy, Ltd., Japan 5 Manager, The Chugoku Electric Power Co., Inc., Japan
ABSTRACT
Shear force loading tests were carried out using beam test specimens and tensile loading tests were also carried out using L-shape test specimens. Both tests targeted the joint between the top slab and the shell wall of an SC containment vessel (SCCV). Simulation analyses of these tests were conducted in order to determine the shear failure of the joint in case of accidents causing high temperatures and internal pressures. The loading tests were conducted with one side at ambient temperature or heated to 300°C.
The beam-type tests confirmed that heating conditions, unreinforced or reinforced with a rib steel plate, and shear-span ratio had an impact on the load-displacement relationships and damage conditions of the SC components. The L-shape tests confirmed that the joint between the shell and the top slab showed no breakage regardless of temperature conditions and reinforced or unreinforced. It also confirmed that our finite element analysis method was able to depict load-displacement curves and cracking resulting from the tests.
INTRODUCTION
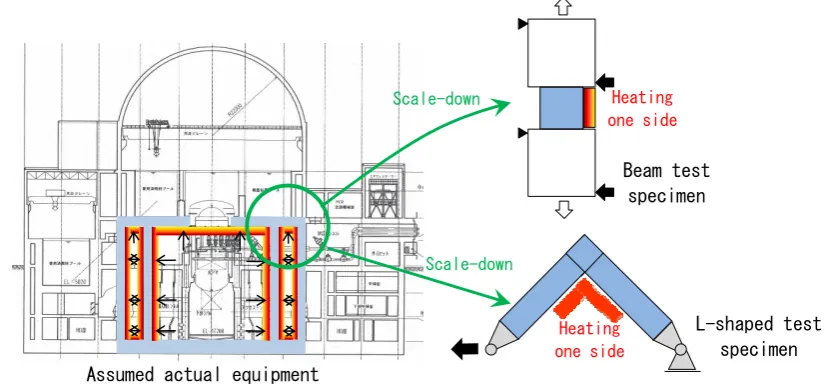
This paper reports loading tests on a corner (joint between top slab and shell wall) of an SC structured containment vessel (“SCCV”) under heating, and simulation analyses of the results, to determine the shear-fracture mode of a corner in the event of a severe accident. As shown in Figure 1, two types of tests were conducted, “tests on beam” and “tests on L-shaped frame,” which modeled the corner of an SCCV. The “tests on beam” targeted the area where shear force was excessive in the vicinity of the joint to determine shear characteristics of SC components under high temperature and internal pressure. The “tests on L-shaped frame” targeted the intersections between a top slab and shell wall to confirm that the intersections would not fracture earlier than other components in the event of a severe accident.
EXPERIMENTAL DETAILS
Test Cases
methods were set for the shear reinforcement: using tie bars and using a rib steel plate. The experimental tests on the L-shaped frame consisted of three cases. The test parameters were temperature conditions (ambient temperature, 300°C) and presence or absence of reinforcement with a rib steel plate.
Table 1: Test cases
No. Temperature
(℃)
Tensile force
(kN) Reinforcement
Shear Span Ratio M/QD
Compressive strength
σB(N/mm2)
Maximum load (kN)
1-1 405 36.5 891
1-2 0 36.1 510
1-3 Tie bar 36.8 1199
1-4 None 1.0 37.5 345
1-5 0.5 34.1 1569
1-6 1.0 35.0 1160
2-1 180 33.3 479
2-2 300 34.2 430
2-3 300*1 32.7 497
2-4 0 31.3 435
2-5 33.7 1383
2-6 1.0 34.4 1057
L-1 20 Rib steel plate 37.7 463*2
L-2 None 38.2 215
L-3 Rib steel plate 39.1 454*2
0.5
0.5
Existence -
300 20
300
L-shaped test
405
405
405
None
Rib steel plate Beam
test
None
Rib steel plate
*1: No. 2-3 were heated to 300 °C and then cooled to ambient temperature before applying force. *2: Load at No. L-1 and No. L-3 indicates the load when cracking was confirmed diagonal to the joint.
Test Specimens
Figure 2 and Figure 3 show a no-reinforcement test specimen and a rib-steel-plate-reinforced test specimen, respectively, as typical examples of beam test specimens. The test specimens were a 1/4 scale of the actual equipment so that the aggregate particle size for the concrete of the test specimen was set similar to that of the assumed actual equipment, and the material used was the same. The section of the test area was 450 mm wide, 500 mm high, and 500 mm long at M/QD = 0.5 or 1000 mm long at M/QD = 1.0. The steel plates on the upper and lower parts and the rib steel plate were assumed to be 5 mm thick and the material type was SPV490. The rear plane of the steel plate had headed studs at 50-mm vertical and horizontal intervals. For the concrete, ordinary portland cement was used and the maximum particle
Scale-down
Heating one side
Heating one side
Beam test specimen
L-shaped test specimen
Figure 1. Test specimen targeting the SCCV’s corner Assumed actual equipment
size of the coarse aggregate was set to 20 mm. The target compressive strengths (σB) of the concrete were
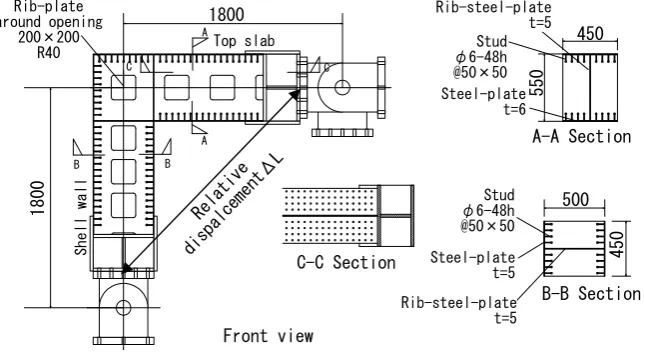
set to 30 to 40 N/mm2. As shown in Table 1, σB in the tests met target values. Figure 4 shows an L-shaped
test specimen reinforced with the rib steel plate. A steel frame pin support was fixed on the both ends of the L-shaped specimen, which modeled the vicinity of the intersections between top slab and shell wall. The scale and material were the same as those of the beam test specimen. In the tests, σB met the target
value of 30 to 40 N/mm2.
450 800 800 800
Stud φ6-60h @50×50 PL22 Width:150 PL-25 Steel-plate PL-5 500 450 800 A
A Steel-plate t=5
450
50
0
Figure 2. Beam test specimen (sectional view, M/QD = 0.5, no reinforcement)
Stud φ6-48h @50×50 PL22 Width:150 Rib-steel-plate PL-5 Steel-plate t=5 250 500 200
450 800 800 800 450
80 0 450 50 0 Rib-steel -plate t=5 B B
Figure 3. Beam test specimen (sectional view, M/QD = 0.5, reinforcement with rib steel plates)
Stud φ6-48h @50×50 Front view B-B Section C-C Section Rib-plate around opening 200×200
R40 Top slab
Shell wal l B B C C A-A Section Rib-steel-plate t=5 1800 18 00 450 55 0 500 450 Rela tive disp alce ment ΔL Steel-plate t=6 Rib-steel-plate t=5 Steel-plate t=5 Stud φ6-48h @50×50 A A
Figure 4. L-shaped test specimen (No. L-1 and No. L-3, reinforcement with rib steel plate)
Tests on Beam
Figure 5 shows the test procedure while Figure 6 shows the test condition, referring to the loading test (No-2-2) under 300°C heating as an example. In the test, the following ① to ③ were conducted, depending on temperature conditions and presence or absence of axial force.
A-A Section
①Heating:
The surface of the upper steel plate was heated to 300°C over two hours, and the surface temperature was kept at 300°C until the internal temperature distribution became that of the assumed actual equipment. However, for No. 2-1, the surface temperature of the steel plate was heated to 180°C over 30 minutes and then force was applied. For No. 2-3, the surface temperature of the steel plate was kept at 300°C for 20 hours or so. The steel plate was then cooled to ambient temperature before force was applied.
②Introduction of tensile axial force:
Jacks were fixed at the steel jigs on both ends and tensile axial force was applied to the test specimen using the jacks. Then, a constant axial force was maintained until the end of force application. The axial force was 405 kN, which corresponds to the stress (1.8 N/mm2) generated on the shell wall due
to internal pressure in case of a severe accident. ③Shear force loading:
Two jacks were used to apply shear force of anti-symmetric bending state to the test areas. After long-term stress (shear stress: 1.0 N/mm2) and short-term stress (1.5 N/mm2) were repeatedly applied, a
monotonic load was applied to the test specimen until fracture occurred. However, for loading under 180°C heating, repeated load was not applied but monotonic load was applied until fracture occurred.
Figure 5. Procedure for heat and force application (No. 2-2 case)
L2 L2
P1 P2
P3 P4
L1 M/QD L1 L2
0.5 1.0
800mm 1200mm
800mm 600mm M/QD P1=P4 P2=P3
0.5 1.0
0.5・Q 1.0・Q
1.5・Q 2.0・Q
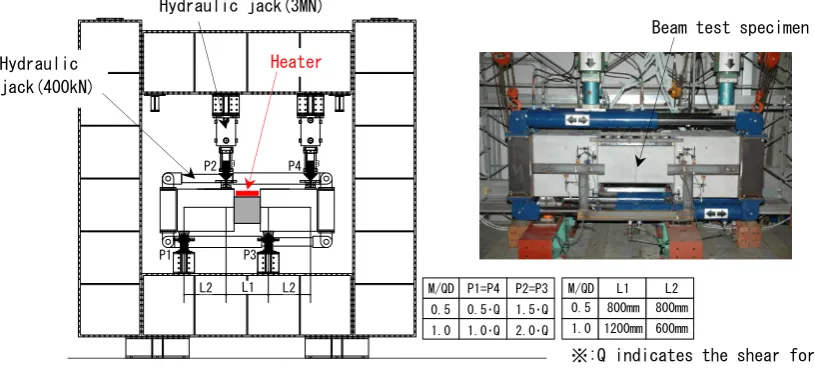
Figure 6. Conditions of heat and force application in test on beam (No. 2-2 case) Heater
Hydraulic jack(3MN)
Hydraulic jack(400kN)
Beam test specimen
※:Q indicates the shear force.
Axial force
22H
Axial force;405kN
Time
②Introducing axial force
τ=1N/mm2
τ=1.5N/mm2
Shear force
Breaking
Time
③Loading shear force Surface temperature of upper
steel plate;300℃
Temper
ature
Time
①Heating one side
Tests on L-Shaped Frame
Figure 7 and Figure 8 show the test procedure and conditions, respectively. In the test, the surface temperature of the inside steel plate was kept at 300°C, while a horizontal monotonic tensile force was applied to the end of the top slab. In this connection, the test at ambient temperature (No. L-1), as shown in Figure 7 ②, was conducted. Applied load was increased gradually until the events in the following (a) to (c) occurred.
(a) Same level in the event of an SA:
It was checked that the opening level (relative displacement ΔL) at both ends of the top slab and the shell wall shown in Figure 4 reached the same value in the event of an SA. ΔL in the event of an SA corresponds to the stress state of the actual equipment. ΔL was assumed to be 0.3 mm at ambient temperature and 0.6 mm at 300°C.
(b) Yield of steel: It was checked that the inside steel had yielded. The yield strain at ambient temperature was assumed to be 2700μ on the basis of the steel plate tensile test results, while the yield strain at 300°C was assumed to be 2200μ on the basis of test results and the references.1)
(c) Fracture of concrete: Cracking and other concrete damage was observed during force application. Concrete fracture was confirmed from the load-deformation curve.
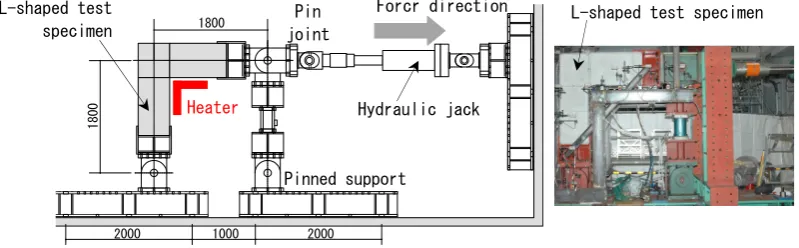
Figure 7. Tensile force application under heating at 300°C (No. L-2 and No. L-3 cases)
1800
1800
2000 1000 2000
Figure 8. Conditions of heat and force application in test on L-shaped frame (No. L-2 and No. L-3 cases)
①Heating 300℃
Temperature
300℃
Surface temperature of inside steel plate(300℃)
2h Time
②Tensile force application
Corresponding to SA event Load
Time Yield of inside
steel plate
Concrete fracture
Pinned support Pin
joint
Hydraulic jack Forcr direction
Heater
L-shaped test specimen L-shaped test
RESULTS OF TESTS ON BEAM AND ANALYTICAL STUDY
(1) Test results
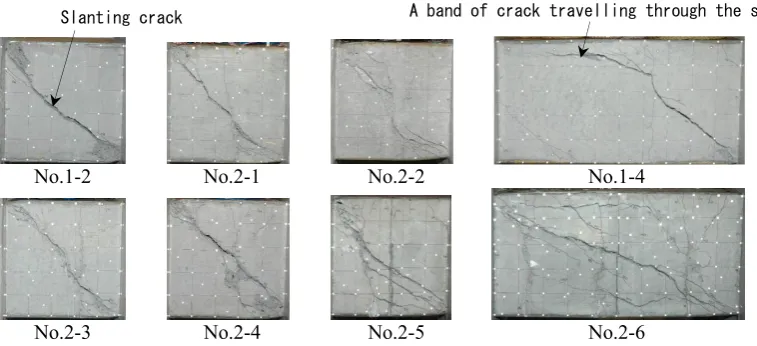
Figure 9 shows a case of damage after force application, while Table 1 lists the maximum loads for all cases. Regardless of whether or not the test specimen was subject to heat or axial force, or whether or not it was reinforced, diagonal cracks developed and concrete collapse occurred at the corner, leading to fracture. In connection with this, a crack band was observed that traveled through the stud head of the test specimens of M/QD =1.0 (No. 1-4, No. 1-6, and No. 2-6). The maximum load of No. 1-4 (no reinforcement) was the lowest, seemingly mainly because of this crack.
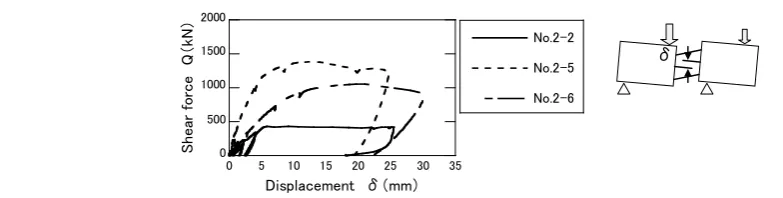
Figure 10 and Figure 11 show the shear-force versus displacement relationship. According to the results of No. 1-2 and No. 2-4 (Figure 10(a)), the initial stiffness and the maximum shear force under 300°C heating were small compared with those under ambient temperature, and heating lowered the maximum shear force by approx. 15%. According to the results of No. 2-1 and No. 2-2 (Figure 10(b)), the stiffness and the maximum shear force under 300°C heating were small compared with those under 180°C heating. The maximum shear force lowered by approx. 10%. In addition, the maximum shear force in No. 2-3, to which force was applied after heating to 300°C and then cooling to ambient temperature, was approx. 16% larger than the results obtained under heating to 300°C. According to the results of No. 2-2 and No. 2-5 (Figure 11), the maximum shear force increased when there was reinforcement with the rib steel plate. The maximum shear force became approx. 3.2 times larger than the case with no reinforcement. When M/QD was large, the maximum shear force became small. The maximum shear force of No. 2-6 (M/QD = 1.0) was approx. 25% smaller than that of No. 2-5 (M/QD =0.5).
No.1-2 No.2-1 No.2-2 No.1-4
No.2-3 No.2-4 No.2-5 No.2-6
Figure 9. Example of damage after end of force application
0 200 400 600
0 5 10 15 20 25
No.1-2
No.2-4
She
ar forc
e
Q
(
kN
)
Displacement δ(mm)
0 200 400 600
0 5 10 15 20 25
No.2-1
No.2-2
No.2-3
Shear fo
rce
Q(k
N
)
Displacement δ(mm)
(a) No.1-2, No.2-4 (b) No.2-1~No.2-3 Figure 10. Shear force-displacement relationship
0 500 1000 1500 2000
0 5 10 15 20 25 30 35
No.2-2
No.2-5
No.2-6
Sh
ear
fo
rc
e
Q(
kN
)
Displacement δ(mm)
Figure 11. Shear force-displacement relationship (No. 2-2, No.2-5, No.2-6)
(2) Analytical study
Simulation analyses of cases with rib steel plate reinforcement (No. 2-5 and No. 2-6)were conducted. Figure 12 shows the analytical model. For the stress-strain relationship of concrete and steel plate, non-linearity was considered. Lowering of material strength and stiffness under high temperature was set after referring to References.1), 2) In the analytical procedure, non-steady heat conduction analysis was
conducted on the basis of temperature loading. After introduction of axial force, analysis of elasto-plasticity in gradual increase was conducted based on the forced displacement. Figure 13 compares the test and analytical results. The load-displacement curve resulting from the analysis, and the cracking areas roughly match the test results.
(a) Appearance diagram (b) Transparent diagram
Figure 12. FEM analytical model (No.2-5)
0 500 1000 1500 2000
0 10 20 30
S
hea
r
fo
rce
Q
(
kN
)
Displacement δ(mm) No.2-5(Test) No.2-5(Analysis)
No.2-6(Test) No.2-6(Analysis)
(a) Shear force-displacement relationship (b) Plastic strain contour corresponding to tensile concrete (No. 2-5)
Figure 13. Comparison between test results and analytical results (No. 2-5, No.2-6) δ
Slanting crack Loading plate(Ridid body)
Steel-plate(Shell)
Concrete (Solid)
RESULTS OF TEST ON L-SHAPED FRAME AND ANALYTICAL STUDY
(1) Test results
Table 2 lists tensile load (P), relative displacement (ΔL), and steel plate strain for individual events. Figure 14 shows the damage condition after the end of force application. As for the results of No. L-1 (ambient temperature, with reinforcement), no damage, such as cracks, to the test specimen was observed at a load in the event of an SA (26.9 kN). The steel plate inside the shell yielded at a load of 245.0 kN, and cracks were observed along the diagonal direction of the joint at a load of 463.1 kN. The steel plate strain at that time was 12724μ. As for the results of No. L-2 (heating at 300°C, no reinforcement), no damage was observed at a load in case of an SA (19.9 kN). The steel plate inside the shell yielded at a load of 127.5 kN, and cracks occurred along the diagonal direction of the shell at a load of 152.4 kN. Afterwards, cracking developed and reached the maximum load (215.0 kN). The results of No. L-3 (heating at 300°C, with a reinforcement) were roughly the same as the results of No. L-1.
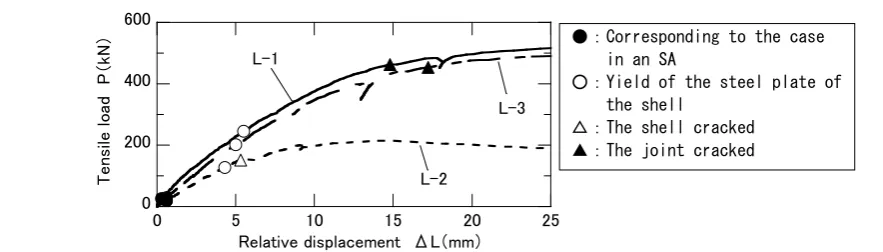
Figure 15 shows the relationship between tensile load and relative displacement. Regardless of whether or not heat was applied, the load-displacement relationship of No. L-1 and of No. L-3 showed similar forms. The curve after the joint had cracks showed a gradual increase. The load-displacement curve of No. L-2 had a peak at the maximum load, indicating less than half the yield strength as the other cases.
Table 2: Tensile load (P), relative displacement (ΔL), and steel plate strain
Event No. P(kN) ΔL(mm) Strain*2(μ)
L-1 26.9 (1)*1 0.3 236
L-2 19.9 (1) 0.6 948
L-3 29.6 (1) 0.6 736
L-1 245.0 (9.1) 5.5 2748
L-2 127.5 (6.4) 4.3 2203
L-3 201.2 (6.8) 5.0 2204
L-1 463.1 (17.2) 14.8 12724
L-2 152.4 (17.7) 5.3 2499
L-3 454.2 (15.3) 17.2 9393
Corresponding to the event of an SA
Yield of steel plate inside shell
Occurrence of slanting crack*3
*1: The figures ( ) indicate the ratio to load in the event of an SA. *2: Indicates the maximum strain of the steel plate inside the shell.
Figure 14. Damage condition after force application
No.L-1 No.L-2
The joint cracked Scale-up
0 200 400 600
0 5 10 15 20 25
Tens
ile
l
oa
d P(k
N
)
Relative displacement ΔL(mm) L-1
L-3
L-2
Figure 15. Relationship between tensile load and relative displacement (No. L-1 to No. L-3)
(2) Analytical study
Figure 16 shows an analytical model. Non-linearity is considered for the stress-strain relationship of concrete and steel plate. Lowering of the material strength and stiffness when subjected to high temperature was set by referring to references 1), 2). In the analytical procedure, analysis of elasto-plasticity
in gradual increase based on the forced displacement was conducted after non-steady heat conduction analysis was conducted on the basis of temperature and load application. Figure 17 shows the tensile-load versus relative-displacement relationship, while Figure 18 shows the plasticity strain contour corresponding to the tensile strength of concrete. The load-displacement curve resulting from the analysis and areas of cracks match well with the test results.
0 200 400 600
0 5 10 15 20 25
Tens
ile
lo
ad
P(k
N)
Relative displacement ΔL(mm) L-1(Test)
L-1(Analysis)
L-2(Test) L-2(Analysis)
Figure 16. FEM analytical model Figure 17. Load-displacement relationship of No. L-1 and No. L-2
(a) When cracks of joint occurred (b) Right after maximum load
Figure 18. Plasticity strain contour corresponding to tensile strength of concrete ●:Corresponding to the case
in an SA
○:Yield of the steel plate of the shell
△:The shell cracked ▲:The joint cracked
No.L-1 No.L-2 Shell wall
Top salb Joined part
CONCLUSION
To determine the structural characteristics of an SCCV in a severe accident, shear force tests using beam test specimens and tensile tests using L-shaped test specimens, both of which targeted the corner, were conducted. Simulation analyses were also made.
The results of the beam tests confirmed that the maximum yield strength and rigidity of the SC component decreased as the heating temperature and the shear span ratio increased. In addition, non-reinforced test specimens with a shear span ratio of 1.0 indicated the smallest maximum yield strength of all the test cases. This seems mainly attributable to a crack band travelling through the stud head. Regardless of whether or not there was reinforcement with a rib steel plate, the results of the L-shaped test specimen tests confirmed that the joint suffered no damage before the steel plate of the shell showed yielding.
In addition, in the cases of reinforced test specimens, the load gradually increased after the steel plate yielded. Meanwhile, in the case of non-reinforced test specimens, the shell had slanting cracks after the steel plate yielded, and reached its maximum yield strength. The yield strength was less than a half the maximum yield strength of the reinforced test specimens. 3D finite element analysis enabled us to roughly depict the maximum yield strength and crack locations, which indicated the test results. However, in the case of beam test specimens, evaluation of rigidity obtained from analyses were somewhat large, compared with that obtained from the tests.
ACKNOWLEDGMENTS
This work was mainly carried out during FY2011-2016 as Japan national project “Development of Integrity Evaluation Method for PCV Structure” with the participation of The Chugoku Electric Power Company, Inc., Tohoku Electric Power Company, Inc., Tokyo Electric Power Company, Inc., Chubu Electric Power Company, Inc., Hokuriku Electric Power Company, Inc., The Japan Atomic Power Company, Electric Power Development Company, Ltd., the Institute of Applied Energy, Toshiba Corporation and Hitachi-GE Nuclear Energy, Ltd.
We would like to thank Dr. T. Nishikawa, a Professor Emeritus at Tokyo Metropolitan University, Dr. K. Takiguchi, a Professor Emeritus at Tokyo Institute of Technology, Dr. I. Maruyama, a Professor at Nagoya University, and Dr. Y. Kitsutaka, a Professor at Tokyo Metropolitan University for valuable discussions.
REFERENCES
[1] The Japan Society of Mechanical Engineers:Codes for Nuclear Power Generation Facilities JSME S NC1-2008,2008