in characterisation and
crystaiiisation studies of iron-based aiioys
William Andrew Steer
UCL
University College London
A thesis submitted in accordance with the requirements of the University of London
for the degree of Doctor of Philosophy
All rights reserved
INFO RM A TIO N TO ALL U SER S
The quality of this reproduction is dependent upon the quality of the copy submitted.
In the unlikely event that the author did not send a complete manuscript
and there are missing pages, these will be noted. Also, if material had to be removed,
a note will indicate the deletion.
uest.
ProQuest U642574
Published by ProQuest LLC(2015). Copyright of the Dissertation is held by the Author.
All rights reserved.
This work is protected against unauthorized copying under Title 17, United States Code. Microform Edition © ProQuest LLC.
ProQuest LLC
789 East Eisenhower Parkway
P.O. Box 1346
Developed in the early 1980s, versatile X-ray storage phosphor screens have opened up
new possibilities in diffraction instruments for crystallography. Originally adopted by
high-pressure researchers using diamond-anvil cells and very small sample volumes, flat
phosphor screens give great advantage because of their high intrinsic sensitivity. But less
demanding applications still stand to benefit from increased throughput and enhanced
count rates made possible by this technology. With this in mind the Curved Image Plate
camera, a large radius (350mm and 185mm) Debye-Scherrer instrument primarily
designed for use with capillary-contained powder samples had been devised. As a
substantial part of this work, new software to pre-process the data, calibration procedures
and modes of operation were developed to enable the full potential of the system to be
realised. One particular application o f the GIF camera is the comparative study o f a large
number of samples, for example as a function of heat treatment.
Amorphous and derived nanocrystalline magnetic alloys are of increasing applied and
fundamental interest at present, and are predominantly produced by the melt-spinning
technique, in the form o f ribbons. Borohydride reduction o f metal-salt solutions has
recently also been shown to be capable of producing amorphous alloy, in powder form,
with potential for compaction into bulk materials. Amorphous Fe-M-B alloys
(M = Ni,Co,Mn,Cr) have been widely reported, and at UCL attempts had been made to
synthesise amorphous Fe-Zr-B by a similar approach. An investigation of the structural,
compositional and magnetic properties of the product o f this synthesis have been carried
out in this study. The application of the CIP camera has enabled the thermally-induced
crystallisation of such samples to be followed with unprecedented clarity. It is found,
contrary to previous thought, that the main product o f this synthesis consists of two
distinct amorphous phases, iron-boron and zirconium-oxide, mixed on a sub-micron
1. Background ...11
2. Formation of nanocrystalline magnetic aiioys ... 11
3. Chemical reduction synthesis of am orphous aiioys ... 12
4. Properties and characterisation ... 12
5. CIP XRD cam era ...14
6. Summary ... 14
II. CIP camera development ... 15
A. Introduction ...15
B. System overview ... 16
1. Image plate technology ... 16
2. Cam era hardware ... 18
3. Outline of operating procedures ... 22
C. Data pre-processing Software ...23
1. Introduction ... 23
2. Diffraction geometry study ...25
i. Curved Image Plate ...26
ii. Flat plate ... 31
3. Sam ple misplacement and other geometric errors ... 32
4. Scanner distortion characteristics ... 33
5. User Interface considerations and implementation ... 36
i. ‘CIP Analysis’ ... 36
ii. ‘Peaker* ...37
iii. ‘ScannerCalib’ ...37
iv. ‘GEL indexer* ... 37
6. Coding details ...38
i. ‘CIP Analysis’ ... 38
ii. ‘Peaker* ...43
iii. ‘ScannerCalib’ ... 46
7. User documentation ... 46
D. Hardware and procedurai refinements ...47
1. Magneticaily-mounted image-plates for scanning ...47
2. Initial cam era alignment routine ...47
3. Absorption of polycarbonate image-plate support ...47
4. Storm™ scanner trials ... 49
E. Real-world performance evaluation ... 50
3. Round Robin feedback ...51
F. Towards a ‘lab-based’ CIP system ...53
1. Introduction ... 53
2. Conventional Cu X-ray tube sources ... 53
3. Bede microsouRCE™ ...53
G. Summary ...55
III. Nanocrystalline magnetic materials ... 56
A. Introduction ... 56
1. Overview ... 56
2. Types of magnetism ...58
3. Ferromagnetism ...59
4. Amorphous alloys and their manufacture ... 61
5. Nanocrystalline soft-magnetic alloys ...63
i. Original d isc o v e ry ...63
ii. D ev elo p m en ts... 64
iii. Compositions ... 65
iv. Theoretical interpretation of magnetic effects ...67
6. Bulk nanocrystalline magnetic alloys ...69
7. Chemical reduction synthesis ... 70
i. Background ...70
ii. Production of Amorphous alloys ...71
iii. Iron-zirconium-boron synthesis at UCL ... 75
8. Aims and approach of this study ... 77
B. Experimental ... 79
1. Chemical precipitation ... 79
2. Sam ple thermal treatm ents ...80
i. Approach to thermal tre a tm e n ts ...80
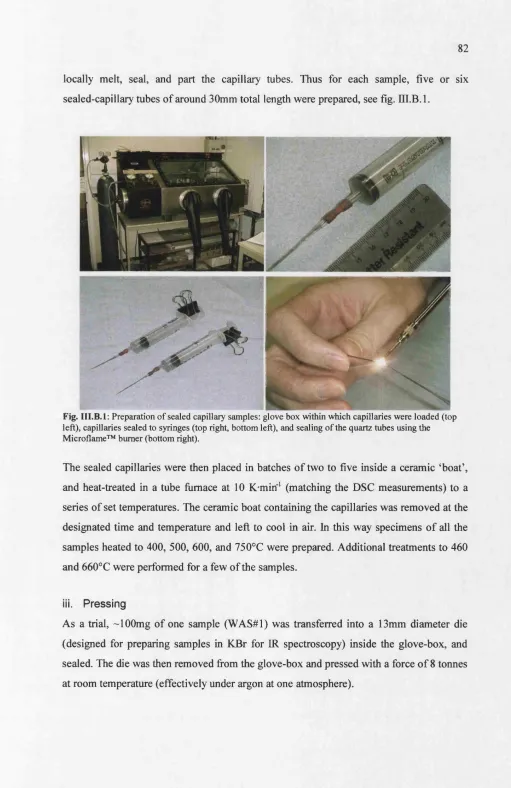
ii. Details of the capillary processing procedure ...81
iii. Pressing ... 82
3. Analysis techniques ...83
i. Atomic Absorption spectroscopy (AA) ... 83
ii. Energy Dispersive Analysis by X-rays (EDAX) ...84
iii. Electron Microprobe line analysis ... 85
iv. Inductively Coupled Plasma Spectroscopy (ICP) ...85
V. Differential Scanning Calorimetry (DSC) ...85
vi. M ôssbauer Spectroscopy ... 86
ix. Vibrating Sam ple M agnetometer (VSM) ...94
X. AC hysteresis looper ...95
C. R e s u lts ...98
1. Sam ples studied ...96
2. Sam ple general characterisation ... 100
i. GDF5631 FeZrB, 4.5:1 Fe:Zr ... 101
ii. GDF5641 FeZrB, 18:1 F e :Z r ... 102
iii. GDF5741 FeZrB, 9:1 Fe:Zr, (reverse mixing) ... 103
iv. GDF5751 FeZrB, 9:1 Fe:Zr ... 104
V. GDF6481 FeZrB, 9:1 F e :Z r ... 105
Vi. GDF6531 FeZrB, 9:1 Fe:Zr ... 106
vii. WAS#1 FeZrB, 9:1 F e :Z r ... 107
viii. GDF5761 FeB ... 108
ix. GDF5881 FeCoB, 9:1 Fe:Co ... 109
X. ‘B2’ FeZrB melt-spun ribbon ... 110
xi. 'B6' FeZrBCu melt-spun ribbon ... I l l 3. M ôssbauer spectroscopy ... 112
i. As-prepared sam ples ... 112
ii. Post heat-treated ... 117
4. XRD ... 120
i. Empty capillary pattern ... 120
ii. Thermally-induced crystallisation ... 120
iii. Crystallisation - grain growth ... 125
iv. Search-m atch results ... 127
V. Anomalous XRD ... 128
5. EXAFS ... 132
6. Electron microprobe ... 136
7. VSM ... 137
D. Discussions ... 138
1. Overview ... 138
2. Prior interpretation ... 139
3. New investigations ... 139
4. Main findings of the present study ... 140
5. ICP a n a ly s is ... 142
6. VSM ... 143
7. DSC ... 144
10. Sample by sam ple discussion ... 149
i. GDF6481 and GDF6531 - FeZrB ... 149
ii. GDF5751 - FeZrB ... 150
iii. GDF5631 and GDF5641 - FeZrB ... 150
iv. WAS#1 ... 151
V. GDF5761 - FeB ... 151
vi. GDF5741 - FeZrB (salts solution added to borohydride) ... 152
vii. GDF5881 - FeCoB ... 153
viii. Melt spun ribbons 'B2' and 'B6' ... 153
11. Chemistry ... 153
E. Conclusions ... 155
IV. References ... 159
V. Appendices ... 165
A. Publications and Conferences ... 165
1. Publications arising from the current work... 165
2. Conferences attended ... 165
B. CIP software instruction manual ... 166
Fig. n.B. 1 BaFBr phosphor X-ray absorption efBciency versus stimulation energy 17 Fig. n.B.2 Storage phosphor image fade, experimental results 18
Fig. n.B.3 CIP camera hardware, photograph 18
Fig. n.B.4 GIF camera semi-transparent beamstop cross section 20
Fig. n.B.5 General arrangement drawing of CIP camera 21
Fig. n.C. 1 Dif&actogram recorded by image-plate; input data for processing software 23 Fig. n.C.2 Time-resolved dif&action pattern strip exposures 23 Fig. n.C.3 CIP camera data processing; geometric construction 26 Fig. n.C.4 Flat-plate data processing; geometric construction 31 Fig. n.C.S Grid mask used for scanner spatial distortion characterisation 34 Fig. n.C.6 Typical Phosphorlmager 400 spatial distortion characteristics 34 Fig. n.C.7 Representation of possible misleading beamspot images 39 Fig. n.C.8 Considerations for horizontal extent of image plate data actually processed 40 Fig. n.C.9 Software: integration parameters control panel 42 Fig. n.C.lO Software: visual appearance, showing raw image, beam spot origin, region selected 43
for integration, and integrated one-dimensional diffraction pattern
Fig. n.D. 1 X-ray flux as a function of monochromator wavelength on station 9.1, and effect of 48 transmission through polycarbonate sheet
Fig. n.D.2 X-ray absorption of clear and black polycarbonate sheeting, vs. wavelength 49
Fig. n.F. 1 Bede microsouRCE™ and synchrotron radiation comparison of raw diffractograms o f 54 tetracycline hydrochloride obtained with the CIP camera
Fig. in A. 1 Characteristics of a ferromagnetic hysteresis loop 60 Fig. in.A.2 Melt-spinning process, product and equipment 63 Fig. in.A.3 Phase field for Fe-Zr-B alloys produced by melt-spinning 67 Fig. in.A.4 Grain size dependence of coercivity in iron alloys 69 Fig. niA.5 SEM images of a representative chemically synthesised Fe-Zr-B sample 76
Fig. m.B. 1 Preparation of sealed capillary samples for diffraction measurements 82 Fig. m.B.2 Schematic representation of atomic absorption spectrophotometer 83
Fig. m.B.3 Origins of Môssbauer spectra 87
Fig. m.B.4 Schematic representation of Môssbauer spectrometer 88 Fig. m.B.5 X-ray diffractogram fi"om CIP camera, emphasising low noise and wide dynamic 90
range
Fig. m.B.6 Example of anomalous diffraction data 93
Fig. in.C. 1 Dif&action pattern of empty quartz capillary tube 120 Fig. in.C.2 Dif&action patterns for all samples after heating to 400"'C 121 Fig. in.C.3 Dif&action patterns for all samples after crystallisation following heating to 500®C 122 Fig. in.C.4 Dif&action patterns for some samples after heating to mid-exotherm, 460°C 123 Fig. in.C.5 Full temperature series of XRD patterns for a chemically-produced Fe-Zr-B sample 124 Fig. in.C.6 Iron crystallite size growth as a function of temperature, from dif&action data 125 Fig. in.C.7 Anomalous XRD for a sample heated to 750°C, highlighting ZrO^ phases 129 Fig. ni.C.8 Anomalous dif&action pattern for a chemically-precipitated sample made by a 130
different procedure, following crystallisation by heating to 750®C
Fig. in.C.9 Anomalous dif&action pattern for an as-produced chemically-precipitated sample 130 Fig. m.C.lO Anomalous XRD for a melt-spun ribbon before and after heating to 600®C 131
Fig. in.C. 11 Zr-edge EXAFS raw data 132
Fig. m.C.12 Reciprocal space Zr-edge EXAFS, data and fit 134 Fig. ni.C. 13 Radial distribution functions for selected samples, at different stages of 135
crystallisation obtained by EXAFS
Fig. ni.C.14 Distribution of Fe:Zr ratio on a 1pm scale in selected chemically prepared samples 136 Fig. IU.C. 15 Hysteresis loops for two samples after crystallisation at 500°C 137 Fig. m.C.16 Hysteresis loops for two samples after crystallisation at 600®C 137
Fig. m j ) . 1 Decrease oflCP-AES analyte recovery with increasing zirconium content o f sample 143 Fig. in.D.2 Dif&action patterns showing disappearance of SAXS peak with onset of zirconium 146
oxide crystallisation
Fig. m.D.3 Boron-content dependence of hyperftne field and isomer shift MOssbauer parameters 148 in amorphous iron-boron alloys
Fig. m.D.4 Hyperfine field and isomer shift correlation for amorphous component of samples 149 Fig. m.D.5 Dif&action patterns of GDF6481 and 6531 after heating to 750®C 150 Fig. m.D.6 Dif&action patterns of GDF5751 after heating to 750®C 150 Fig. m.D.7 Formation of iron-borides in GDF5761 binary Fe-B alloy as a result of thermal 152
processing
Table Ü.B. 1 20 and reciprocal space coverage o f the two radii CIP camera arcs 19
Table U.E.1 Experimentally-determined precision and accuracy of GIF camera 28 scale Table II.E.2 Comparative accuracy of structure refinement of tetracycline hydrochloride
dif&action patterns fi*om CIP camera and conventional diffractometer
51 52
Table El.A. 1 Ferromagnetic amorphous alloy classification
Table niA.2 Properties o f some specific melt-spun amorphous and nanocrystalline alloys
65 66
Table m.C. 1 Iron alloy samples selected for this study Table m.C.2 Phases detected in diffraction data Table in.C.3 Key to notation in previous table
Table m.C.4 Typical interatomic spacings for various zirconium environments
99
127 128 133
Table III.D. 1 Summary of ICP analysis of the samples 142
Table m.D.2 Summary of the measured coercivity and maximum magnetisation of the samples 143
Table III.D.3 Môssbauer parameters for various species 147
Table m.D.4 Môssbauer parameters of the amorphous component in the as-prepared samples 148
Acknowledgements
I would like to begin by thanking my supervisors. Prof. John Finney and Dr Quentin
Pankhurst for their guidance, patience and support in the course of this work.
Particular thanks are also due to Dr Mark Roberts, formerly a postdoctorate researcher at
UCL and now station scientist on beamline 9.1 at Daresbuiy, who aquainted me with the
practicalities of the CIP system at the start of this project, and provided invaluable help at
Daresbury Laboratory. Thanks also to Dr Graham Bushnell-Wye, former station scientist
on 9.1 and co-founder member o f the CIP project, for his assistance at Daresbuiy. Thanks
to Dr Scott Belmonte of Edinburgh University for his willing advice and insider
knowledge on image-plate issues, and all the others who gave professional or moral
support at Daresbury and helped make the long days and nights just a little more bearable.
Special thanks are due to Dr Luis Femândez Barquin and Dr Glyn Forster, predecessors
on the chemical-reduction project, who both willingly participated in discussions and
offered advice despite having moved on to pastures new. The assistance of Kevin Reeves,
with atomic absorption, SEM and EDAX measurements within UCL Archaeology, and
Dr Neil Cohen and Dr Marianne Odlyha o f the ULIRS Thermal Methods service with the
DSC characterisation is gratefully acknowledged. Thank you to Dr Ian Harvey and
Dr Fred Mosselmans for practical help on the EXAFS beamline, and Dr Dave Gleeson of
the Royal Institution of Great Britain for subsequent help with the data analysis.
I am grateful for the help, encouragement and interesting side-tracks and distractions
provided by my fellow students in CMMP, especially Daniel Ucko who got me started
with (and valiantly maintained) the VSM and Môssbauer equipment in the lab at UCL,
and Louise Affleck for always being cool headed, willing to help, and a model of
conscientiousness as an example to us all!
Finally I’d like to thank my parents, for their ever-present love, support and
encouragement.
I. Introduction
1. Background
Throughout the 20th century there has been steady technological drive and evolution
towards making harder permanent magnets and softer soft-magnetic materials. Initial
improvements were made by refining the composition of traditional alloys. Established
magnetic lore maintained that materials with small grain sizes are hard, while large grain
sizes and high-purity metals lead to soft materials. Twenty years or more ago there was a
lot of interest in amorphous metal alloys exhibiting good soft-magnetic properties. In
1988 it was then discovered that when annealed, some of these iron-based alloys
developed a nano-scale grain structure which improved their magnetic saturation and
decreased their coercivity further still [Yoshizawae/ al 1988a]. Similar nanocrystalline
alloys have since extended the observable range of coercivity at both ends of the scale,
leading to unprecedented extremes of softness (FeZrB) and hardness (FeNdB) [Herzer
1997]. This surprising result has led to much applied as well as fundamental interest.
2. Formation of nanocrystalline m agnetic alloys
Nanociystalline materials of magnetic interest are commonly made by thermally-induced
partial crystallisation of an amorphous precursor alloy and the dynamics o f the
crystallisation is critically dependent on the exact composition. Yoshizawa’s original
alloys lay in the region of Fe^ggCu^Nb^Sii^^Bg. Amorphous alloys are inherently
thermodynamically unstable, the crystalline state being favoured, so special procedures
have to be used to fabricate them. One well-established process is known as melt-
spirming, and involves cooling the molten metal alloy at very high rates by trickling it
onto a cold rotating copper wheel to draw off a ribbon of the material. Although very
successful, there are limitations to the alloy compositions which form a single-phase melt
and can be cooled without crystallisation, and the product is constrained to a ribbon form
typically a mere 20pm thick. The latter restriction is of particular significance to
applications engineers, who would prefer a bulk material (although progress has been
made in compacting powdered ribbons [for example, Kojima et al 1995, 1996a&6]),
while the former is universally finstrating, especially given that the most promising alloys
3. Chemical reduction synthesis of am orphous alloys
It was discovered in 1986 that the long-known borohydride-reduction reaction of
metal-salts in aqueous solution can, under the right conditions, lead directly to an
amorphous product such as Fe-B or Fe-Co-B [Wonterghem et al 1986]. This approach
has since been investigated further, by many including Inoue’s group in Japan [e.g. Inoue
et al 1988] who are renowned for their work on amorphous alloys prepared by other
techniques, Linderoth and Morup in Denmark who have performed many studies of the
reaction conditions [e.g. Wells et al 1989, Linderoth et al 1990a&6], and at UCL
[Femândez Barquin et al 1999, Forster et al \999a-d\. Ternary Fe-M-B alloys
(M = Ni,Co,Mn) have been widely reported, while the UCL group has explored extending
the synthesis to Fe-Zr-B.
Between 1994 and 1998, Dr Luis Femândez Barquin and Dr Glyn Forster worked on
practical aspects of the chemical reduction synthesis of various alloys, including
iron-zirconium-boron, aiming to establish the experimental parameters required to
generate samples which were either totally amorphous, or contained a very large
amorphous fraction. When Forster departed, he left around thirty Fe-Zr-B samples which
were mainly amorphous, together with varying amounts of characterisation data on each.
Following the more recently-observed nanocrystalline state of FOgg^g^Zr^^B^^ alloys
[Suzuki et al 1990, 1991] produced by melt-spirming, the UCL group has become
particularly interested in researching the crystallisation behaviour of its chemically-
produced Fe-Zr-B samples. I set about this characterisation, in the hope, ultimately, of
inducing a magnetically soft nanocrystalline state.
4. Properties and characterisation
In the chemically-produced powder we are interested to know just what fraction of the
material is initially amorphous and, if present, what the contaminant phases are and some
idea of how much of each is present. Both Môssbauer spectroscopy and X-ray diffraction
(XRD) are useful for this purpose. We require a determination of the atomic composition
(empirical formula) of the alloys, since this is not directly governed by the reactant
amounts; atomic absorption and atomic emission spectroscopy provide this measure.
Differential scanning calorimetry can be used to highlight key crystallisation temperatures
hysteresis loops can be recorded for the samples using a vibrating-sample magnetometer,
and the saturation magnetisation ( a ^ and coercivity % ) derived. Post-heating,
diffraction is the primary tool for identifying partially- or fully-crystallised phases, both
wanted and contaminant, and indicating the size of those crystals. A complication is that
the fine particle samples are highly prone to oxidation in air, and some are pyrophoric.
One overriding constraint was that in most cases the quantity o f each sample available
was only 1-2 grams. Although reproducibility improved greatly as Forster progressed, the
chemical process did not mature to the state o f being able to duplicate samples
indistinguishably within the resolution of all analyses. Consequently the possibility of
making up another batch to continue measurements as the samples ran out was not a
viable option. To ensure self-consistency, all measurements had to be made from one
existing batch, or else a completely new batch would have to be made and fully analysed,
with all the time delays that entails.
In terms of sample amount required, Môssbauer and conventional X-ray diffraction would
be the most expensive techniques, especially if analysing samples quenched after
numerous stages of annealing. For the post-annealed samples, the demands placed on the
XRD instrumentation are veiy great. The combination of the strong signal from the
ciystalline or semi-crystalline iron and the very weak signal from small bulk-fraction
unknown impurity phases leads to a diffraction pattern with an extremely h i ^ dynamic
range.
In common, perhaps, with other kinds of new-materials research, we find a demand for
XRD equipment capable of giving good X-ray patterns from very small quantities of
sample, with good counting statistics and ability to handle a high dynamic range. Given
the complexity of the multiphase patterns arising from these samples, ideally we also seek
complete avoidance of splitting and Kp radiation associated with conventional
X-ray tubes. In such cases, synchrotron X-rays are advantageous, exhibiting very high
intensity, and capable of producing beams of a pure monochromatic wavelength.
Two-dimensional ‘area’ detectors, provided they have enough resolution to be useful,
offer much better counting statistics than conventional one-dimensional or even
5. CIP XRD cam era
Conveniently, when I began my PhD studies. Professor Finney and his team were working
on a Debye-Scherrer X-ray diffraction camera using a curved image-plate detector for use
on synchrotron beamline 9.1, at Daresbury Laboratory [Roberts et al 1998]. This project
was at a mature stage, and had already yielded many promising results. Diffraction
patterns with superb statistics could be obtained from a few milligrams of material with
exposures as short as 15 minutes, making it ideal for batch analysis. Nevertheless, there
were ongoing difficulties vdth the data-processing software and some outstanding issues
to be solved Avith spatial calibration, alignment, and general commissioning, before the
camera could become a fully-fhnctional research tool or ‘user’ facility. Despite these
initial problems, the camera set-up held great potential for my materials work.
I spent most of my first year with the camera development team writing a new software
package to process the data from the Curved Image Plate (CIP) camera, carrying out
investigations into the causes of the geometrical errors and devising operational
procedures and software code to eliminate them. This involved monthly visits to the
Daresbury synchrotron, and a wide variety of sample-types were used during this testing
phase. At the end of this period, the resulting camera and software system provided X-ray
facilities of the kind ideally suited for the structural aspects of the project.
6. Summary
My project was to perform detailed characterisation of the nature of the existing
chemically precipitated iron-zirconium-boron samples, and investigate their crystallisation
behaviour with a view to possibly inducing a nanocrystalline state. Comparisons were to
be made with ribbon-based samples, both by reference to published characterisation and
some new measurements. Materials characterisation involves a large number of analysis
techniques of which X-ray diffraction forms a very major part. Owing to the special
requirements of my samples, and the software and instrumentation skills I could offer, I
spent most of my first year helping to bring the Curved Image Plate project at Daresbuiy
to completion. This gave me valuable experience so that once I started my materials
II.CIP camera development
A. Introduction
In response to the emerging technology of storage-phosphor imaging systems coupled
with growing demand for high-resolution X-ray diffraction facilities, the Curved Image
Plate camera idea was conceived in 1995. The then Station Manager o f beamline 9.1 at
the Daresbuiy Synchrotron Radiation Source, Dr Graham Bushnell-Wye, and Prof. John
Finney proposed that a Debye-Scherrer type camera using a storage phosphor detector be
designed, built, and tested. When using a conventional stepping-mode powder
diffractometer on the beamline, even with the synchrotron X-rays, exposures of many
hours were often required for weak-scattering and complex organic samples. By
cumulatively recording diffraction at all angles simultaneously, a ‘camera’ type (area)
detector would obviously be intrinsically more efficient. It was anticipated that an
image-plate based camera system would increase the station throughput for a relatively
low capital outlay. The issue was whether such as system would be both practical to use
and exhibit sufficient spatial and intensity accuracy to be of use as a research instrument.
Given that the raw output is an image-file, software was to be written to convert the
pattern to a more conventional intensity versus 20 dataset for analysis. A leading
high-pressure research group working with tiny samples in diamond-anvil cells on the
beamline had already been using flat phosphor screens, since 1991, with extremely
encouraging results [Nelmes et al 1992].
When I first joined the team the CIP project was at an advanced stage o f development
[Roberts et al 1998], and many problems had already been overcome. Even so, the
limitations of their existing software, a customised offshoot of a flat-plate program, were
becoming increasingly apparent. I made it my task to improve the modes of operation and
calibration procedures, and write a new software package to enable data of the highest
B. System overview
1. Image plate technology
Imaging plates are métal or plastic sheets coated with a thin (-150pm) coating of a
barium fluorohalide BaFBrJi.^:Eu storage phosphor. The principle of operation is that
exposure to short-wave radiation (370nm ultraviolet down to X-rays, gamma rays and
beta particles) causes the ionisation of Eu^^ sites in the phosphor to Eu^^ and the liberated
electrons in the conduction band become trapped at metastable F^-centres. At some later
time, exposure to visible red light frees the electrons from the F-centres which in turn
convert the Eu^^ sites back to Eu^% with the emission of photons in the blue region of the
visible spectrum (photostimulated luminescence). A special-purpose scanner can be used
to read an image from the plate by sweeping a red helium neon laser beam across the
entire surface of the plate in a raster pattern, while a photomultiplier tube, suitably
filtered, detects emitted blue photons. After use, the plate can be completely erased by
exposure to broad-band visible light (though it is the red components that are active), then
reused. Since the process of ionising Eu sites and trapping electrons is completely
reversible, the useful life of the plate is limited only by mechanical wear-and-tear
[Miyahara et al 1986].
Storage phosphor imaging technology was first demonstrated by Kodak in the 1970s
[Luckey 1975], and medical applications were foreseen. In the mid-1980s, there was a
limited interest in applying image-plate screens to diffraction applications with
synchrotron radiation [Miyahara et al 1986]. Up until this time, ‘dumb’ scanners were
used to copy the image from the plate onto conventional photographic film for storage and
diagnosis or analysis. Computer-based scanners (still primarily marketed for medical and
biological applications) introduced in the late 1980s really opened up the larger scale
exploitation of the image-plates, and interest from the diffraction community grew [for
example, Whiting et al 1988].
For applications, the plate can be used like photographic film in as much as it is a passive
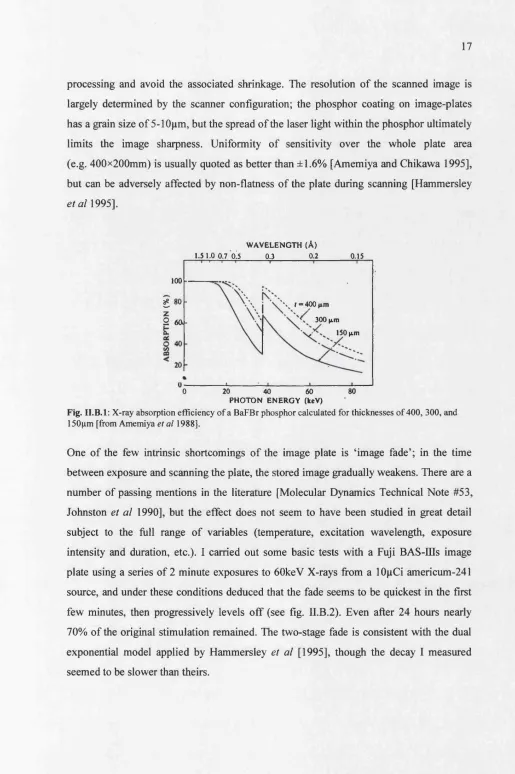
device. By contrast though, it has a very high absorption efficiency (see fig. 11.B.1) and is
consequently many times more sensitive than film (lOx to 250x depending on the
application and method of estimation) and has a practically linear response to X-ray
processing and avoid the associated shrinkage. The resolution of the scanned image is
largely determined by the scanner configuration; the phosphor coating on image-plates
has a grain size of 5-10pm, but the spread of the laser light within the phosphor ultimately
limits the image sharpness. Uniformity of sensitivity over the whole plate area
(e.g. 400x200mm) is usually quoted as better than ±1.6% [Amemiya and Chikawa 1995],
but can be adversely affected by non-flatness of the plate during scanning [Hammersley
^/ûr/1995].
WAVELENGTH (Â)
1.51.0 0.7 o!s 0.3 0.2 0.15
100
t, ■
2
6a-( “ 400 fini 300 (tin
150 iim
20 80
0 40
PHOTON ENERGY (keV)
60
Fig. II.B.l: X-ray absorption efficiency of a BaFBr phosphor calculated for thicknesses o f400, 300, and 150pm [from Amemiya etal 1988].
One of the few intrinsic shortcomings of the image plate is ‘image fade’; in the time
between exposure and scanning the plate, the stored image gradually weakens. There are a
number of passing mentions in the literature [Molecular Dynamics Technical Note #53,
Johnston et al 1990], but the effect does not seem to have been studied in great detail
subject to the full range of variables (temperature, excitation wavelength, exposure
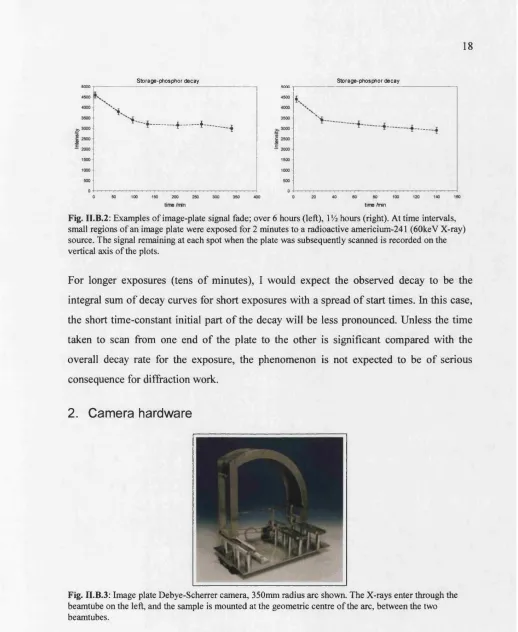
intensity and duration, etc.). I carried out some basic tests with a Fuji BAS-IUs image
plate using a series of 2 minute exposures to 60keV X-rays from a lOpCi americum-241
source, and under these conditions deduced that the fade seems to be quickest in the first
few minutes, then progressively levels off (see fig. U.B.2). Even after 24 hours nearly
70% of the original stimulation remained. The two-stage fade is consistent vrith the dual
exponential model applied by Hammersley et al [1995], though the decay I measured
Sto rage-phosphor d ecay
^ ^
-t
S to rag e-phosphor d ecay
time /trtn
Fig. II.B.2; Examples of image-plate signal fade; over 6 hours (left), VA hours (right). At time intervals, small regions of an image plate were exposed for 2 minutes to a radioactive americium-241 (60keV X-ray) source. The signal remaining at each spot when the plate was subsequently scaimed is recorded on the vertical axis of the plots.
For longer exposures (tens of minutes), I would expect the observed decay to be the
integral sum of decay curves for short exposures with a spread of start times. In this case,
the short time-constant initial part of the decay will be less pronounced. Unless the time
taken to scan from one end of the plate to the other is significant compared with the
overall decay rate for the exposure, the phenomenon is not expected to be of serious
consequence for diffraction work.
2. Cam era hardware
Fig. n.B.3: Image plate Debye-Scherrer camera, 350mm radius arc shown. The X-rays enter through the beamtube on the left, and the sample is mounted at the geometric centre of the arc, between the two beamtubes.
The existing imaging-plate reader system (Molecular Dynamics Phosphorlmager 400)
scans areas up to 400mm long with a fixed resolution of either 176 or 88pm, so the choice
of camera radius is a trade-off between angular coverage and angular resolution. The
combination of X-ray wavelength and the angular coverage will determine the ^/-spacing
practical dimensions, reciprocal-space ranges, and sufficient resolution could be achieved
using wavelengths in the region of 0.5Â in conjunction with camera radii of a few
hundred millimetres. At that wavelength air absorption is practically negligible, at only
2-3% over distances of 0,5m. Two radii arcs were settled upon: 350 and 185mm, offering
coverage from 0° to 64° and 0° to 120° in 20 respectively (see table II.B.1). Owing to
shadowing by beamtubes the minimum useful 20 is approximately 2°.
Arc Maximum Equivalent step size at0.4868À at 0.6920Â
radius 28 88pm scan 176pm scan m int//Â max Q /A'* mine//A max Q /A'*
350mm 64° 0.014° 0.028° 0.46 14 0.67 9.5
185mm 120° 0.027° 0.055° 0.28 22 0.40 16
Table II.B.1; CIP camera radii characteristics
It was envisaged that the larger arc be used for high-resolution crystalline powder studies,
while the smaller one would find ^plication in the study of liquids and amorphous
materials.
Considerations for the width of the plate are less straightforward. Clearly a wider plate
will intersect greater fractions of the Debye-Scherrer cones, but beyond a certain width the
usefulness o f these data becomes limited by the geometrical alignment and spatial
accuracy (discussed in more detail later) of every component in the camera, scaimer, and
analysis software. In practice, the physical layout of the X-ray hutch at station 9.1 at
Daresbury proved the ultimate constraint — there is only 75mm between the X-ray beam
and the hutch wall which runs parallel to it. A full width of 150mm was chosen to permit
patterns symmetrical about the beam to be recorded.
The image plate is supported by a black polycarbonate sheet (optically opaque, but
assumed X-ray transparent), itself maintained in the required shape by grooves milled in
the surrounding alum inium frame.
To absorb X-rays scattered out of the direct beam by the air, which would otherwise fog
the image, the camera is designed so that the incident X-ray beam (and the beam which
passes non-diffracted through the sample) passes down the centre of stainless steel tubes.
The beamstop (see fig. n.B.4), situated at the end of the beamtube and immediately in
intensity to penetrate. In this way, a geometrical beam-spot reference is marked on the
image.
X-ray beam
f~~| brass 0 lead
6mm
insert diameter
\ f
Fig. II.B.4: Cross-section representation of the beamstop.
There is sufficient space in the centre of the camera for even a quite bulky furnace, for
on-line annealing studies. An attachment is also available to support an Oxford
Instruments Cryostream device, for low-temperature studies.
For time-resolved studies there is also an option to use the camera in ‘translation mode’.
A static mask consisting of a molybdenum sheet with a 4mm wide slit supported on an
aluminium frame is fitted in front of the image-plate arc, and at time intervals the
image-plate behind it is translated horizontally (perpendicular to the beam) by means of a
computer-controlled motor. In this way, a series of narrow strip exposures can be made on
one image-plate. Although very convenient, because the area of image-plate exposed is so
small, the statistical quality of the data thus obtained is considerably less good than for
standard full-plate exposures.
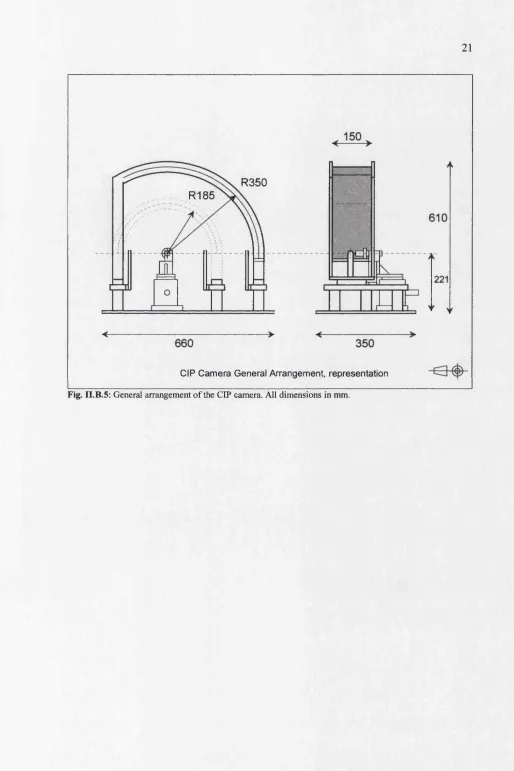
The final prototype consists of a base and translation stages, and the two camera arcs
R350 R185
CIP Camera General Arrangement, representation
3. Outline of operating procedures
Typically the sample is loaded into a 0.5mm glass capillaiy tube. It is then fixed onto the
goniometer pip using wax, a ‘leveller’ is used to sight the capillary in order to adjust the
goniometer until it runs true (a skill which improves with practice). The image-plate is
loaded into the camera under ambient illumination, and the hutch locked. On Wiggler
beamline 9.1 at Daresbury, exposures ranging from 5 minutes (crystalline, strong
scatterer) to several hours (amorphous/organics) are typical. After exposure in the camera,
the image plate is removed from the camera in darkness, covered (I observed that 30
seconds of typical room lighting will erase 90% of the signal), and taken to the
Phosphorlmager 400 reader. Plates can be scarmed at two resolutions, with pixel sizes of
176pm or 88pm. hnageQuant software on the reader is used to initialise the scan which
takes 5 minutes for low-resolution scans or about 18 minutes for high. The image is
displayed on the screen after scanning and simple spot-checks can be performed at that
stage. The scanning software outputs a .gel file, which is essentially a two-dimensional
dataset of the image from the phosphor screen.
In general the image is then transferred to another computer for archival and processing.
On this computer, software is used to ‘integrate’ the pattern, yielding a simple dataset of
intensity versus 20 (or d, or Q). This form may be an end result in itself, or can be used as
the starting point for more advanced techniques such as structure refinement.
In practice, two main types of calibration have to be performed periodically: distortions in
the scanner are recorded by scanning an image plate which has been exposed through a
mask bearing a square grid of holes. The alignment of the camera is then adjusted and
calibrated by using a silicon reference standard sample and comparing the measured
C. Data pre-processing Software
Fig. II.C.1; Source data; full-plate dif&action exposure, 2280x896 pixels (Fe-Zr-B phases, 350mm camera)
Fig. II.C.2: Source data; series of strip exposures obtained with &anslation stage (crystallisation of an Fe-Ag-Cu alloy as temperature raised at 5°C-min'')
1. Introduction
There is a gamut of software in the crystallography community to aid the analysis of
powder-diffraction data supplied in the one dimensional form of intensity versus 20
scattering angle, as obtained by conventional coimting diffractometers. Such programs
include Rietveld structure refinement and search-match routines for basic
phase-identification. Consequently there is a requirement for a computer program to
pre-process the X-ray intensity data from the two-dimensional image-plate scan (see
fig. n.C.l and fig. n.C.2), converting it to a conventional one-dimensional array for
subsequent analysis. Knowing the geometrical arrangement of the diffractometer, a
program should be able to integrate intensities around the Debye-Scherrer rings, taking
into account losses due to geometrical and polarisation effects. By utilising data from the
whole of the plate, the signal-to-noise ratio is maximised.
While working with Prof. Nelmes’ group at Daresbury, Dr Ross Piltz wrote such a
pre-process dif&action patterns of samples contained within high-pressure diamond anvil
cells. On departure from Nelmes’ group, Piltz worked briefly with the CIP team and
developed an offshoot of his previous software to work with the curved plate geometry.
As the CIP camera hardware progressed, the limitations of this Platypus variant became
ever more apparent, particularly with respect to the calibration procedures. Given that the
present group had no access to the source code, the only option left has been to write a
new program.
No references were found in the literature for curved-plate image-processing, though the
basic geometry was expected to prove relatively straightforward. Some volume of
information exists for flat-plate configurations, from which many considerations (such as
direct beam position determination, rebinning approaches, and issues relating to the image
plate and scanner technology) are still applicable.
Piltz et al [1992] describe how the theoretical simplicity of processing the flat-plate
images is hampered by insufficiently accurate prior knowledge of the direction of the
incident X-ray beam relative to the image plane, and the position of the direct beam
within the image. They explain a method implemented in Platypus of breaking the image
up into 120 sectors, processing them individually, then varying the unknown parameters
until the combined dataset is maximally sharp. It appears that in these early days, the
direct beam was completely masked from the image plate, leaving a large uncertainty (a
few tens of pixels), in its position. Since then the Edinburgh group has adopted a
procedure of preceding the main exposure with a very short exposure without the
beamstop, enabling a permanent direct beam record to be preserved. The image plate is
usually orientated normal to the incident beam, and 1 am surprised that despite
experimental diligence they still report significant distortions in the image which are
attributed to alignment problems.
Dr Andrew Hammersley, at the ESRF, has worked on the characterisation of a number of
area detector technologies, including image-plates (in a flat configuration) and an X-ray
image intensifier/CCD camera detector. Image intensifiers are renowned for having very
large spatial distortions owing to convex surfaces and their particular electric field
geometries, while image plates might be expected to have no intrinsic distortions.
the image-plate scanner design (a similar type to that at Daresbury) can still lead to
scientifically-significant distortion of the image [Hammersley et al 1994]. He has
developed a general-purpose software program, FIT2D [Hammersley et al 1996], to
perform two-dimensional to one-dimensional data conversion, including detector
distortion correction, with high-pressure studies as the primaiy application. In the same
paper, Hammersley comments on the use of a semi-transparent beam-stop to aid centre
determination, discusses tilt corrections, and considers the merits of various re-binning
schemes.
In processing data jfrom the CIP camera, the image-plate tilt issues of flat plate work are
inapplicable. The CIP hardware ensures a repeatable and reliable orientation of the plate
relative to the beam. Instead a different error, which requires a different approach to
correction, arises when the sample is displaced from the geometric centre of the arc. One
of the problems with the curved-plate Platypus was that this sample-displacement
correction was applied post-integration, on the one-dimensional dataset. Since the
geometry is not rotationally symmetric about the X-ray beam, at this point some
information would have already been irrecoverably lost. Furthermore, the implied
resampling of the data at this late stage would have caused some degree of unnecessary
blurring of the entire dataset.
The work involved in writing a the new software package can be classified into four broad
areas: geometric methods, user interface, coding details, and user documentation. The
nature of the distortions caused by the scaimer and by sample-misalignment were not fully
appreciated at the outset, and required much investigation and complicated the coding
task.
2. Diffraction geom etry study
In order to ‘integrate’ (sum or average) the intensity o f Debye-Scherrer rings (arcs of
constant 20) from the image-plate, we need to convert between the (xj/) co-ordinate
system of the two-dimensional image plate scan and the 26 diffraction angle in
three-dimensional space. For compatibility with existing analysis software, the final
output dataset intensities are to be compensated so as to be equivalent to the raw dataset
existing software for ftirther analysis, such as structure refinement, usually implements
these factors if required.
Although this work was primarily carried out for Debye-Scherrer curved image-plate
detector geometry, it is a minor extension to be able to analyse a flat detector aligned
normal to the incident X-ray beam, and that working is also included for completeness.
i. Curved Image Plate
Fig. n.C.3: Geometrical construction for cylindrical image plate.
In the geometrical construction (fig. n.C.3) the image plate is represented by a cylinder of
radius r, with its axis lying in a horizontal plane, normal to the incident X-ray beam,
0 -0 ', and coincident with the axis of the capillary sample at O. For simplicity, let 0 ' be
the origin (0,0) of the (xj/) co-ordinate system of the detector, defined by the intersection
with the undeflected incident beam.
(j), is the vertical component of the angle subtended at O by pixel S relative to the incident
Thus
(|) = 7 (in radians).
Also the distance OQ of the pixel in front of the sample is given by
^ = rcos(j).
Also the absolute distance OS between the scatterer and a pixel at S is given by
s= Jx^ +r^ .
Now 20 can be defined in terms of s and q
20 = arccos^j) ,
and expanded back to base measurements
20 = arccos r cos (y/r) = arccos
f \
cos (y/r)
So we have now expressed the 20 scattering angle in terms of the radius of the camera
and the (x^y) co-ordinate of a pixel on the image-plate.
The next stage is to derive the intensity compensations for the geometry. There are two
factors here: the variation of scatterer-detector distance with x-coordinate on the image
plate, and polarisation effects. At the wavelengths used, the variations in air absorption
due to the path-length dependence on x can be neglected.
The solid angle, CO, subtended by a pixel at distance s directly facing the scatterer will
decrease in proportion to l/s^. Normalising to 1 for the primaiy scattering plane, x = 0,
(where s = r) gives
But for pixels lying on the cylinder with x ^ 0 the orientation of the pixel will not be
normal to the scattered radiation. The normal component is given by the cosine of the angle ROS, which is equivalent to j .
Thus the solid angle subtended by (or equivalently, intensity received by) any pixel on the
plate will be reduced, relative to that o f a pixel in the x = 0 plane, by a total factor
CO
=(f)
As a result of the cylindrical geometry, s is dependent only on x, so for speed in the
software a lookup table is pre-calculated for both s and (r/sf.
X-rays from a synchrotron source, such as station 9.1 at Daresbury, are essentially
horizontally polarised. Consequently there is negligible 20-dependent polarisation effect
for scattering recorded by a conventional stepping diffractometer operating in the vertical
plane, x = 0. In contrast, because of its significant vsddth much of the image plate data is
recorded with a horizontal component of scattering. Since the original requirement was
that the output dataset be equivalent to a set collected in x = 0 only, a correction is
required.
When considering polarisation effects in general, the intensity, /, scattered in a given
direction can be written
/ = 7 o ( P i +P//cos^26)
where P± and Pn are the Auctions of energy in the incident beam polarised perpendicular
and parallel to the plane of scattering o f interest.
Returning to our image-plate geometry, for an arbitrary pixel S lying in the scattering
plane OQS, to obtain components of the incident radiation polarised perpendicular and
parallel to the particular scattering plane, we use
P P /iorizCOS^V|f “h PygrfSm \j/
Pu = 1 - P}_
where
\|f = arctan
However, the arctan function is impractical in software since overflow and division-by-
zero errors will result when h is close to zero.
For the polarisation calculation we don’t actually require \|/ itself, but cos^ i|f and sin^ \|/.
Using Pythagoras’ theorem, these functions can be obtained directly, without recourse to
arctan, as shown:
s i n X I / = - p = = r c n s w = — — - .
Thus
where
A = rsin(|)
as before.
Again in the software, some speed advantage can be gained by using the identity
sin^ Y = 1-cos^ \|/, to save unnecessary calculations.
Sometimes it may be advantageous (see section n.6.i) to constrain the region of the image
plate used for integration according to some limit on \|f, such that IVI < . In turn, this
limits the range of jt, U I < Jfun,, used for any given row of pixels, as a function ofy. The
derivation of x as a function of y and \|/ is worked below, to complete this section on
Starting from
rearrange to make jc the subject
hsm\\r
X =
- s i n V
Substituting for h gives
^ 1 - sm v|/
From this, we can write the limits on jc as
y
%iim = ± C sin
-where C is a constant,
rsinv|/iim
C =
^l-sinViiiti
In practice, C , represents the half width of the sector where it intersects the cylindrical
ii. Flat plate
Fig. I1.C.4: Geometrical construction for flat image plate.
Similar, but slightly simpler, working can be applied to flat-plate geometiy (fig. II.C.4).
To obtain 20 for a pixel S at (x^) on an image plate at a distance r from the scatterer,
20 = arctan = arctan ^ = arctan J f f ) + (7)
For the geometrical intensity corrections we start by obtaining the source-detector
distance OS, using Pythagoras’ theorem:
s= +
-\-yP-In exactly the same way as for the cylindrical detector, the reduction in solid angle
subtended by any pixel relative to a pixel normal to the scatterer (at O'), is given by
In contrast to the curved plate geometry, because s now depends on y as well as jc, the correction cannot usefully be precalculated and stored in a lookup table in software.
Polarisation corrections are applied as for the curved plate, although now
5 JC^
COS^Y = -r .
JC^ + ) r
3. Sam ple m isplacem ent and other geom etric errors
Experimentally there is only a finite accuracy to which the sample can be aligned with the
geometric axis of the cylindrical detector. Given the design of the CIP camera, we assume
that any misplacement is reproducible on the scale of other unavoidable random errors,
fi*om sample to sample. For small displacements, such as 0.3% (0.5mm error with a
185mm radius camera arc), the error A20, between the 20 measured fi*om the direct beam
spot in the vertical plane (jc= 0) and the true 20, as a function of 2 0 is well approximated
by
A20 = - ^ ^ [ s i n(20 - a) + sina]
where u is the distance offset, and a is the direction (angle) of the offset measured in the
same plane as 20. The sin a term should be included only if the camera arc is displaced
too high or low relative to the beam - if the camera-beam alignment is correct, then this
term should be ignored. Klug and Alexander [1974] discuss general alignment errors in
Debye-Scherrer cameras, but note their assumption o f a detector film which is symmetric
above and below the beam.
Other errors include the effective radius differing fi*om the nominal radius and the slight
stretching of the phosphor surface of the image plate when it is flattened for scanning,
relative to the curved shape it takes within the camera. Both of these are invariant
between exposures and simple linear functions in 20.
In practice, given that the 20 range used by the CIP camera covers only 0° to 120° (0° to
64° for high-resolution exposures), a second-order polynomial fit based on a known
calibration sample, such as silicon powder, is found quite adequate to compensate for all
For pixels lying outside the jf = 0 plane, the full correction gets more complicated, being
primarily an issue in the low 20 portion of the data. On the line )/ = 0 on the detector, a
forwards/backwards sample m isalig n m e n t will lead to an error because the effective
sample-detector distance differs from that expected given the camera radius. A quick
numerical check reveals that for a worst case of a 1mm error in alignment with a 185mm
radius camera leads to a linear displacement of 380pm in diffracted peak position from
one pixel at jc= ±70mm, which translates to an error in 20 of 0.1°. More realistic figures
for the high precision arc, 350mm radius, with a 0.3mm sample offset, again at
JC = ±70mm gives a linear error on the image plate of 60pm, equivalent to a 29 error of
0.01° (cf. peak full width half maximum 0.07°). In reality this error would be expected to
fall further with the averaging over the fidl 180° of the Debye-Scherrer ring. Furthermore
it is not our common practice to integrate over the full width of the plate at low angles,
this being one of several reasons.
4. S can n er distortion characteristics
At the time when I joined, no-one in the CIP team really knew the extent or nature of
distortions in the scanner, though inherited wisdom and software led us to believe that
correction might be necessary. Early results with newly-written software which did not
apply calibrations verified that calibration most definitely was required.
A standard method of calibrating spatial distortions in area detectors is to expose the
detector to a known geometric pattern; analysis o f the resulting image enables the
distortion function to be derived. In the case of the image-plate scaimer, a pattern of
0.2mm diameter holes on a square 2.00mm spacing was appropriate.
The existing procedure had been to expose the image plate through a nickel mask using
back-scattered X-rays. Exposures of tens of minutes were required owing to the low X-ray
intensity, and inadequate mechanical fastening frequently caused the mask to lift away
from the detector. Furthermore, the image plate camera arc had to be temporarily removed
to permit the alternative X-ray configuration in the hutch.
I since discovered that some image plates (the Kodak brand, or the uncoated Fuji range
designed for a-particle detection) are highly sensitive to short-wave UV light. Even at a
of exciting the image plate to saturation in 30 seconds or less. Grid exposures have
subsequently been made using the UV torch instead. Owing to the vastly greater photon
count, convenience of not having to disrupt the X-ray set-up, and more controlled
mask-fastening this method is far more satisfactory.
Fig. II.C.5: Image plate and 2mm grid spatial calibration mask; left: close-up, right: in place for exposure.
The Phosphorlmager 400 scanner uses an oscillating galvanometer mirror arrangement to
scan the laser beam across the X-axis (short side) of the image plate, and traverses the
Y-axis (long dimension) of the plate by driving the plate carriage past the laser sweep by
means of wires and pulleys. We assume therefore that distortions in X and Y are
essentially independent. Characteristic distortions produced by this scanner are illustrated
in fig. n.C.6.
Scanner X-axis error rel. to a 172pm linear scale
Scanner Y-error rel. to a 176.3pm linear scale
400 300 200 E 100
200
100
-100 -100
-200 -300 -400
-200
-300
100 150 100 200
position /mm
300 400
position /mm
Fig. II.C.6: Typical Phosphorlmager 400 scanner spatial distortions.
The uncorrected X-distortion is quite large, deviating ±300pm from the best linear fit.
Though a fairly smooth function and reasonably constant over time; it does change
magnitude a little, which may be related to the scanner warming up after switching on, or
severe in absolute terms (± 100pm), but is fairly iiregular and contains an oscillatory
component which changes phase, and to some extent magnitude, over tens of scans. Not
too surprisingly, the period of the oscillations is roughly equal to the circumference of the
pulleys on which the wire runs to move the plate. I suspect the phase changes occur as the
wires creep relative to the plastic pulleys. The fact that the plate is pulled only from one
side probably doesn’t help.
Experience has shown that for consecutive scans, the Y-error typically correlates to within
10% (in other words, by using a grid scan to ‘correct’ a data scan, the residual error can be
reduced by up to an order of magnitude). After about 30 scans, correlation is about 50%,
that is, data corrected with a grid scaimed 30 scans earlier has about half the error
compared to no correction. More recently, I have discovered that the X-distortions and
scale change with time, the total scale changing by 0.5% within a few hours of scanner
switch-on, and continuing to fluctuate by a lesser amount thereafter.
Hammersley [1994] discusses similar scanner distortion characteristics, although his
scanner originally seemed to show even less repeatability in the Y-direction than ours. It
is possible that the manufacturers modified the drive mechanism at some point (these
scanners were early models), indeed Hammersley [1995] subsequently redesigned the
pulley system in his scanner and claimed to have reduced the error to ±20pm.
With the geometiy of the CIP camera, the Y-axis of the image-plate scanner runs along
the length of the Debye-Scherrer pattern while the X-axis crosses it. Owing to the strong
correlation between the Y-axis and resolved 20-angle, distortions along the Y-axis are
extremely undesirable. The effects of distortion in the X-axis are less immediately
obvious; the integrated peaks for low 20-angles will be broadened and their mean position
may be affected too.
Bearing in mind these points, it is now usual practice to make a new scanner calibration
every 15-20 scans, or at least twice a day. If the science particularly requires greater
5. User Interface considerations and implementation
Ultimately, the software is to be used by the visiting scientists (‘Users’) who spend one to
five days exposing their samples on the diffraction station. The programs need to be
intuitive and robust - not least because these users will have little time to get started, and
will often be working late into the night and when tired.
Given my extensive previous programming experience, this software was written to run in
Microsoft Windows 95/NT4, although a Unix/X-Windows solution would have been
equally acceptable.
Having made his/her diffraction exposures, the user needs to be able to view the image,
manually or automatically determine and specify the direct-beam centre, specify the arc
radius, define the region of the image to be included in the processing (originally just
rectangular, but now incorporating parallelograms and 3D sectors), perform the
integration and view the result. Means must be found to enable calibration files to be
made, and then incorporated in the processing. Given that as many as 40 exposures can be
made in 24 hours, and with many processing options available, it was found highly
desirable for all the generated files to maintain their own record o f the parameters and
calibration files used in their creation.
The apparatus will inevitably evolve, and any good piece of software will no doubt be
applied to set-ups and equipment other than that for which it was originally designed, so I
tried to make the whole structure as flexible as possible, without unduly sacrificing
usability. To this end I developed a suite of independent programs (which communicate
by means of machine- and human-readable intermediate files), as summarised below.
i. ‘CIP Analysis’
This program contains the core functionality. With CIP Analysis the user can open and
display the .gel image-plate image files, specify the camera radius (or flat-plate geometry),
select scanner and alignment calibration files to apply, perform the integration, then save
the resulting files o f intensity versus 20. It can also be used to generate intensity versus X
or Y files (linear averaging) which is useful for making scanner calibrations and general
ii. ‘Peaker*
Peaker enables the user to view the intensity versus 20, X or Y files in more detail, aided
by the ability to ‘zoom-in’ on parts of the pattern very swiftly. This program locates the
peaks in the pattern with sub-pixel interpolation, and then superimposes the centrelines on
the graph. A table of the peak positions can be saved. A list of known peak positions can
be opened, and displayed as marks along the bottom of the graph for comparison. To
calibrate the 20 scale for alignment errors, the difference in position of the peaks in the
pattern and in a reference file may be plotted and a second-order polynomial curve fitted.
iii. ‘ScannerCalib’
Reads in X- and Y- peak-position lists derived fi*om grid-scans, and generates a Scanner
Calibration lookup table file, assuming a 2.00mm source grid.
iv. ‘GEL Indexer*
A small, simple utility to generate an index of a collection of .gel files by extracting the
6. Coding details
i. ‘CIP Analysis’
CIP Analysis allows the user to open and view the .GEL image plate files, visually mark
up the direct beam position and region to use for integration, specify experimental
parameters, run the integration, then view and save the results.
The program was written so that the user identifies the direct-beam position to the
program by placing a set of crosshairs. With the lower resolution scans most commonly
used the beamspot image is typically 2 pixels high by 3 wide. Using the mouse pointer,
and nudging using the keyboard if required, this specifies the spot to a resolution of
1 pixel at best. For narrow integration regions, any small placement error in Y will give
rise only to zero-point errors in the processed data, while small errors in X have very little
effect at all. In the case of wide integration regions, where the horizontal component of
diffraction angle is appreciable, beamspot position errors will cause non-linear errors in
the 20 scale and blurring of low-angle rings.
There was some debate over whether sub-pixel beamspot location should be permitted, or
even if an automatic method could be used for fine-tuning. I dismissed such an idea as
potentially deceptive, implying a false level of accuracy, for two reasons. Firstly, the true
beamspot may be surrounded by a small cluster of ‘single crystal’ spots from the lead
beamstop itself. Secondly it was found that the shadowing effect of strongly absorbing
samples, if slightly too high or low displaces the apparent beamspot image, see fig. n.C.7.
Either of these effects could result in the beam location being inaccurately represented by
the centroid or brightest part of the spot on the image, confusing a software program.
Until hardware modifications are implemented which eliminate such risks, I believe it is
safer for the user to exercise their judgement and take responsibility for beamspot
location.
One interesting idea in the literature, applied to flat plate geometiy, is to use a Hough
transform to locate the centre of digitised diffraction patterns from the rings [Dammer
et al1997]. It appears doubtful that this method would be robust for the small firactions of
each Debye-Scherrer ring recorded in our geometry, for rings distorted due to strain, or be

![Fig. ni.A.4: Experimental data showing grain size dependence of coercivity in iron alloys [Herzer 1997].](https://thumb-us.123doks.com/thumbv2/123dok_us/8609970.1399678/70.595.28.543.26.813/fig-experimental-showing-grain-dependence-coercivity-alloys-herzer.webp)