International Journal in Management and Social Science (Impact Factor- 4.358)
Banking Sector Reforms in India: An Analysis
Dr. Deepak Kumar, (Asstt. Professor) L. N. Mishra College of Business Management
Bhagwanpur Chowk, Muzaffarpur - 842 001, (Bihar)
ABSTRACT
In current scenario, banking is the international issue reform in the financial sector covering banking, financial market and trade. It has been supporting to strengthen the fundamentals of Indian economy. Performance of banking sector has impact across the length and breadth of the economy. In order to control over the banking sector, the government of India had nationalized 14 major public sector banks with deposits exceeding Rs. 500 million in 1969. This had raised the number of scheduled bank branches under government to 84% from 31%. But the performance of public sector bank was increasingly becoming an area of concern. The continuous rise of Non-performing assets (NPAs) of banks posed a significant threat to the stability of the financial system. Hence banking reforms were made an integral part of the liberalization process. The financial sector reforms started in 1991 had provided the necessary platform for banking sector to operate on the basis of operational flexibility and functional autonomy that will lead to enhancement in productivity, efficiency and profitability. In this paper, there is an attempt to provide a brief description on performance of banking sector and impact of banking sector reforms in India,
Keywords: - Reform process, Reform measures, Impact of banking sector reforms, Capital adequacy norms.
Introduction
Commercial banking has been one of the oldest businesses in India and the earliest reference of commercial banking in India can be traced in the writings of Manu. Modern banking in India can be dated as far back as in 1786 with the establishment of General Bank of India. In the early nineteenth century three Presidency Banks were established in Bengal, Bombay and Madras and in 1921 they were merged in to newly form Imperial Bank of India. The Imperial Bank of India was converted in to State Bank of India under the State Bank of India Act, 1955. The swadeshi movement witnessed the birth of several indigenous banks such as Punjab National Bank, Bank of Baroda and Canara Bank.
In order to increase its control over the banking sector, the govt. of India had nationalized 14 major public sector banks with deposits exceeding Rs.500 million in 1969. This had raised the number of scheduled bank branches under govt. control to 84 percent from 31 percent. But the poor
performance of the public sector banks was increasingly becoming an area of concern. The continuous rise of non-performing assets (NPAs) of banks posed a significant threat to the stability of the financial system. Hence, banking reforms were made an integral part of the liberalization process. The financial sector reforms started in 1991 had provided the necessary platform for the banking sector to operate on the basis of operational flexibility and functional autonomy enhancing productivity, efficiency and profitability. While several committees have gone in to the problems of commercial banking in India, the two most important of them are-
International Journal in Management and Social Science (Impact Factor- 4.358)
Objective of the study
To study the factors affecting the functioning of an efficient banking system. To improve the growth rate of banking sector.
Literature Review
McGregor (1977) in his study discussed that management of spread, which is a potent tool for improving profit margins, could be achieved by maximizing net interest margin. The technique of spread management as shown in his analysis indicates the relationship between asset yield and liability cost.
Devatia and Venkatachalam (1978) in their study proposed a composite index which they believe would be able to investigate the efficiency of bank operations and profitability . The main element of this composite index are operational efficiency in terms of productivity, social objectives and profitablility.
Mishra(1993) in his study has described various factors which have a bearing on bank profitability. The study makes a detailed analysis of income and expenditure to underline the factors, which affect each aspect of income and expenditure, thus profitability.
Research Methodology
The study is based on secondary data. The data required for the study has been collected from R.B.I annual report, Journals, reports on trend and progress of banking of India, books and websites. This study covers a period of 1998-2005.
Reforms Process
The Narasimham Committee Report I aimed at bringing about “operational flexibility” and “functional autonomy” so as to enhance efficiency, productivity and profitability. The Narasimham Committee Report II focused on bringing structural changes so as to strengthen the banking system to make it more stable.
The Narasimham Committee had acknowledged the success of public sector banks in respect of branch expansion, deposit mobilization in household sector, priority sector lending and removal of regional disparities in banking. But during the post nationalization period, the banking sector suffered serious erosion in its efficiency and productivity. Moreover, the sound banking system has been disturbed by the system of directed credit operation in the form of subsidized credit flow in the under banked and priority areas, IRDP lending, loan festival, etc. According to the committee the operational expenditure of the public sector banks has tremendously increased due to rise in number of branches, poor supervision, rising staff level and high unit cost administering loan to the priority sector.
The major recommendations made by the Narasimham I committee report are listed below-
(1) Establishment of a four-tier hierarchy for the banking structure consisting of three to four large banks with SBI at the top.
(2) The private sector banks should be treated equally with the public sector banks and govt. should contemplate to nationalize any such banks.
(3) The ban on setting new banks in private sector should be lifted and the licensing policy in the branch expansion must be abolished.
(4) The govt. has to be more liberal in the expansion of foreign bank branches and also foreign operations of Indian banks should be rationalized.
International Journal in Management and Social Science (Impact Factor- 4.358)
(6) The directed credit program should be re-examined and the priority sector should be redefinedto comprise small and marginal farmers, the tiny industrial sector, small business operators and weaker sections.
In order to initiate the second generation of financial sector reforms a committee on Banking Sector Reforms (BIS) was formed in 1998 under the chairmanship of M. Narasimham. The committee submitted its report on 23rd April 1998 to the Finance Minister of Govt. of India. Narasimham committee report II had for mergers an acquisitions and had observed that Central Bank’s role should be separated from being monetary authority to that of regulator of the banking sector.
The major recommendations of the second Narasimham II report were mentioned below- (1) The committee favored the merger of strong public sector banks and closure of some weaker
banks if their rehabilitation was not possible.
(2) It recommended corrective measures like recapitalization is undertaken for weak banks and if required such banks should be closed down.
(3) The committee had also suggested an amicable golden handshake scheme for surplus banking sector staff.
(4) Suggesting a possible short term solution to weak banks, the report observed that the narrow banks could be allowed as a mean of facilitating their rehabilitation.
(5) Expressing concern over rising non-performing assets, the committee provided the idea of setting up an asset reconstruction fund to tackle the problem of huge non-performing assets (NPAs) of banks under public sector.
(6) The report emphasized the need of enhancement of capital adequacy norms from the present level of 8 percent but did not specify the amount to which it should be raised.
(7) The Banking Sector Reform Committee further suggested that existence of a healthy competition between public sector banks and private sector banks was essential.
(8) The report envisaged flow of capital to meet higher and unspecified levels of capital adequacy and reduction of targeted credit.
Measures for banking reforms
The banking sector reforms started in the early 1990s essentially followed a two pronged approach; first, the level of competition was gradually increased within the banking system while simultaneously introducing international best practices in prudential regulation supervision tailored to Indian requirements. In particular, special emphasis was placed on building up the risk management capabilities of Indian banks while measures were initiated to ensure flexibility, operational autonomy and competition in the banking sector. Secondly, active steps were initiated to improve the institutional arrangements like legal and technological frameworks. Some of the measures undertaken in this regard are as follows-
Measures for Competition Enhancing
Allowing operational autonomy and reduction of public ownership in public sector banks by raising capital from equity market up to 49 percent of paid up capital.
Transparent norms for entry of Indian private sector banks, foreign banks and joint venture banks.
Permission for foreign investment in the financial sector through foreign direct investment (FDI) as well as portfolio investment.
The banks are allowed to diversify product portfolio and business activities.
Roadmap for foreign banks and guidelines for mergers and amalgamation of private sector banks with other banks and NBFCs.
International Journal in Management and Social Science (Impact Factor- 4.358)
Measures enhancing role of market forces
Reduction in pre-emption through reserve requirement, market determined pricing for govt. securities, disbanding of administered interest rates and enhanced transparency and disclosure norms to facilitate market discipline.
Introduction of auction-based repos and reverse repos for short term liquidity management, facilitation of improved payments and settlement mechanism.
Significant advancement in dematerialization and markets for securitized assets are being developed.
Prudential measures
Introduction of international best practices norms on capital to risk asset ratio (CRAR) requirement, accounting, income recognition, provisioning and exposure.
Measures to strengthen risk management though recognition of different component of risk, assignment of risk weights to various asset classes, norms of connected lending, risk concentration, application of market to market principle for investment portfolio limits on deployment of fund in sensitive activities.
Introduction of capital charge for market risk, higher graded provisioning for NPAs, guidelines for ownership and governance, securitization and debt restructuring mechanism norms, etc.
Institutional and legal measures
Setting up of debt recovery tribunals, asset reconstruction companies, settlement advisory committees, corporate debt reconstructing mechanism, Lok-Adalat (people’s court), etc. for quick recovery of debts.
Promulgation of Securitization and Reconstruction of Financial Assets and Enforcement of Securities Interest (SARFAESI) Act, 2002 and its subsequent amendment to ensure creditor rights.
Reduction in pre-emption through reserve requirement, market determined pricing for govt. securities, disbanding of administered interest rates and enhanced transparency and disclosure norms to facilitate market discipline.
Introduction of auction-based repos and reverse repos for short term liquidity management, facilitation of improved payments and settlement mechanism.
Significant advancement in dematerialization and markets for securitized assets are being developed.
Impacts of reforms upon the banking industry
International Journal in Management and Social Science (Impact Factor- 4.358)
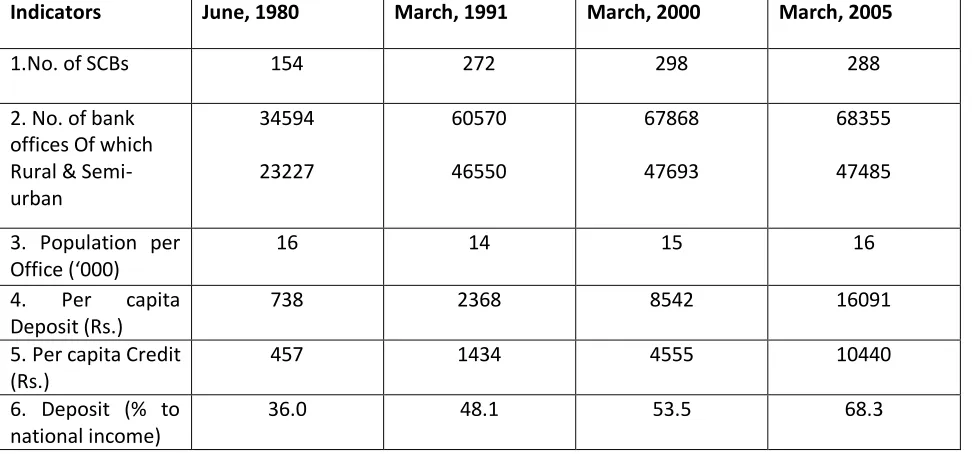
Table 1 : Progress of Scheduled Commercial Banks in India
Source:- : Report on Trend and Progress of Banking in India, various issues
Directed credit
Directed credit policies have been an important part of India’s financial sector reforms. Under the directed credit policy commercial banks are required to provide 40 percent of their commercial loans to the priority sectors which include agriculture, small-scale industry, small transport operators, artisans, etc. Within the aggregate ceiling there are various sub-ceilings for agriculture and also for loans to poverty related target groups. The Narasimham committee had recommended reduction of the directed credit to 10 percent from 40 percent. The committee had also suggested narrowing down the definition of priority sector to focus on small farmers and low income target groups.
The policy of 40 percent of loans to the priority sectors has not been abolished by the govt. However, the definition of the priority sector activities has been broadened with the new inclusion and reclassifications. The Committee on Banking Reforms has suggested inclusion of activities related to food processing, dairying and poultry in the priority sector list. This will increase the list of activities under the priority sector credit and also improve the quality of the portfolio. The priority sector should be considered as a percentage of the total assets of the banking system and not as a percentage of commercial advances as at present. The issue of priority sector lending, an important concern against privatization, is no longer that crucial, since in 2003 the share of credit of private sector banks going to the priority sector had surpassed that of public sector banks Table 2.
Indicators June, 1980 March, 1991 March, 2000 March, 2005
1.No. of SCBs 154 272 298 288
2. No. of bank offices Of which Rural & Semi-urban
34594
23227
60570
46550
67868
47693
68355
47485
3. Population per Office (‘000)
16 14 15 16
4. Per capita Deposit (Rs.)
738 2368 8542 16091
5. Per capita Credit (Rs.)
457 1434 4555 10440
6. Deposit (% to national income)
International Journal in Management and Social Science (Impact Factor- 4.358)
Table 2: Priority Sector Lending by Scheduled Commercial Banks
(In INR/ Million)
Source: Report on Trend and Progress of Banking in India, various issues
Figures in brackets represent percentages to net bank credit for the respective bank group.
Despite a decline, direct lending to the disadvantaged segments of the under the priority sector advances remained high during the reform period. The decline in priority sector lending since the initiation of reform infect reflects greater flexibility provided to banks to meet such targets. At present if a bank fails to fulfill the target for priority sector lending, it can invest the shortfall amount in RBI securities dealing with flow of funds towards agriculture and small-scale industries but it still desirable that banks adhere to the priority sector lending target. The current arrangement shows how the banking sector reforms have provided operational flexibility to the banks even while meeting social objectives.
The priority sector lending norms have been fulfilled by a good margin by both public and private sector banks at present. While public sector banks, as a group, achieved the overall priority sector targets 40 percent, they failed to achieve the various sub-targets for agriculture, tiny sector within the SSI sector, advances to weaker sections, etc. Significant variation was also observed in the performance of different banks within the public sector banks with regard to the achievement of sub-targets.
The performance of the private sector banks in the area of priority sector lending remain less satisfactory with 12 out of 30 private sector banks failing to achieve the overall priority sector targets. Only one private sector bank, ICICI Bank, could achieve the sub-targets within the priority sector. Private sector banks’ credit to weaker sections at 1.2 percent of net bank credit is much lower than the stipulated target of 10 percent for the sector. Foreign banks have achieved the overall priority sector targets and sub-targets for export credit and nearly achieve the sub-target with respect to SSI as well.
Public Sector Banks
Item 1997-98 1998-99 1999-00 2000-01 2001-02 2002-03 2003-04 2004-05
1 2 3 4 5 6 7 8 9
Priority Sector 913190 (41.8) 1040940 (39.2) 1274780 (40.2) 1491160 (43.7) 1711850 (43.1) 2030950 (42.5) 2444560 (43.6) 3100930 (43.3)
Agriculture 343050 (15.7) 376310 (14.2) 452960 (14.3) 535710 (15.7) 630820 (15.9) 735070 (15.4) 844350 (15.1) 1124750 (15.7)
International Journal in Management and Social Science (Impact Factor- 4.358)
Regulatory reforms
Since the beginning of the financial sector reforms, an important task of the policy makers was to bring in an appropriate regulatory framework. The design of an appropriate regulatory framework which encourages competition and efficiency in banking services and at the same time ensures a safe and sound banking sector may be very difficult and complex component of the banking sector liberalization process. The Narasimham Committee Report I have provided guidance on the actual design of the regulatory mechanism. The regulatory framework for banks known as “Prudential Regulation” in the literature consists of broadly of capital adequacy norms, restrictions on the lines of activities that banks can participate in, restrictions on entry and deposit insurance7.
The prudential regulatory framework for banks has been design to address the following some issues- Capital adequacy norms
Accounting and provision for NPAs,
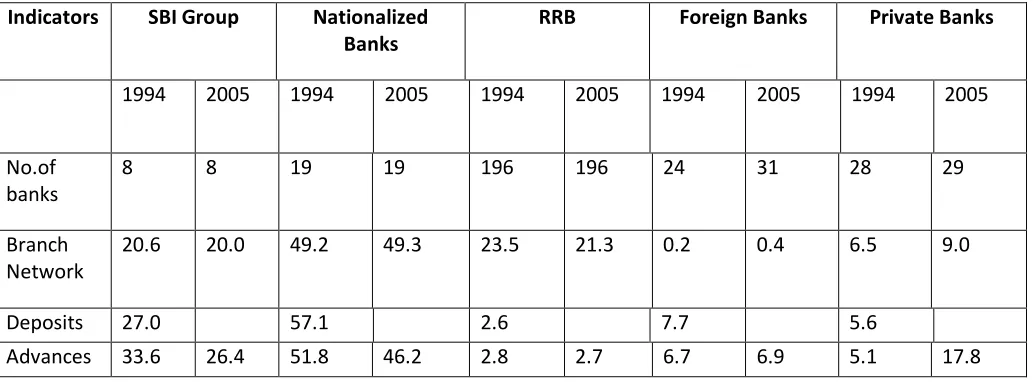
Even during the reform period the public sector banks are still having the largest banking network in India comprising around 90 percent of the total branches in 2005 (Table 3). In 1994 the share of public sector banks in total branch network was 93.5 percent and that of private sector bank
was a meager 6.5 percent. Thus the market structure of the Indian banking sector has not change much during the reform era. Though many new private sector banks have come up during the liberalization period but they are very slow and apprehensive regarding the opening of new offices as they are always guided by the profit motives. Therefore, the expansion of the private sector bank branches is not taking place at a fast rate as it is supposed to be. The foreign banks are mainly operating in the metropolitan and the urban areas only and they are also restrained by the govt. policy regarding opening of new branches by the foreign bank.
Table 3: Structure of Commercial Banks in India
Source: Report on Trend and Progress of Banking in India, various issues.
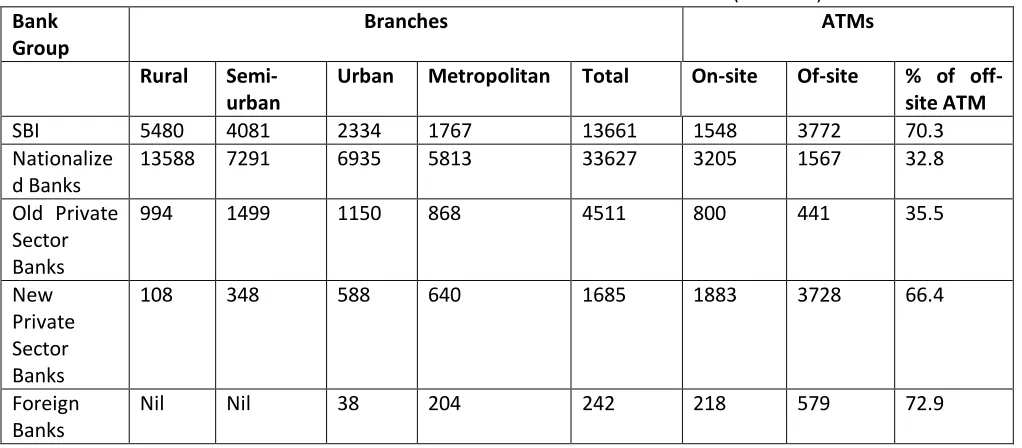
In recent years, a number of public sector banks and the private banks have set up ATMs and have expanded branch network to rural and semi urban areas. Table 4 has shown the branch network and number of ATMs in recent years. The computerization of bank branches has also taken momentum since 1993 and the process has got boosted with the entry of hi-tech private sector banks. From table 4 it is clear that the State Bank of India Group is the market leader with the largest number of branches
Indicators SBI Group Nationalized Banks
RRB Foreign Banks Private Banks
1994 2005 1994 2005 1994 2005 1994 2005 1994 2005
No.of banks
8 8 19 19 196 196 24 31 28 29
Branch Network
20.6 20.0 49.2 49.3 23.5 21.3 0.2 0.4 6.5 9.0
Deposits 27.0 57.1 2.6 7.7 5.6
International Journal in Management and Social Science (Impact Factor- 4.358)
specially in the rural and semi urban areas. The domestic private sector banks are also expanding their network of branches butconcentrating more on semi urban, urban and metropolitan areas. The foreign banks in India are mainly operating in urban and metropolitan areas with not a single branch in rural and semi urban places.
Table 4: Important indicators of India’s Banking Sector
(In billion) Year
Source: Report on Trend and Progress of Banking in India, various issues.
The efficiency of the Indian banking industry can be determined from the significant reduction in the interest spread over the reform period. The reduction has taken place across the bank groups but the spread is highest for the foreign banks and it the lowest for the new private sector banks (Table 5)
Bank Group
Branches ATMs
Rural Semi- urban
Urban Metropolitan Total On-site Of-site % of off-site ATM
SBI 5480 4081 2334 1767 13661 1548 3772 70.3
Nationalize d Banks
13588 7291 6935 5813 33627 3205 1567 32.8
Old Private Sector Banks
994 1499 1150 868 4511 800 441 35.5
New Private Sector Banks
108 348 588 640 1685 1883 3728 66.4
Foreign Banks
International Journal in Management and Social Science (Impact Factor- 4.358)
Table 5
Earnings and Expenses of the Scheduled Commercial Banks in India
(In percent)
Note: Spread= interest income – interest expenditure
Capital Adequacy Norms
One of the most important components of prudential regulation of banks is the maintenance of minimum capital ratios. The Basel Committee on Banking Regulation and Supervisory Practices,1988 known as Basel I, appointed by the Bank of International Settlements (BIS) recommended adoption of a common capital adequacy standard known as the Cook Ratio. The Cook Ratio is a risk-weighted
Bank Group 1996-97 2001-02 2002-03 2004-05
Operating Expenses/Total Assets
Scheduled
Commercial Banks Public Sector Banks
Old Private Sector Banks
New Private Sector Banks Foreign Banks 2.9 2.9 2.5 1.9 3.0 2.2 2.3 2.1 1.1 3.0 2.2 2.3 2.0 2.0 2.8 2.1 2.1 2.0 2.1 2.9 Spread/Total Assets Scheduled Commercial Banks Public Sector Banks
Old Private Sector Banks
New Private Sector Banks Foreign Banks 3.2 3.3 2.9 2.9 4.1 2.6 2.7 2.4 1.2 3.2 2.8 2.9 2.5 1.7 3.4 2.8 2.9 2.7 2.2 3.3
Net Profit/Total Assets
Scheduled
Commercial Banks Public Sector Banks
Old Private Sector Banks
International Journal in Management and Social Science (Impact Factor- 4.358)
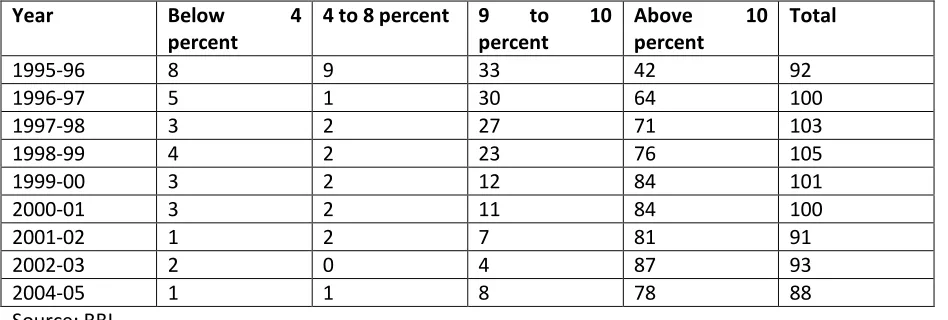
capital. For the purpose of calculation capital, BIS classifies capital into two broad categories, Tier I capital constituting share capital and disclosed reserves and Tier II capital consisting of undisclosed and latent reserves, general provision, hybrid capital and subordinated debt. BIS recommends that Tier II capital must not exceed Tier I capital. The Capital to Risk Asset Ratio (CRAR) suggested by BIS in 1992 was 8 percent, i.e. Tier I and Tier II capital should be equal to minimum of 8 percent of the total assets of the bank.The Narasimham committee 1991 has recommended that all banks in India must reach the figure in a phased manner latest by March 1996. In 1995, 13 of the 27 public sector banks had attained the 8 percent capital to risk assets ratio, 11 had reached 4 percent and remaining less than 4 percent. This move to achieve capital adequacy norms has been greatly boosted by the infusion of fresh capital in several public sector banks by the govt. in its 1993-94 and 1994-95 budgets by the amount of Rs.57000 million and Rs.56000 million respectively. Subsequently the strategy to attain CRAR of 8 percent was gradually raised to 9 percent with effect from 1999-2000. The overall capital position of commercial sector banks
Table 6: Distribution of commercial banks according to the CRAR
Source: RBI
had witnessed a mark improvement during the reform period (Table 6). At the end of March 2005, 86 out of the 88 commercial banks in India maintain CRAR at or above 9 percent. The corresponding figure for 1995-96 was 54 out of 92 banks.
Table 7: Capital Adequacy Ratio- Bank Group-Wise
(Percent)
Bank Group 1998 1999 2000 2001 2002 2003 2004 2005
Nationalised Banks
10.3 10.6 10.1 10.2 10.9 12.2 13.1 13.2
State Bank of India Group
14.0 12.3 11.6 12.7 13.3 13.4 13.4 12.4
Old Private Sector Banks
12.9 12.1 12.4 11.9 12.5 12.8 13.7 12.5
New Private Sector Banks
13.2 11.8 13.4 11.5 12.3 11.3 10.2 12.1
Foreign Banks 10.3 10.8 11.9 12.6 12.9 15.2 15.0 14.0 Source: Report on Trend and Progress of Banking in India, 2004-05
As far as the individual bank groups are concerned, all the five bank groups in India are maintaining CRAR above 12 percent in 2005. The CRAR level across the bank groups has been
Year Below 4
percent
4 to 8 percent 9 to 10 percent
Above 10 percent
Total
1995-96 8 9 33 42 92
1996-97 5 1 30 64 100
1997-98 3 2 27 71 103
1998-99 4 2 23 76 105
1999-00 3 2 12 84 101
2000-01 3 2 11 84 100
2001-02 1 2 7 81 91
2002-03 2 0 4 87 93
International Journal in Management and Social Science (Impact Factor- 4.358)
continuously increasing over the reform period. The foreign banks are having the highest level of CRAR in 2005 with 14 percent followed by nationalized banks with 13.2 percent. The new private sector banks have the lowest CRAR in 2005 that stood at 12.1 percent (Table 7).The norms are expected to raise capital requirement anywhere from 2 percent to 8 percent. The first pillar of Basel II moves beyond the “one size fits all” approach of 1998 and allow banks to follow one of two choices. The second pillar stresses oversight and monitoring of bank’s risk management by the top management and board of the bank. The third pillar refers to periodic reporting of specific variables by banks so as to allow the financial markets to appropriately value and discipline them.
Finally, transition from the old system to the Basel II norms would be very hard sailing for the Indian banks or to the RBI. For the next few years, this may be the greatest challenges for the Indian banking sector.
Accounting and Provisioning of NPAs
Following the recommendation made by Narasimham committee (1991), RBI had introduced regulation relating to income recognition, asset classification and provisioning in the bank’s borrowed accounts and to reflect actual health of banks in their balance sheets starting from 1992-93. The regulations have put in place objective criteria for asset classification, recognition of income and provisioning which are lacking hitherto. This change has brought in the necessary quantification and objectivity in to assessment of non-performing assets (NPAs) and provisioning in respect of problem credit.
With increasing freedom given to banks, a uniform and transparent accounting standard is critical to the effective monitoring of bank solvency. To start with, it is important to have a definition of the non-performing asset popularly called as NPA. NPA is an advance where payment of interest or repayment of installments of principal (in case Term Loans) or both remains unpaid for a period of two quarters or more. An amount under any of the credit facilities is to be treated as “past due” when it remains unpaid for thirty days beyond due date for four quarters up to March 1993, three quarters up to 1994 and two quarters in March 1995. Based on the status of the asset, an asset is classified on to four categories- standard, sub-standard, doubtful and loss asset. In India, standard assets are defined as credit facilities of which interest or principal or both are paid by due date. Generally, Sub-standard assets are called NPAs. A sub-standard asset is called doubtful asset if it remains NPA for two years 2000 (reduced to 18 months in 2001and further reduced to 12 months over a four year period starting from March 2005). An asset is called as loss, without any waiting period, where the dues are considered uncollectible or marginally collectible. The concept of past due in the identification of NPA was dispensed with from March 2001 and the 90 days delinquency norm was adopted for the classification of NPAs with effect from March 2004.
Depending upon the asset classification shown above, banks are to make provisions against NPAs as- 100 percent for loss assets; 100 percent for the unsecured portion plus 20 to 30 percent of the secured portion depending on the period for which the account has remained in doubtful category and general provision of 10 percent on the outstanding balance in respect of sub-standard assets from March 2000. Banks are also to classify small advances of Rs.25,000 and below in these four categories by March 1998 or they are to make provision at the rate of 15 percent of aggregate outstanding including performing loans. Commercial banks are also asked to make provision @ 0.25 percent on their standard advances from year ending March 31, 2000. Banks are also required to create provisions on govt. guaranteed NPAs from first April 2000.
In June 2004, RBI had advised banks to adopt graded higher provisioning in respect of - (a) secured portion of NPAs included in “doubtful” for more than three years category, and
International Journal in Management and Social Science (Impact Factor- 4.358)
Provisioning ranging from 60 percent to 100 percent over a period of three years in a phased manner, from the year ending March 31, 2005 has been prescribed. However, advances classified as doubtful for more than three years on or after April 1, 2004, the provisioning requirement has been stipulated at 100 percent. The provisioning requirement for the unsecured portion of NPAs under the above category was retained at 100 percent.The overall capital adequacy position of commercial banks has shown a great improvement during the reform period. At the end March 2005, 86 out of 88 commercial banks operating in India had maintained CRAR at above 9 percent which was 54 out of 92 banks in 1995-96.Regarding the asset quality of commercial banks, it has shown considerable improvement. The Indian banking industry has accepted a 90 days NPL recognition norm (from 180 days norm) in 2004. Non-Performing Loans (NPLs) as ratio of both total advances and assets have declined substantially and consistently since mid 1990s (Table 8).This has been caused by improvement in the credit appraisal process, upturn of the business cycle, new initiatives of NPLs like promulgation
Table 8: Non-performing loans (NPLS) of SCB (In percent)
Years Gross
NPL/Advances
Gross NPL/Assets Net NPL/Advances
Net NPL/Assets
1996-97 15.7 7.0 8.1 3.3
1997-98 14.4 6.4 7.3 3.0
1998-99 14.7 6.2 7.6 2.9
1999-00 12.7 5.5 6.8 2.7
2000-01 11.4 4.9 6.2 2.5
2001-02 10.4 4.6 5.5 2.3
2002-03 8.8 4.0 4.4 1.9
2003-04 7.2 3.3 2.9 1.2
2004-05 5.2 2.6 2.0 0.9
Source: Reserve Bank of India
Fig.-1
15.7
14.4 14.7
12.7
11.4
10.4
8.8
7.2
5.2 7
6.4 6.2
5.5
4.9 4.6
4
3.3
2.6 8.1
7.3 7.6
6.8
6.2
5.5
4.4
2.9 2
3.3 3 2.9
2.7 2.5 2.3
1.9
1.2 0.9
0 2 4 6 8 10 12 14 16 18
1996-97 1997-98 1998-99 1999-00 2000-01 2001-02 2002-03 2003-04 2004-05
Gross NPL/Advances
Gross NPL/Assets
Net NPL/Advances
International Journal in Management and Social Science (Impact Factor- 4.358)
of SARFAESI Act, greater provisioning and write-off of NPLs enabled by greater profitability, have kept incremental NPLs low. In 1992-93 RBI introduced prudential regulations regarding income recognition, asset classification and provisioning as suggested by Narasimham committee. These strict provisioning rules posed big challenges for the banks but they prevented the NPA situation in India from getting out of control and destabilizing the entire financial structure. The reasons and the factors leading to NPA may be listed under the following broad categories.a) Diversion of funds for expansion/modernization/setting up new projects etc. b) Time/cost overrun while implementing the project.
c) External factors like shortage of raw materials, input price escalation, power shortage, natural calamities, industrial recession, etc.
d) Business failure like failing to capture market, inefficient management, strike, etc. e) Govt. policies like excise, import duty changes, deregulation, etc.
f) Windfall default, siphoning of funds, fraud, misappropriation, management dispute, etc.
g) Deficiencies on the part of banks, viz., in credit appraisal, monitoring and follow up, delay in release of limits, delay in settlements of payments/subsidies by govt. bodies, etc.
It has been observed and also backed by evidence from a study of NPAs of 33 banks by RBI that the priority sector lending generates a higher proportion of NPAs than the non-priority sectors. But in recent years the relative contribution of non-priority sectors in the NPAs of banks has been increasing. Study has shown that the proportion of NPAs in the priority sector to the total NPAs was 48.27 percent as on 31st March 1996 and came down to 46.40 percent as on 31st March 1998.An important point to be noted here is that the priority sector advances constitute only 30 percent of gross bank credit during that period. However, gradual increase in the proportion of NPAs in the non-priority sectors could indicate that NPAs are increasingly occurring on borrowable accounts of industrial sector during the recent years. Table 13 shows sector-wise NPAs – Bank Group-wise at the end March 2004 and 2005.
Findings of the study
1) The number of Scheduled Commercial Banks in India has increased by not a very significant manner during the period of reforms.
2) The number of bank branches has also not increased much and the population per bank branch office has in fact increased during the reform period.
3) The per capita deposits and credits of the Scheduled Commercial Banks have gone up by 6 to 7 times during the period.
4) The borrowing made from the foreign sources by Indian firms, which are costlier compared to domestic sources prior to reforms, becomes cheaper due to the banking sector reforms undertaken in India.
5) In recent years all the commercial bank groups operating in India have been able to fulfill the priority sector norms laid down by RBI and competitions and opening up of the banking sector has not affected this at all.
6) The banking sector in India has given a measured responds to the reforms in terms of profitability of banks as almost all the commercial banks have been able to increase the volume of profits
7) Last but not the least the banking sector reforms has failed measurably in India when it comes to the privatization of the public sector banks as only 11 out of 20 banks have gone public by 2001 and faired very badly at the stock markets.
Conclusion
International Journal in Management and Social Science (Impact Factor- 4.358)
supervisory rating system. But at the same time the reform has failed to bring up a banking system which is at par with the international level and still the Indian banking sector is mainly controlled by the govt. as public sector banks being the leader in all the spheres of the banking network in the country.. References
1. Chakraborty, Rajesh (2006), “The Financial Sector in India: Emerging Issues”, P. 156, Oxford University Press.
2. Talwar, S. P. (2003), “Competition, Consolidation and Systematic Stability in the Indian Banking Industry”, BIS paper no. 4
3. Dhar, P. K. (2002), “Indian Economy its Growing Dimensions”, Kalyani Publishers. Committee on Financial System (1991), p.30.
4. Mohan, Rakesh (2006), “Financial Sector Reforms and Monetary Policy: The Indian Experience”, Lecture delivered at the “Conference on Economic Policy in Asia” at Stanford, June 2.
5. Mohan, Rakesh (2004b), “Financial Sector Reforms in India: Policies and Performance Analysis”, Reserve Bank of India Bulletin, October.
6. RBI Annual Report 2004-05.
7. Sen, Kunal, and R. R. Vaidya (1997), “The Process of Financial Liberalisation in India”, Oxford University Press.
8. Kohli, Renu (2005), “Liberalizing Capital Flows: India’s Experience and Policy Issues”, Oxford University Press.
9. Leeladhar, V. (2005), “Regulation and Risk Management: Implementing Basel II”, RBI Bulletin, August.
10. Kapila, Raj & Uma Kapila (2000), “Ongoing Developments in Banking and Financial Sector”, vol. 03.
11. Ahluwalia, M. S. (2002), “Reforming India’s Financial Sector: An Overview”, Oxford University Press.
12. Sarkar, A., N. (2005), “Strategic Business Management and Banking”,
13. Mathur, K. B. L. (2002), “Public Sector Banks In India: Should they be privatized?”, Economic and Political Weekly, 8 June.
14. Report on Trend and Progress of Banking in India, RBI, various issues.