Combining Ability and Gene Action for Yield and Its
Component Characters in Rice
1
M. Umadevi and 2S.Manonmani
1
Assistant Professor (PBG), Centre for Plant Breeding and Genetics, Tamil Nadu Agricultural University, Coimbatore – 641 003.
2
Professor and Head, HREC, Gudalur
ABSTRACT
Combining ability study on grain yield and its components from line x tester analysis over the locations of eight CMS lines and ten testers of different eco-geographic origin reveled specific combining ability was significant for all the traits except number of secondary branches per panicle and 100 grain weight in all the three environments and indicated that the importance of non additive gene effects for the expression of characters. The percentage contribution of lines was high in comparison to testers for all the traits under three environments except 100 grain weight in E2 showing that lines were diverse for these characters. IR 80559 A and IR 80154 A and two testers viz., IR 62037 R and ASD 06-8 R exhibited earliness was found to have significant gca for days to 50 per cent flowering, RR 363 R was found to be good general combiners for semi dwarf plant type in all the environments. The parents viz., IR 75601 A, IR 72081 A, IR 62037 R and TP 1021 R were adjudged as the best general combiners for yield and yield component traits.
Key words: Rice, combining ability, gene action, grain yield and component traits
INTRODUCTION
For improvement of any plant character through hybridization, it is necessary to
understand the nature of gene action and genetic architecture of the donor parents for that
character. Combining ability is the ability of an inbred to transmit their desirable performance
to its hybrid progeny. It helps in identification of parents with high general combining ability
(gca) effects and cross combinations with high specific combining ability (sca) effects and
gives an idea about the relative magnitude of additive and non-additive types of gene action in
expression of trait. Among the different genetic analyses, Line × Tester model is an important
one to find out the combining ability of parents with rapidity and confidence. With this
consideration the present study was undertaken to study the gene action and combining ability
in rice.
MATERIALS AND METHODS
Eight diverse CGMS lines of rice viz., IR 80559 A, APMS 6 A, IR 72081 A, IR 75601 A,
IR 75596 A, IR 80154 A, CRMS 32 A, IR 75608 A were crossed with ten diverse elite restorer
lines as testers viz., IR 62037-93-1-3-1-1 (IR 62037 R), IR 72865-94-3-3-2 (IR 72865 R), IR
68427-8-3-3-2 (IR 68427 R), MDU 5 R, ACK 99017 R, TP 1021 R, RR 363-1 (RR 363 R), RR 347-1 (RR
347 R), RR 286-1 (RR 286 R) and ASD 06-8 R) through Line x Tester mating design during rabi
2007. The resultant eighty hybrids along with their parents were sown in raised beds and 25 days old
seedlings were transplanted in main field under puddled condition under three environments (E1:
Coimbatore, E2: Bhavanisagar and E3: Aliyar Nagar). For each genotype, single seedling per hill
was planted at 20 x 20 cm spacing in two rows of 2.0 m length. Recommended fertilizer dose and
cultural practices were adopted. In each entry, five plants were selected randomly from two
replications and biometrical observations were recorded for eight quantitative characters viz., days to
50 per cent flowering, plant height, number of productive tillers per plant, panicle length,
number of secondary branches per panicle, number of grains per panicle, 100-grain weight and
grain yield per plant using Standard Evaluation System of rice proposed by International Rice
Research Institute. The estimates of general combining ability effects of the parents and
specific combining ability effects of the hybrids were worked out according to the model
illustrated by Kempthorne (1957).
RESULTS AND DISCUSSION
Analysis of variance is the pre requisite for further analysis of combining ability effects,
which are justified only when variances at different levels are significant. ANOVA for RBD in
individual environment showed significant differences among the hybrids under study in all the
three environments. Further, ANOVA for combining ability revealed that mean squares due to
general and specific combining ability were highly significant for all the traits. The analysis of
variance for combining ability (Table 1) indicated that variances due to lines, testers and
interaction effect (Line × Tester) were highly significant for all the characters. This trend
indicated the presence of both additive and non additive gene action. In the present study,
specific combining ability was significant for all the traits except number of secondary
branches per panicle and 100 grain weight in all the three environments and indicated that the
importance of non additive gene effects for the expression of characters. The pooled analysis of
variance for combining ability over three locations reveled that the variance due to parents,
hybrids, parent x hybrids interaction, lines and line x tester interaction were found to be
significant for all the characters while testers significantly differed among themselves for the
character single plant yield alone.
The GCA and SCA variances, additive and dominance genetic variances, their relative
proportions and their interaction over environments estimated for all the eight traits were
presented in table 1. The relative estimates of variances due to general and specific combining
ability indicated that specific combining ability variances were predominant for all the
characters in all the environment and pooled condition suggesting the significant role of non
additive gene action. The ratio of variances due to general and specific combining ability
ranged from -0.001:1 to 0.304:1. The results revealed that the dominance genetic variance (σ2D)
was higher in magnitude for all the eight traits studied. The proportional contribution from Line ×
Tester was higher for days to 50 per cent flowering, plant height, number of productive tillers per
plant, panicle length (except in environment 1), number of secondary branches per panicle,
100 grain weight, number of grains per panicle and single plant yield. This indicated the
predominance of non additive gene action for these traits. The percentage contribution of lines
was high in comparison to testers for all the traits under three environments except 100 grain
weight in E2 showing that lines were diverse for these characters. Predominance of non
additive gene action for grain yield and its components was also reported by Dalvi and Patel
(2009). Therefore, heterosis breeding method is best suited to harness the dominance gene
action.
A best general combiner is characterized by its better breeding value when crossed with
number of other parents. Besides, mean performance of a parent is also considered with gca
effects, since the former offers reliability / authenticity to gca effects as a guide in selection of
parents. Parents that had negative and significant gca effects were taken for the traits, days to
50 per cent flowering and plant height, while for other traits, parents with positively significant
gca effects were taken into consideration. The estimates of GCA effects revealed wide
differences among the parental lines for different quantitative traits and parental line was
identified as good general combiner for each character (Table 2). In the present study, two
CGMS lines viz., IR 80559 A and IR 80154 A and two testers viz., IR 62037 R (except in E3)
environments. Good general combiner for earliness was reported by Raju et al. (2006). The
parental lines IR 80154, IR 75608 (except in E3) and RR 363-1 were found to be good general
combiners for semi dwarf plant type in all the environments as they showed significant
negative gca effects combined with desirable low per se performance.
IR 80559 A and IR 80154 A and two testers viz., IR 62037 R and ASD 06-8 R exhibited
earliness was found to have significant gca for days to 50 per cent flowering, RR 363 R was
found to be good general combiners for semi dwarf plant type in all the environments. The
parents viz., IR 75601 A, IR 72081 A, IR 62037 R and TP 1021 R were adjudged as the best general
combiners for yield and yield component traits. Similar reports were reported by Rita Binse and
Motiramani (2005) and Singh et al. (2007).
Selection of parents based on per se performance and gca effects is of great importance
in breeding programmes, because it provides useful information on the choice of parents in
terms of expected performance of hybrids and progenies (Dhillon, 1975). Based on desirable
mean and gcaeffects of the trait, days to 50 per cent flowering, the parent MDU 5 R and ASD
06-8 R in E1and in E2 and IR 72865 R in E3 environments showed significant to early
flowering. Similarly, the parent IR 75608 A in E1 and E2 and the parents TP 1021 R, IR 62037
R and ASD 06-8 R in E3 were the best general combiners with desirable mean for the trait
plant height. Hence, the above mentioned parents can be utilized for developing early and
dwarf hybrids respectively.
The parent, IR 75601 A was found to be the best one since, it possessed high per se and
gca for three traits viz., number of productive tillers per plant in all the environments and
pooled, panicle length (E3, pooled) and single plant yield (E2, pooled). The parents MDU 5 R
was early in flowering in E1, number of grains per panicle for all the environments and pooled
condition, 100 grain weight in E3, pooled and single plant yield in E2, pooled and TP 1021 R
recorded dwarf and more number of grains per panicle in E3, pooled, single plant yield in E1,
E2 and in pooled were the best general combiners with desirable mean value. The parent IR
72081 A was identified as the best parents as they had high mean and gca effects for single
plant yield in all the environments and pooled, number of grains per panicle in E1, E2, pooled
and 100 grain weight in E1 and in pooled. Similar findings were observed by Sarma et al.
(2007) for single plant yield, number of grains per panicle and panicle length.
The hybrids viz., CRMS 32 A X RR 363 R, IR 80154 A X IR 62037 R and
IR 75596 A X MDU 5 R were found to be specific combination in all the three environments and in
pooled for most of the yield contributing traits including single plant yield and were also found to
have higher per se performance. The hybrid, APMS 6 A X TP 1021 R was found to be specific
combination in all the three environments and in pooled for most of the yield contributing traits
including single plant yield and also found to have higher per se performance in E1. These desirable
cross combinations involved high x high type of general combiners. Salgotra et al. (2009) also
reported about interaction between positive and positive alleles in crosses involving high x high
combiners which can be fixed in subsequent generations if no repultion phase linkages are involved.
It could be concluded that, crosses involving IR 75601 A, IR 72081 A, ASD 06-8 R,
MDU 5 R and TP 1021 R as parents would result in superior segregants with favourable alleles
and can be used as potential donors for the improvement of yield and yield component traits
(Table 3). CRMS 32 A x RR 363 R, IR 80154 A x IR 62037 R (Fig.1) and
IR 75596 A x MDU 5 R were identified as most promising crosses for yield based on sca effects,
better per se with high gca for yield per plant, could be exploited profitably for yield in rice.
References
Dhillon, B.S. 1975. The application of partial diallel crosses in plant breeding-A review. Crop Improv., 2(1): 1-7.
Kempthorne, O. 1957. An introduction to genetic statistics. John Wiley and Sons, Inc. New York: 458-471.
Raju, C.H.S., M.V.B. Rao and A. Sudarsanam. 2006. Heterosis and genetic studies on yield and associated physiological traits in rice. Oryza, 4(3): 264-273.
Rita Binse, C. and N.K. Motiramani. 2005. Study on gene action and combining ability in rice. Oryza, 42(2): 153-155.
Sarma, M.K., A.K. Sharma, R.K. Agarwal and A.K. Richharia. 2007. Combining ability and gene action for yield and quality traits in Ahu rices of Assam. Indian J. Genet., 67(3): 278-280.
Singh, N.K., Anand Kumar and Ramesh Kumar. 2007. Combining ability for yield and yield components in rice. Oryza, 44(2): 156-159.
Dalvi, V.V. and Patel, D.V. (2009). Combining ability analysis for yield in hybrid rice. Oryza, 46 (2), 97-102.
Salgotra, R.K., Gupta, B.B. and Praveen Singh. (2009). Combining ability studies for yield and yield components in basmati rice. Oryza, 46 (1), 12-16.
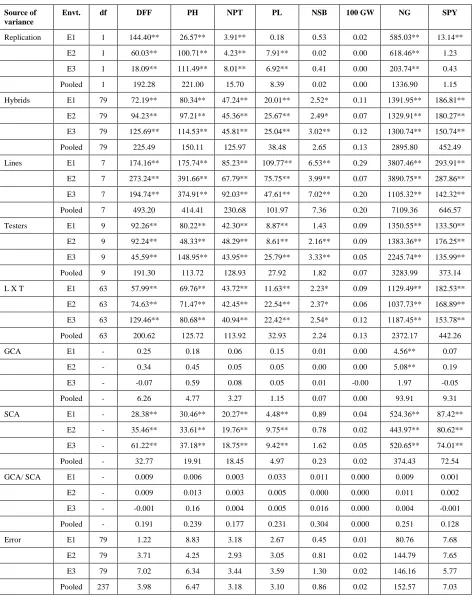
Table 1. ANOVA for combining ability for different quantitative traits in individual and pooled environment
Source of variance
Envt. df DFF PH NPT PL NSB 100 GW NG SPY
Replication E1 1 144.40** 26.57** 3.91** 0.18 0.53 0.02 585.03** 13.14**
E2 1 60.03** 100.71** 4.23** 7.91** 0.02 0.00 618.46** 1.23
E3 1 18.09** 111.49** 8.01** 6.92** 0.41 0.00 203.74** 0.43
Pooled 1 192.28 221.00 15.70 8.39 0.02 0.00 1336.90 1.15
Hybrids E1 79 72.19** 80.34** 47.24** 20.01** 2.52* 0.11 1391.95** 186.81**
E2 79 94.23** 97.21** 45.36** 25.67** 2.49* 0.07 1329.91** 180.27**
E3 79 125.69** 114.53** 45.81** 25.04** 3.02** 0.12 1300.74** 150.74**
Pooled 79 225.49 150.11 125.97 38.48 2.65 0.13 2895.80 452.49
Lines E1 7 174.16** 175.74** 85.23** 109.77** 6.53** 0.29 3807.46** 293.91**
E2 7 273.24** 391.66** 67.79** 75.75** 3.99** 0.07 3890.75** 287.86**
E3 7 194.74** 374.91** 92.03** 47.61** 7.02** 0.20 1105.32** 142.32**
Pooled 7 493.20 414.41 230.68 101.97 7.36 0.20 7109.36 646.57
Testers E1 9 92.26** 80.22** 42.30** 8.87** 1.43 0.09 1350.55** 133.50**
E2 9 92.24** 48.33** 48.29** 8.61** 2.16** 0.09 1383.36** 176.25**
E3 9 45.59** 148.95** 43.95** 25.79** 3.33** 0.05 2245.74** 135.99**
Pooled 9 191.30 113.72 128.93 27.92 1.82 0.07 3283.99 373.14
L X T E1 63 57.99** 69.76** 43.72** 11.63** 2.23* 0.09 1129.49** 182.53**
E2 63 74.63** 71.47** 42.45** 22.54** 2.37* 0.06 1037.73** 168.89**
E3 63 129.46** 80.68** 40.94** 22.42** 2.54* 0.12 1187.45** 153.78**
Pooled 63 200.62 125.72 113.92 32.93 2.24 0.13 2372.17 442.26
GCA E1 - 0.25 0.18 0.06 0.15 0.01 0.00 4.56** 0.07
E2 - 0.34 0.45 0.05 0.05 0.00 0.00 5.08** 0.19
E3 - -0.07 0.59 0.08 0.05 0.01 -0.00 1.97 -0.05
Pooled - 6.26 4.77 3.27 1.15 0.07 0.00 93.91 9.31
SCA E1 - 28.38** 30.46** 20.27** 4.48** 0.89 0.04 524.36** 87.42**
E2 - 35.46** 33.61** 19.76** 9.75** 0.78 0.02 443.97** 80.62**
E3 - 61.22** 37.18** 18.75** 9.42** 1.62 0.05 520.65** 74.01**
Pooled - 32.77 19.91 18.45 4.97 0.23 0.02 374.43 72.54
GCA/ SCA E1 - 0.009 0.006 0.003 0.033 0.011 0.000 0.009 0.001
E2 - 0.009 0.013 0.003 0.005 0.000 0.000 0.011 0.002
E3 - -0.001 0.16 0.004 0.005 0.016 0.000 0.004 -0.001
Pooled - 0.191 0.239 0.177 0.231 0.304 0.000 0.251 0.128
Error E1 79 1.22 8.83 3.18 2.67 0.45 0.01 80.76 7.68
E2 79 3.71 4.25 2.93 3.05 0.81 0.02 144.79 7.65
E3 79 7.02 6.34 3.44 3.59 1.30 0.02 146.16 5.77
Pooled 237 3.98 6.47 3.18 3.10 0.86 0.02 152.57 7.03
** Significant at 1 % level * Significant at 5 % level
Table 3. Parents selected based on per se performance and gca effects
Character Coimbatore
(E1)
Bhavanisagar
(E2)
Aliyar Nagar
(E3)
Days to 50 per cent flowering MDU 5, ASD 06-8 ASD 06-8 IR 72865
Plant height IR 75608 IR 75608 IR 62037, TP 1021, ASD
06-8
Number of productive tillers per plant
IR 75601 IR 75601 IR 75601, CRMS 32
Panicle length IR 80559 RR 363-1 IR 75601, IR 80154
Number of secondary branches per panicle
ASD 06-8 ACK 99017 IR 80559, IR 80154
100 grain weight IR 72081,
IR 75596, IR 62037
- MDU 5
Number of grains per panicle IR 72081, MDU 5 IR 72081, MDU 5 MDU 5, TP 1021,
IR 75596
Single plant yield IR 72081, IR 75596, TP
1021
IR 72081, IR 75601, IR 62037, MDU 5, TP 1021
IR 72081, APMS 6
Best performers MDU 5, IR 72081,
IR 75596, ASD 06-8
ASD 06-8, IR 75601 IR 72081, MDU 5
IR 75601, IR 72081, MDU 5, TP 1021
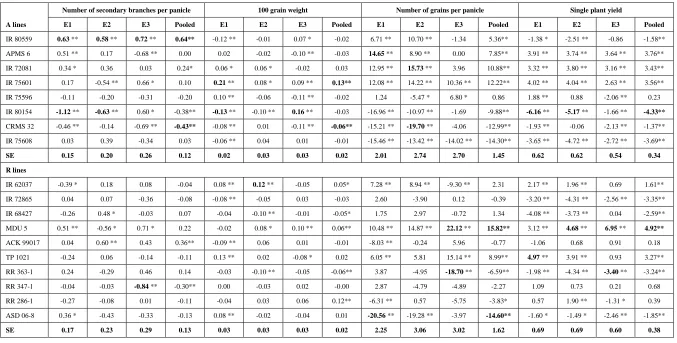
Table 2. The gca effects of parents for yield and component traits in individual and pooled environment.
A lines
Days to 50 % flowering Plant height Number of productive tillers per plant Panicle length
E1 E2 E3 Pooled E1 E2 E3 Pooled E1 E2 E3 Pooled E1 E2 E3 Pooled
IR 80559 -6.25 ** -5.40 ** -1.87 ** -4.51** 2.34 ** 5.72 ** 1.36 * 3.14** -2.13 ** -2.54 ** -3.30 ** -2.66** 2.96 ** 1.61 ** 0.96 * 1.84**
APMS 6 -0.45 -0.80 1.64 ** 0.13 -0.56 0.71 -4.13 ** -1.33** 0.35 0.15 0.40 0.30 1.45 ** 0.77 -1.46 ** 0.25
IR 72081 1.35 ** 1.05 * -2.80 ** -0.13 0.34 1.95 ** 2.87 ** 1.72** 2.16 ** 2.07 ** 1.69 ** 1.97** -0.07 -0.27 -0.79 -0.38
IR 75601 -0.30 -2.30 ** -2.78 ** -1.79** -0.09 2.44 ** 2.07 ** 1.47** 2.31 ** 1.83 ** 3.07 ** 2.40** 1.60 ** 1.18 ** 1.26 ** 1.35**
IR 75596 3.45 ** 3.35 ** 4.69 ** 3.83** 3.04 ** 1.30 ** 4.16 ** 2.84** 0.70 0.00 -0.83 * -0.04 0.26 -0.63 0.70 0.11
IR 80154 -1.25 ** -2.30 ** -3.62 ** -2.39** -5.22 ** -7.37 ** 0.80 -3.93** -2.29 ** -2.39 ** -1.39 ** -2.02** -4.42 ** -4.00 ** 1.03 * -2.47**
CRMS 32 2.15 ** -0.16 2.48 ** 1.49** 3.16 ** 1.29 ** -8.88 ** -1.48** 1.57 ** 1.76 ** 1.94 ** 1.76** -2.26 ** -0.83 * 1.22 ** -0.63
IR 75608 1.30 ** 6.55 ** 2.27 ** 3.37** -3.02 ** -6.03 ** 1.75 ** -2.44** -2.64 ** -0.90 * -1.59 ** -1.71** 0.48 2.18 ** -2.89 ** -0.08
SE 0.25 0.43 0.59 0.26 0.66 0.46 0.56 0.33 0.39 0.38 0.42 0.23 0.37 0.39 0.42 0.23
R lines
IR 62037 -2.56 ** -3.09 ** 0.43 -1.74** 0.10 -1.35 * -1.74 ** -0.10 1.75 ** 1.66 ** 1.17 * 1.53** -0.29 -0.29 -1.86 ** -0.81**
IR 72865 -1.31 ** -1.34 ** -3.13 ** -1.93** 0.33 0.37 -2.55 ** -0.62 -0.66 -0.76 -0.76 -0.73** 0.62 -0.06 -0.02 0.18
IR 68427 -0.44 -0.41 0.95 0.03 -1.61 * -0.48 3.22 ** 0.38 -0.36 -1.30 ** -1.82 ** -1.16** -1.11 ** -1.12 * -0.82 -1.02**
MDU 5 -0.69 * -0.39 0.19 -0.31 -0.74 -1.38 ** 1.54 * -0.19 0.99 * 1.20 ** 1.27 ** 1.15** 1.02 * 0.52 1.24 * 0.92**
ACK 99017 3.25 ** 4.16 ** 2.68 ** 3.36** 1.91 * 1.18 * 1.85 ** 1.65** 0.03 0.03 1.19 * 0.41 -0.60 -1.06 * 0.18 -0.49
TP 1021 2.19 ** 0.81 -0.35 0.88** 0.78 2.02 ** -1.96 ** 0.28 3.19 ** 3.20 ** 2.79 ** 3.06** 0.46 0.45 2.31 ** 1.07**
RR 363-1 1.81 ** 1.67 ** -0.07 1.14** -4.92 ** -3.18 ** -2.69 ** -3.59** -2.34 ** -2.71 ** -2.43 ** -2.49** 0.71 0.93 * -1.03 * 0.20
RR 347-1 2.00 ** 2.42 ** 1.86 ** 2.09** 3.45 ** 1.66 ** -1.87 ** 1.08** -0.54 0.56 0.41 0.15 0.52 0.85 1.27 ** 0.88**
RR 286-1 0.25 -0.16 -0.69 -0.20 -0.43 -0.87 6.27 ** 1.66** -1.79 ** -1.65 ** -1.59 ** -1.68** -0.82 * 0.27 -0.61 -0.39
ASD 06-8 -4.50 ** -3.69 ** -1.87 ** -3.35** 1.14 2.01 ** -2.05 ** 0.37 -0.27 -0.22 -0.23 -0.24 -0.49 -0.50 -0.65 -0.55**
SE 0.28 0.48 0.66 0.29 0.74 0.52 0.63 0.37 0.44 0.43 0.46 0.26 0.41 0.44 0.47 0.25
Table 2. The gca effects of parents for yield and component traits in individual and pooled environment. (Contd.,)
A lines
Number of secondary branches per panicle 100 grain weight Number of grains per panicle Single plant yield
E1 E2 E3 Pooled E1 E2 E3 Pooled E1 E2 E3 Pooled E1 E2 E3 Pooled
IR 80559 0.63 ** 0.58 ** 0.72 ** 0.64** -0.12 ** -0.01 0.07 * -0.02 6.71 ** 10.70 ** -1.34 5.36** -1.38 * -2.51 ** -0.86 -1.58**
APMS 6 0.51 ** 0.17 -0.68 ** 0.00 0.02 -0.02 -0.10 ** -0.03 14.65 ** 8.90 ** 0.00 7.85** 3.91 ** 3.74 ** 3.64 ** 3.76**
IR 72081 0.34 * 0.36 0.03 0.24* 0.06 * 0.06 * -0.02 0.03 12.95 ** 15.73 ** 3.96 10.88** 3.32 ** 3.80 ** 3.16 ** 3.43**
IR 75601 0.17 -0.54 ** 0.66 * 0.10 0.21 ** 0.08 * 0.09 ** 0.13** 12.08 ** 14.22 ** 10.36 ** 12.22** 4.02 ** 4.04 ** 2.63 ** 3.56**
IR 75596 -0.11 -0.20 -0.31 -0.20 0.10 ** -0.06 -0.11 ** -0.02 1.24 -5.47 * 6.80 * 0.86 1.88 ** 0.88 -2.06 ** 0.23
IR 80154 -1.12 ** -0.63 ** 0.60 * -0.38** -0.13 ** -0.10 ** 0.16 ** -0.03 -16.96 ** -10.97 ** -1.69 -9.88** -6.16 ** -5.17 ** -1.66 ** -4.33**
CRMS 32 -0.46 ** -0.14 -0.69 ** -0.43** -0.08 ** 0.01 -0.11 ** -0.06** -15.21 ** -19.70 ** -4.06 -12.99** -1.93 ** -0.06 -2.13 ** -1.37**
IR 75608 0.03 0.39 -0.34 0.03 -0.06 ** 0.04 0.01 -0.01 -15.46 ** -13.42 ** -14.02 ** -14.30** -3.65 ** -4.72 ** -2.72 ** -3.69**
SE 0.15 0.20 0.26 0.12 0.02 0.03 0.03 0.02 2.01 2.74 2.70 1.45 0.62 0.62 0.54 0.34
R lines
IR 62037 -0.39 * 0.18 0.08 -0.04 0.08 ** 0.12 ** -0.05 0.05* 7.28 ** 8.94 ** -9.30 ** 2.31 2.17 ** 1.96 ** 0.69 1.61**
IR 72865 0.04 0.07 -0.36 -0.08 -0.08 ** -0.05 0.03 -0.03 2.60 -3.90 0.12 -0.39 -3.20 ** -4.31 ** -2.56 ** -3.35**
IR 68427 -0.26 0.48 * -0.03 0.07 -0.04 -0.10 ** -0.01 -0.05* 1.75 2.97 -0.72 1.34 -4.08 ** -3.73 ** 0.04 -2.59**
MDU 5 0.51 ** -0.56 * 0.71 * 0.22 -0.02 0.08 * 0.10 ** 0.06** 10.48 ** 14.87 ** 22.12 ** 15.82** 3.12 ** 4.68 ** 6.95 ** 4.92**
ACK 99017 0.04 0.60 ** 0.43 0.36** -0.09 ** 0.06 0.01 -0.01 -8.03 ** -0.24 5.96 -0.77 -1.06 0.68 0.91 0.18
TP 1021 -0.24 0.06 -0.14 -0.11 0.13 ** 0.02 -0.08 * 0.02 6.05 ** 5.81 15.14 ** 8.99** 4.97 ** 3.91 ** 0.93 3.27**
RR 363-1 0.24 -0.29 0.46 0.14 -0.03 -0.10 ** -0.05 -0.06** 3.87 -4.95 -18.70 ** -6.59** -1.98 ** -4.34 ** -3.40 ** -3.24**
RR 347-1 -0.04 -0.03 -0.84 ** -0.30** 0.00 -0.03 0.02 -0.00 2.87 -4.79 -4.89 -2.27 1.09 0.73 0.21 0.68
RR 286-1 -0.27 -0.08 0.01 -0.11 -0.04 0.03 0.06 0.12** -6.31 ** 0.57 -5.75 -3.83* 0.57 1.90 ** -1.31 * 0.39
ASD 06-8 0.36 * -0.43 -0.33 -0.13 0.08 ** -0.02 -0.04 0.01 -20.56 ** -19.28 ** -3.97 -14.60** -1.60 * -1.49 * -2.46 ** -1.85**
SE 0.17 0.23 0.29 0.13 0.03 0.03 0.03 0.02 2.25 3.06 3.02 1.62 0.69 0.69 0.60 0.38
** Significant at 1 % level * Significant at 5 % level
Fig.1. IR 80154 A x IR 62037 R