Intelligent impedance based fault-location for zonal power systems
C. Rose
∗, D. Thomas, M. Sumner, E. Christopher, S. L. Arevalo
∗University of Nottingham, UK, [email protected]
Keywords: Impedance estimation; fault location; protection.
Abstract
A laboratory based demonstrator has been constructed to study the Active Impedance Estimation (AIE) technique as a means of locating faults on a power system. The demonstrator has been used to verify results from simulation experimentally. The AIE system and associated signal processing are presented and some of the issues that have been encountered are dis-cussed. The presented simulation and experimental results pre-sented both validate the method used.
1
Introduction
Increasing use of distributed generation (DG) is placing new demands on grid protection technologies [1]. It is possible for DG to cause protection circuitry to erroneously react to faults in another area of the system or to fail to operate correctly [2]. This is a particular problem with commonly used time- and current-graded protection schemes. DG also has the potential to cause islanding, where a part of the grid continues to op-erate despite being isolated from the rest of the system. It is important to be able to detect such conditions and to either dis-connect DG sources or to allow the island to continue operating in a controlled manner. Correct operation of system protection is essential in order to ensure the minimum possible disruption to consumers in the event of a fault condition.
These changes in power generation strategies require new, more advanced methods of power system protection [1, 2, 3]. An indication of the type and location of a fault can be very useful in determining what protective action is required at any particular location within the system [4]. If the fault is suffi-ciently far from the area being protected, then depending on the control strategy used, it may be possible for DG to con-tinue operating until the fault has cleared or been isolated [5]. However, nearby faults will require DG to be disconnected if the fault cannot be rapidly cleared. Impedance estimation tech-niques have been shown to be a useful and flexible tool in iden-tifying, locating and classifying faults [6].
This paper describes one impedance estimation technique, Ac-tive Impedance Estimation (AIE), first described in [7], and how it has been used to locate and classify faults. AIE aims to calculate the impedance from the point of measurement to
the fault. The calculated impedance is then used to give an es-timate of the distance to the fault. This information can then be used to either attempt to locate the fault or determine if the fault has occurred outside of the area being protected by AIE. An experimental system has been set up to emulate a system incorporating DG and results from this system have been used to confirm simulation results for a similar system.
2
Experimental system
2.1 Active Impedance Estimation
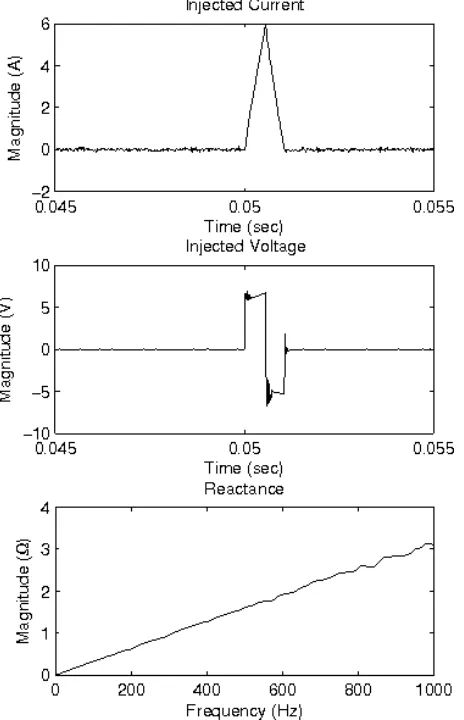
AIE is a method for estimating the system impedance by intro-ducing a small, short-term, current disturbance [7]. The AIE unit consists of a power electronic inverter which is used to in-ject the current disturbance onto the power system. The current disturbance lasts for 1 ms and assuming the system impedance is small, the amplitude is limited by the size of the inverter’s filter inductor. For the AIE unit used in this paper, a 6 mH in-ductor was used and the peak current injection amplitude was limited to approximately 6 A, as shown in Figure 1.
The current disturbance is captured, along with the associ-ated voltage disturbance, and used to calculate the system impedance. This calculated impedance can then be com-pared to the known, healthy impedance limits of the system. A low impedance indicates a fault has occurred; assuming this impedance is dominated by the cable impedance to the fault, the fault may be located by comparing the calculated impedance with the per-unit-length cable impedance. An un-usually high impedance can be indicative of a loss of grid sup-ply, such as in an island condition. For this reason, the design of the unit is such that existing power electronics, such as a grid-tie inverter for a PV system with modifications to the con-trol algorithms, could be used.
For the AIE unit used in this paper, a total of 1 s of current and voltage data was captured. This gives a resolution of 1 Hz for the impedance estimation. Although the sampling rate was 50 kHz, the 1 ms injection length causes results above 1 kHz to rapidly decrease in accuracy. For this reason, impedance estimates in this paper are all in the range of 0–1 kHz.
the estimated reactance for a 500µH inductor are shown in Figure 1.
Fig. 1:Results obtained when the AIE method is used to esti-mate the impedance of a 500µH inductor.
The signal processing algorithms used are straightforward. The impedance is calculated using (1), where F represents
the Discrete Fourier Transform andVinjandIinjrepresent the captured injection voltage and current respectively. A window function may also be used to improve the quality of results. For all the results presented in this paper, a Blackman window was applied to all captured voltages and currents, which was found to substantially reduce the effect of measurement noise on the results. For an energised system it will also be necessary to compensate for the fundamental and any harmonics already present. This can be achieved by capturing some pre-injection data and subtracting from the injection captured. For simplic-ity de-energised results are presented in this paper to illustrate the principle of fault location.
Z = F(Vinj)
F(Iinj). (1)
After the processing described, an ordinary least squares
curve-fit is applied to the results. The resistance and induc-tance are both assumed to be constant. The resisinduc-tance is cal-culated as the average real part of the impedance. The induc-tance is calculated as the gradient of the imaginary part of the impedance. For the sample results shown, the calculated in-ductance is found to be 501µH. In a system where the ca-ble impedance is dominated by the reactive component, low impedance faults can be readily located by comparing the es-timated reactance with the reactance for the total length of the cable.
2.2 Experimental power system
The system studied consists of four zones, with 10 m of cable between adjacent zones and an additional 10 m of cable from the first zone back to the local supply. The system has a low cable X/R ratio. At 50 Hz, the cable resistance is larger than the reactance by a factor of 10, giving an X/R ratio of 0.1. This could affect the accuracy of fault location for high-resistance faults; however, the wideband impedance estimation from AIE should allow the reactive impedance to be used to locate the fault as the reactance will increase with frequency, giving an X/R ratio of 2 at 1 kHz.
The aim of the study was to determine where a fault had oc-curred between zones. Determining how the accuracy of fault location would be affected by the low X/R ratio of the system was also of interest, as it would be useful to use only the in-ductance estimate as a measure of fault location, allowing the resistance to be used as an indication of fault severity.
16 mm2cabling was used for the connections between zones.
[image:2.595.311.540.570.687.2]Each zone consists of a short length of busbar and a number of contactors for connecting and disconnecting loads. The ca-ble inductance has been measured as approximately 0.8µH/m, as measured using an impedance analyser [8]. In simulation a slightly higher value of 1µH was used as accurate cable pa-rameters were not available at the time. In both cases, cable resistance is approximately 2.5 mΩ/m. The source impedance is 500µH and represents the approximate combined reactance of a generator and feeder cable. The layout of the test system is shown in Figure 2.
Fig. 2:The experimental set up used to study the AIE tech-nique.
The AIE unit is connected to Zone 1. Zone 1 is also connected to the supply, with an inductive impedance of 500µH and an-other 10 m of cable. During testing, phase-to-neutral faults are connected at each of the zones, at the locations labelled F1, F2, F3 and F4.
The tests performed included two unfaulted conditions and four faulted conditions. The purpose of the unfaulted tests was to determine the healthy limits of the system as seen by the AIE unit. The faulted tests involved imposing a phase-to-neutral fault at each of the zones; the purpose of these tests was to determine if the AIE results could be used to locate the fault.
3
Results
3.1 Simulation Results
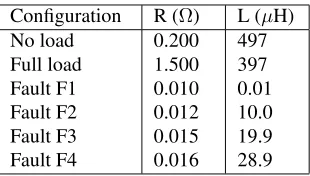
A number of tests were performed on a representation of the described system in simulation using the SimPowerSystems blockset in Simulink to confirm the theoretical validity of the method and to better understand the signal processing require-ments. Simulations were run on a de-energised system with no faults, at no load and full load in order to estimate the range of system impedances expected during normal operation. Tests were also performed with faults with resistance 0.01 Ω oc-curring at 10 m intervals along the bus. Table 1 gives the impedance identified using AIE for the tests preformed during simulation.
Configuration R (Ω) L (µH) No load
Full load Fault F1 Fault F2 Fault F3 Fault F4
0.200 1.500 0.010 0.012 0.015 0.016
[image:3.595.92.247.424.512.2]497 397 0.01 10.0 19.9 28.9
Table 1:Simulation results for six configurations of the de-energised system.
The simulation results confirm the theoretical validity of both the method and the signal processing algorithms used. From the simulation results it can be seen that the fault impedance can be accurately identified using AIE under ideal conditions. The purpose of the practical experimentation was to confirm that the results from simulation were indicative of the be-haviour of the AIE technique in a real environment.
3.2 Experimental Results
Similar tests to those carried out in simulation were performed on the system described in Section 2.2. The system impedance in various configurations was measured using an impedance analyser for comparison with the results obtained using AIE. For calibration purposes, only the impedance at 1 kHz was measured.
Figures 3 and 4 show results for AIE tests performed for faults at locations F1 and F4 respectively. Very little change is seen in the injected current as the impedance being estimated in both cases is small. A more noticeable change is seen in the voltage disturbance. In the case of a fault at F1, the amplitude of the voltage disturbance is small and noise can clearly be seen to have an influence on the captured data. In the case of a fault at F4, the amplitude has increased by a factor of 3 and the influ-ence of noise has clearly been reduced. In both cases, the reac-tive impedance estimation shows a clear posireac-tive gradient, as would be expected from a predominantly inductive reactance.
Fig. 3:AIE measurements and estimated reactance for a fault at location F1.
within Zone 1.
Fig. 4:AIE measurements and estimated reactance for a fault at location F4.
Most of the impedance estimates using AIE agree with those from calibration, for both the resistive and inductive results. The largest error is seen with the results from estimation of the impedance for a fault at F1, where the estimated inductance is considerably larger than in the calibration results. This is mostly due to the very small impedance being estimated, caus-ing measurement error and noise to have a significant contribu-tion to the results. The mostly resistive impedance of the small wire link used to impose the fault also has a more significant effect for faults near to the point of measurement.
3.3 Simulation Results for an Energised System
In addition to the simulation results already described, addi-tional simulation was performed for the same system with a 400 V three-phase supply connected. Fundamental and har-monic compensation was performed by subtracting 1 s of pre-transient data from the 1 s of captured data. This compensation technique relies on the assumption that the state of the system does not change during the time data capture is taking place. The data capture period is also large; for a practical implemen-tation it would be necessary for the capture time to be reduced
Calibration AIE Configuration R (Ω) L (µH) R (Ω) L (µH) No load
Full load Fault F1 Fault F2 Fault F3 Fault F4
0.41 0.65 0.02 0.08 0.11 0.13
510 340 3.21 11.7 17.3 23.7
0.38 0.70 0.05 0.08 0.12 0.15
514 335 6.9 11.6 17.1 24.4
Table 2:Results for the experimental system, for both calibra-tion and AIE tests.
in order to allow AIE to rapidly locate a fault.
[image:4.595.51.284.91.447.2]Simulation results for AIE tests on the system at full load are shown in Figure 5. For best results, the injection is timed to coincide with the zero voltage crossings of the system. The increase in injection current amplitude is due to the increase in inverter DC link voltage. The effect of a slight error during compensation can be seen at 50 Hz in the results. Although this could easily be removed entirely in simulation, it is useful to observe how this potential source of error may affect results.
Fig. 5:Simulation results for AIE impedance measurement for the system at full load
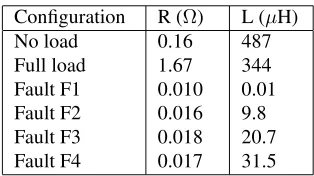
[image:4.595.312.543.356.698.2]Configuration R (Ω) L (µH) No load
Full load Fault F1 Fault F2 Fault F3 Fault F4
0.16 1.67 0.010 0.016 0.018 0.017
[image:5.595.90.247.78.166.2]487 344 0.01 9.8 20.7 31.5
Table 3:Results obtained from repeating simulations for an energised system.
on an energised system. The results for a fault at location at F1 are identical to those for a de-energised system. For all other results, some error is introduced by imperfect compensation for the fundamental. For fault conditions, this error increases as distance to the fault increases. This error is also expected to increase if harmonics are present on the supply. However, the results show that AIE can be expected to give good results for an energised system.
4
Conclusions
This paper has presented a study of AIE as a fault location method. Results have shown that the technique can be used to identify the system impedance during fault conditions and that the reactive component of the impedance can be used to estimate the distance to the fault. The wideband impedance estimation used by AIE allows the reactive component of the impedance to be used as the primary measure of the fault lo-cation, even on systems having a low X/R ratio, such as the one studied. Further work may be required to improve results for low impedance estimations. Further study is planned for a more complex system.
Although experimental results were only obtained for a de-energised system, simulation results suggest that it should be possible to use AIE on an energised system. Modifications to the existing system are currently in progress to allow the impedance to be estimated whilst the system is energised.
References
[1] M. T. Doyle. “Reviewing the impacts of distributed gen-eration on distribution system protection”,Power Engi-neering Society Summer Meeting, IEEE,volume 1, pp. 103-105, (2002)
[2] I. Xyngi, M. Popov. “Smart Protection in Dutch Medium Voltage Distributed Generation Systems”, Innovative Smart Grid Technologies Conference Europe, IEEE PES, pp. 1-8, (2010)
[3] L. Xia, L. Yu-ping, W. Lian-he. “The Study of the tion Revision Method Based on the DG Effect to Protec-tion Sensitivity”,Sustainable Energy Technologies, 2008. ICSET 2008. IEEE International Conference on, pp. 24-27, (2008)
[4] Y. Gong, A. Guzman. “Integrated fault location system for power distribution feeders”,IEEE transactions on in-dustry applications,volume 49pp. 1071-1078, (2013) [5] A. H. Kasem, H. H. Zeineldin, J. L. Kirtley. “Microgrid
stability characterization subsequent to fault-triggered is-landing incidents”,IEEE transactions on power delivery,
volume 27, 658-669, (2012)
[6] R. H. Salim, K. C. O. Salim, A. S. Bretas. “Further im-provements on impedance-based fault location for power distribution systems”,IET Generation, Transmission & Distribution,volume 5, pp. 467-478, (2011)
[7] M. Sumner, B. Palethorpe, D. W. P. Thomas, P. Zanchetta, and M. C. Di Piazza. “A technique for power supply harmonic impedance estimation using a controlled voltage disturbance”, IEEE Transactions on Power Electronics,volume 17, pp. 207-215, (2002) [8] Newtons4th Ltd. “LCR Active Head and Impedance